http://dx.doi.org/10.4236/ajibm.2014.43018
Management Participation and Firm
Performance
Juliana Mulaa Namada1, Evans Aosa2, Zachary Awino2, Gituro Wainaina3 1School of Business, United States International University, Nairobi City, Kenya
2Department of Business Administration, School of Business, University of Nairobi, Nairobi, Kenya 3Department of Management Science, School of Business, University of Nairobi, Nairobi, Kenya
Email: [email protected]
Received 10 February 2014; revised 10 March 2014; accepted 17 March 2014
Copyright © 2014 by authors and Scientific Research Publishing Inc.
This work is licensed under the Creative Commons Attribution International License (CC BY).
http://creativecommons.org/licenses/by/4.0/
Abstract
This study sought to establish the relationship between management participation and firm per-formance. The study was premised in the applauded significant role that management participa-tion plays on firm performance. However, a glaring knowledge gap established from literature re-view indicate a paucity of empirical support to the extent of the relationship with both the finan-cial and none finanfinan-cial performance. Firms in Export Processing Zones (EPZs) in Kenya were stu-died. Significant relationship was established only with internal business process performance. Theoretically, the study showed that management participation is a much more complex variable moderated by other factors. Therefore, managers ought to focus on moderating factors like cul-ture and diversity to understand the relationship between management participation and per-formance.
Keywords
Firm; Management Participation; Performance
1. Introduction
the achievement of the Kenyan Vision 2030 which is a development blue print that seeks to enable the country to achieve the status of a developing nation. This has been attributed to fiscal, administrative and tax incentives defined by the Kenyan economic policy [6]. Although management participation plays a key role in firm per-formance, there are few studies elucidating the relationship specifically in growing economies where EPZ prac-tice is an economic growth strategy. The motivation of this study was therefore to determine the influence of management participation in the performance of firms. The results will inform policy makers, managers and practitioners about management participation and performance.
2. Literature Review
2.1. Management Participation
Participation focuses on involvement in processes at different levels. Participation taps into concepts of breath and depth of involvement. Reference [7] defined management participation as the collective level of the man-agement involvement within and across the firm. Manman-agement spreads beyond the top executive to include mid-dle and lower cadre managers [8]. Literature suggests that participative management approach could increase the firms informational processing, utilize knowledge dispersed across the firm, provide more alternatives, facilitate opportunity recognition and help the organization to avoid overlooking good ideas [7] [9].
Reference [8] identified three possible types of middle level management involvement in strategic planning. They argued that managers synthesize, interpret and channel information to the executive. Reference [2] articu-lated the fourth type of management involvement stemming from the middle level as implementing deliberate strategy through action planning. Reference [2] argued that a certain degree of uniformity is required among middle level managers for an organization to achieve consistency. He observed that such consistency is asso-ciated with improved performance. Conversely, reference [1] found that involvement of middle level manage-ment increases an understanding of the resulting goals, leading to convergence of strategic priorities within the firms.
2.2. Firm Performance
The debate on performance is unconcluded. A number of studies focus on financial while others focus on non financial performance. Studies which used traditional performance measurements were based on traditional ac-counting systems which were criticized for lack of objectivity, consistency and open to internal manipulations [10]. Indeed in recent performance research, there has been a drift from exclusive use of financial performance measures to inclusion of non financial performance measures. This approach is practically valuable and in line with the multidimensionality of performance construct. Reference [11] argued that measuring performance play an important role in translating strategy into results. However, as noted by reference [12] measuring perfor-mance is difficult especially when what has to be measured keeps changing and is multifaceted.
The need for organizations to align their performance measures with goals are well documented in literature. The complexities of managing the organizations today require that managers analyze different dimensions of performance because performance itself is multidimensional. Performance measurements are not ends in them-selves, but are useful tools through which managerial purposes are achieved. Reference [13] outlined eight ma-nagerial purposes achieved through performance. He observed that performance is used in evaluation, control, motivation, promotion, celebration, learning and improvement of different processes. Therefore, no single per-formance measure is adequate in capturing all the eight perper-formance uses hence the adoption multidimensional measures of performance defined by the balanced score card between adoption and multidimesional.
2.3. Management Participation and Firm Performance
Reference [15] observed that management participation generates both informational and emotional effects in the organization. Notably, [16] argued that management involvement reduces organizational resistance and creates a higher level of psychological commitment among employees towards the proposed changes. Participa-tion leads to qualitatively better strategic decisions [9]. One reason for this argument is that, broader array of re-levant skills, competencies and information is brought to bear on each stage in the strategic decision process. Further, participation makes the political realities of the organization more salient leading to balanced political, social and technical considerations within organizations.
Studies on the influence of management participation on performance have yielded mixed results. Reference [17] noted that there is a strong theoretical support that management participation enhances achievement of out-comes. Further, [18] reported that management participation in strategic planning clearly influences utilitarian planning consequences (strategic capability, coordination, communication and adaptability) and psychological planning consequences (morale, commitment to the firm, motivation). Conversely, a study by [7] established that participative management styles were significantly associated with high overall profits and financial success within foodservice industry in USA. Similarly, [19] indicated that managerial cognition plays a central role in capability development and deployment of human resources.
Other studies however, have established negative and non significant influence of management participation on performance. A study by [20] established no significant relationship between management participation and strategic planning effectiveness. Possible reason as observed by [21] could be that management participation was moderated by other factors not considered in the study. Further, management participation is a complex is-sue which depends on contextual factors such as power politics, organizational culture and the type of leadership. As observed by [7] the concept of management participation is much more complex than has been previously thought.
In view of the literature reviewed the following hypothesis was formulated to guide the study; H0: Management participation has no significant relationship with firm performance.
3. Methods
Research DesignThe study adopted a descriptive cross sectional survey. Descriptive cross sectional design helps in discovery of relationships among different variables [22]. It enabled the researcher to capture data at a given time of the study while minimizing temporal effect of the study variables so as to interpret the relationships among study va-riables and draw possible conclusions. An appropriate research design provides confidence to scientific inquiry and ensures reliability and validity of the proposed study [23]. A cross sectional approach was preferred for this research not only because it facilitates data collection from different respondents at one point in time but also it provides standard data that facilitates comparison across different respondents. Reference [24] observed that cross sectional approaches are robust in relationship studies and enhance the credence of results at a given point in time. Cross sectional survey designs have been used in previous local studies such as [25] [26].
This study adopted triangulation approach. Triangulation refers to the use of different data collection tech-niques to enhance validity [27]. Data was collected using both primary and secondary sources. Triangulation in this study enabled the researcher to gain an accurate picture of the variables being studied. Each of these me-thods complimented one another by filling in data gaps which the other method is incapable of capturing. In this study triangulation also offered a basis of comparison. Reference [28] argued that triangulation not only facili-tates credibility of the study but also enables complementarity of different methods. The population of this study comprised of all operational EPZ firms in Kenya.
in terms of the number of repeat customers, number of referrals from previous customers, number of compli-ments received, number of complaints received, change in market share, number of returned products, customer collaborations, customer retention and customer loyalty.
The sampling frame which had 84 firms in EPZs in Kenya was obtained from EPZA in March, 2012. The EPZA is the government regulatory authority which facilitates the operations of the firms. The determination of an appropriate sample size is important for a researcher to have a credible representation of the population. There are different methods available for sample size determination. This study adopted [29] procedure of sam-ple size determination. The approach is based on population size and the basic minimum is 100 units.
Primary data was collected through structured questionnaires on the measures of management participation and none financial performance. The measures were computed into composite variables which were used in re-gression analysis. While secondary data was collected through document review. Secondary data consisting of annual sales figures made it possible to compute sales growth rate ratios while return on investment ratios was computed from annual sales figures, purchases, capital inputs and the costs.
Reliability test for this questionnaire was done through Cronbachs’ Alpha coefficients. The coefficients range from 0 to 1 and the higher the coefficient, the more reliable the scale. The overall Apha coefficient for the sam-ple was put at recommended value of 0.70 [30]. This value normally indicates an excellent level of internal con-sistency for questionnaire. All the Alpha coefficients for the study were above 0.70. Hence in [30] words, the research instrument was reliable. Content validity for this study was determined through expert opinion and pilot study. Experts in strategic management who comprised of lecturers and practitioners were given the question-naires to provide their opinion on the suitability of different measures and suggest possible ways of improving the items. A pilot study was carried out before rolling out the main study. After the pilot study, the questionnaire was modified according to the data sets established in EPZs. Data analyzed for this study was collected from 40 firms making 62.5 percent response rate out of the 60 operational firms at the time of the study. Initially 84 firms had been targeted but 24 firms could not be included in the study due to various reasons.
Respondent demographic profiles were tabulated to shed light on specific characteristics. Male executives were the majority respondents representing 75 percent while female executives represented 25 percent of the to-tal responses. Out of the male respondents, 27.5 percent were managing directors who formed majority of the respondents while human resource was the least category representing 7.5 percent. Overall, majority of the res-pondents were managing directors.The gender balance is important because it stipulates the proportion of eco-nomic power distribution between men and women. Today in Kenya, gender balance is a question of constitu-tional concern. There has been the desire for gender balance both in the public and private sectors focusing on equal distribution of economic power.
In terms of education level, majority of the respondents had bachelor’s degree level of education represented by 47.5 percent while holders of doctorate level of education represented 2.5 percent. Of all the respondents who were degree holders 42.5 percent were male while only 5 percent were female. Level of education indicates lite-racy and ability of the respondents to make informed managerial decisions. It indicates the respondents capabili-ties in terms of decision making based on education and professional training.
4. Findings and Results
4.1. Profiles of Responding Firms
The profiles of the responding firms for this study included age, ownership and expatriate employment. These profiles were determined by factors related to the export business. According to [31] report, EPZ firms receive different types of incentives from the government. The incentives are classified in terms of fiscal, procedural and infrastructural categories. While the fiscal and procedural incentives are policy related and apply uniformly to all the firms, the infrastructural incentives are location specific and vary depending on the specific zone. These variations arise from provisions of basic requirements like roads, electricity, water, sewerage, security, storage and warehousing facilities.
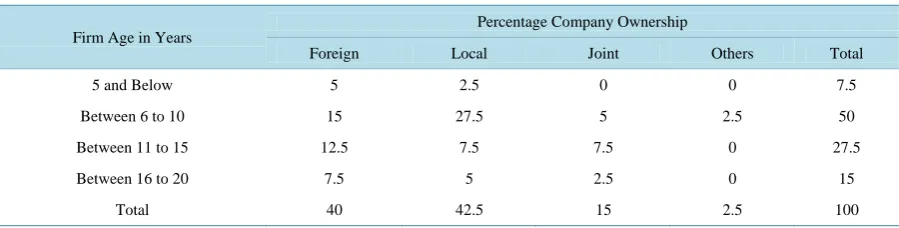
Table 1. Firm age in relation to ownership.
Firm Age in Years
Percentage Company Ownership
Foreign Local Joint Others Total
5 and Below 5 2.5 0 0 7.5
Between 6 to 10 15 27.5 5 2.5 50
Between 11 to 15 12.5 7.5 7.5 0 27.5
Between 16 to 20 7.5 5 2.5 0 15
Total 40 42.5 15 2.5 100
of time compared to the local firms. Age is an indicator of cumulative experiences and each additional year of survival reveal significant evidence of capability.
Table 2 shows that expatriate employment was an important revelation of this study. It was observed that firms employed different numbers of expatriates according to the need. The findings showed that 60 percent of the firms employed expatriates while 40 percent did not. The highest percentage of expatriate employment was found to be in locally owned firms which constituted 42.5 percent of all the expatriates employed. Expatriate employment is important mainly because of technical, managerial skill and technology transfer within the firms. This research established that EPZ firms employed expatriates in technical areas to facilitate technology and skill transfer.
4.2. Hypothesis Testing
Management participation was regressed against four measures of performance; return on investment, sales growth rate, internal business process and market performance and the results of the regression are indicated below.
H0a: Management participation has no significant relationship with return on investment performance.
Table 3 shows that the coefficient of determination of management participation on return on investment
performance was 0.239. It means that 23.9 percent of return on investment performance was explained by man-agement participation and the remaining 76.1 percent was explained by other factors not considered in the model.
Table 4 shows the overall significance of the model with a p-value of 0.349 which was more than 0.05 and the
null hypothesis was not rejected. Therefore, management participation does not have a significant relationship with return on investment performance.
The beta coefficients of management communication was −0.236 with t value of −1.138, managerial time used in planning had beta coefficient of −0.026 with t-value of −0.109 while management expertise had beta coefficient of −0.391 with t-value of −1.935. On the other hand, management involvement in strategic planning activities had a beta coefficient of 0.229 with t-value of 1.112 while managerial influence of strategic choices had beta coefficient of 0.284 with t-value of 1.240. However, none of the beta coefficients was significant which means that the independent variables do not explain the changes in return on investment performance.
H0b: Management participation has no significant relationship with sales growth rate performance.
Table 5 shows that, the coefficient of determination of management participation and sales growth rate was 0.185, which means that 18.5 percent of the sales growth rate was explained by management participation. The remaining 81.5 percent was explained by other factors not considered in the model. Table 6 shows the overall model significance with a p-value of 0.644 which is more than 0.05 and the null hypothesis was not rejected. Therefore, management participation does not have significant relationship with sales growth rate performance. The beta coefficients of the explanatory variables were tabulated as follows. Management communication had beta coefficient of 0.142 with t value of 0.847, managerial time spent on planning had 0.309 with t value of 1.607, managerial involvement in decision making had −0.204 with t value of −1.226, managerial influence on strategic choices had beta of −1.179 with t value of −0.964 while managerial expertise used in decision making had beta of −0.135 and t-value of −0.829. However, none of the coefficients was significant which means that the independent variables do not explain changes in sales growth rate performance.
Table 2. Firm ownership and expatriate employment.
Company Ownership
Percentage of Expatriate Employees
Without Expatriates Below 10 Between 10 - 20 Between 20 - 30 Between 30 - 40 Total
Foreign 10 17.5 5 2.5 5 40
Local 25 7.5 10 0 0 42.5
Joint 5 10 0 0 0 15
Other 0 0 2.5 0 0 2.5
Total 40 35 17.5 2.5 5 100
Table 3. Management participation and return on investment performance.
Model Summary
Model R R Square Adjusted R Square Std. Error of the Estimate
1 0.489 0.239 0.039 0.626
[image:6.595.88.540.330.399.2]a Predictors: (Constant), Management expertise used in planning process, Management communication during the planning process, Management in-volvement in strategic decision making, Management influences on strategic choices, Time is spent by managers on planning activities. b Dependent Variable: Return on Investment Performance.
Table 4. Analysis of variance of management participation on return on investment performance.
ANOVA
Model Sum of Squares df Mean Square F Sig.
1
Regression 2.348 5 0.470 1.195 0.349
Residual 7.463 19 0.393
Total 9.810 24
a Dependent Variable: Return on Investment Performance. b Predictors: (Constant), Management expertise used in planning process, Management communication during the planning process, Management involvement in strategic decision making, Management influences on strategic choices, Time is spent by managers on planning activities.
Table 5. Management participation and sales growth rate performance.
Model Summary
Model R R Square Adjusted R Square Std. Error of the Estimate
1 0.431 0.185 −0.086 0.462
a Predictors: (Constant), Management expertise used in planning process, Management communication during the planning, Management involve-ment in strategic decision making, Manageinvolve-ment influences on strategic choices, Time is spent by managers on planning. b Dependent Variable: Sales Growth Rate Performance.
Table 6. Analysis of variance of management participation sales growth rate performance.
ANOVA
Model Sum of Squares df Mean Square F Sig.
1 Regression 0.731 5 0.146 0.683 0.644
Residual 3.212 15 0.214
Total 3.943 20
[image:6.595.89.537.555.626.2]a Dependent Variable: Sales Growth Rate Performance. b Predictors: (Constant), Management expertise used in planning process, Management communication during the planning process, Management involvement in strategic decision making, Management influences on strategic choices, Time is spent by managers on planning.
Table 7 shows that R2 of management participation and internal business processes performance was 0.378
Table 7. Management participation and internal business process performance.
Model Summary
Model R R Square Adjusted R Square Std. Error of the Estimate
1 0.615 0.378 0.284 0.586
[image:7.595.89.541.210.297.2]a Predictors: (Constant), Management expertise used in planning process, Management communication during the planning process, Management in-volvement in strategic decision making, Management influences on strategic choices, Time is spent by managers on planning activities. b Dependent Variable: Internal Business Processes Performance.
Table 8. Analysis of variance of management participation and internal business process performance.
ANOVA
Model Sum of Squares df Mean Square F Sig.
Regression 6.876 5 1.375 4.010 0.006
Residual 11.316 33 0.343
Total 18.191 38
a Dependent Variable: Internal Business Processes Performance b Predictors: (Constant), Management expertise used in planning process, Manage-ment communication during the planning process, ManageManage-ment involveManage-ment in strategic decision making, ManageManage-ment influences on strategic choices, Time is spent by managers on planning activities.
therefore the null hypothesis was rejected and concluded that management participation has a significant rela-tionship with internal business process performance.
Below are the beta coefficients for the explanatory variables as indicated in the model. Managerial time used in planning had beta coefficient of −0.267 with t value of −1.514, management communication had beta coeffi-cient of 0.083 with t-value of 0.539, managerial involvement in decision making had beta of 0.279 with t value of 1.882, managerial influence on strategic choices had beta coefficient of 0.350 with t value of 2.058 while management expertise in planning processes had a coefficient of 0.183 with t value of 1.219. Managerial influ-ence used in strategic choices had positive coefficient of 0.350 and a p-value of 0.048 which was less than α = 0.05. The relationships are represented by the following equation:
(
) (
)
Internal Business Process Performance 2.623 C 0.350 MGTINFL
0.000 0.048
= − +
Key: C—Constant; MGTINFL—Management influence on strategic choices.
The regression equation shown above indicates that a unit change in managerial influence on strategic choices causes a change of 0.350 units in internal business process performance. On the other hand the constant was −2.623, which means that without management participation, the value of internal business process performance was predicted to be negative 2.623.
H0d: Management participation has no significant relationship with market performance
Table 9 shows that the coefficient of determination for the relationship between management participation
and market performance was 0.231 and this means that 23.1 percent of market performance was explained by management participation. The remaining 76.9 percent was explained by other factors not considered in the model. Table 10 shows the overall model significance with a p-value of 0.106, which is more than 0.05 and the null hypothesis therefore was not rejected and concluded that management participation does not have a signifi-cant relationship with market performance.
Table 9. Management participation and market performance.
Model Summary
Model R R Square Adjusted R Square Std. Error of the Estimate
1 0.481 0.231 0.115 0.489
a Predictors: (Constant), Management expertise used in planning process, Management communication during the planning process, Management in-volvement in strategic decision making, Management influences on strategic choices, Time is spent by managers on planning. b Dependent Variable: Market Performance.
Table 10. Analysis of variance of management participation on market performance.
ANOVA
Model Sum of Squares df Mean Square F Sig.
Regression 2.375 5 0.475 1.988 0.106
Residual 7.885 33 0.239
Total 10.26 38
a Dependent Variable: Market Performance. b Predictors: (Constant), Management expertise used in planning process, Management communication during the planning process, Management involvement in strategic decision making, Management influences on strategic choices, Time is spent by managers on planning.
5. Discussion of the Results
Management participation is pertinent in the achievement of certain measures performance. Extant literature has reported mixed empirical findings on the relationship between management participation and firm performance. References [8] [15] established that performance is influenced by what happens at middle level management. On the contrary, references [14] and [18] reported no significant relationships between management participation and firm performance.
This study reported mixed findings on the relationship between management participation and different measures of performance. The results indicated positive and significant influence of management participation only on internal business process performance. Conversely, no significant association was established between management participation with return on investment, sales growth rate and market performance. These findings are in line with prior studies that focused on management participation. Reference [15] study done in UK estab-lished a direct relationship between participation and effectiveness. They concluded that an effective planning system facilitates achievement of effectiveness. An important observation from this study was that an effective planning process was one which harnesses positive tendencies of participation while at the same time mitigating the negative ones. Reference [7] established a significant positive relationship between management participa-tion and overall profits together with financial success.
Significant relationships between management participation and internal business process performance are in line with [30] study which demonstrated that managers are an important source of value creation. The findings also provided insights into the arguments that managerial actions determine a firm success. An important con-tribution of this study to the resource based perspective in line with [31] offer support for the view that although resources may provide performance advantages, realizing the benefit depends on the way managers bundle, deploy and synchronize resources. This study shows that indeed the managerial ability to synchronize different processes within the organization is critical to the realization of better performance. The finding was consistent with the view that the manager’s abilities to build, integrate, manage and configure organizational resources are routed in managerial involvement [17].
[image:8.595.89.546.200.276.2]be-tween participation and outcomes. In essence, there is still much to learn and explore about the nature and in-fluence of management participation in strategic planning performance.
6. Conclusion and Implications
Management participation significantly influenced only the internal business process performance. Conversely, the rest of the performance measures which included return on investment, sales growth rate and market perfor-mance were not significantly influenced. These results are in line with past studies which focused on manage-ment participation and performance and reported mixed results. A possible explanation of the mixed findings has been attributed to other factors which moderate the relationship. Differences in the managerial hierarchy in terms of the top, middle and lower cadre could be possible explanations of the mixed findings.
The importance of understanding how management participation which was the overall objective of this study becomes better appreciated. This is in light of the significant percentage of capital investment ploughed to the firms in EPZs by both the local entrepreneurs and multinational companies. Further, the importance attached to the achievement of Vision 2030 requires the ultimate success of EPZ firms which are the vehicles through which the vision will be achieved. This study contributes to business and public policy by providing evidence of the correlation between management participation and the performance. The EPZs have become instruments of economic policy development in developing countries seeking to gain advantages from the growing integration of the global economy. In essence, policymakers need to consider the alignment of policy recommendations and important firm attributes to enhancing the achievement of better performance.
The research findings indicate that participatory management approaches are important as they enhance strat-egy implementation success and performance. The findings from this study show that management participation in different settings is largely inconclusive. These findings have revealed that indeed participation is a much more complex issue than that has often been held both as a theoretical construct and empirical phenomenon. Future studies could focus on the moderated relationships between management participation and performance. Possible moderators could be organizational culture, power politics and company size.
References
[1] Floyd, S.W. and Wooldridge, B. (1990) Middle Management Involvement in Strategy and Its Association with Stra-tegic Type. Strategic Management Journal, 13, 153-167. http://dx.doi.org/10.1002/smj.4250131012
[2] Floyd, S.W. and Wooldridge, B. (1997) Middle Management’s Strategic Influence and Organizational Performance.
Journal of Management Studies, 34,465-485. http://dx.doi.org/10.1111/1467-6486.00059
[3] Ketokivi, M. and Gastner, X. (2004) Strategic Planning as an Integrative Device. Administrative Science Quarterly, 49, 337-365.
[4] Feigner, M.K. (2005) Determinants of Board Participation in the Strategic Decisions of Small Corporations. Entrepre-neurship Theory and Practice, 29, 627-650. http://dx.doi.org/10.1111/j.1540-6520.2005.00101.x
[5] EPZA (2011) Performance of Export Processing Zones Firms, Annual Report.
[6] GOK (2007) Economic Survey. Ministry of State for Planning and National Development. Nairobi, Central Bureau of Statistics.
[7] Ogbeide, G.A. and Harrington, J.R. (2011) The Relationship among Participative Management Styles, Strategy Im-plementation and Performance in Service Industry. International Journal of Hospitality Management, 23, 719-738.
[8] Currie, G. and Procter, S.J. (2005) The Antecedents of Middle Managers Strategic Contribution: The Case of Profes-sional Bureaucracy. Journal of Management Studies, 42, 1325-1355.
http://dx.doi.org/10.1111/j.1467-6486.2005.00546.x
[9] O’Regan, N., Sims, M.A. and Gallear, D. (2008) Leaders, Loungers, Laggard: The Strategic Planning, Environment, Performance Relationship Re-Visited in Manufacturing Small and Medium Enterprises. Journal of Manufacturing Technology Management, 19, 6-21. http://dx.doi.org/10.1108/17410380810843426
[10] Pun, K.F. and White, A.S. (2005) A Performance Measurement Paradigm for Integrating Strategy Formulation: A Re-view of Systems and Frameworks. International Journal of Management Reviews, 1, 49-71.
http://dx.doi.org/10.1111/j.1468-2370.2005.00106.x
[11] Hubbard, G. (2009) Measuring Organizational Performance: Beyond the Triple Bottom Line. Business Strategy and Environment, 19, 177-191. http://dx.doi.org/10.1002/bse.564
http://dx.doi.org/10.1111/1540-6210.00322
[13] Kaplan, S.R. (2001) Strategic Performance Measurement and Management in Non-Profit Organizations. Non-Profit Management and Leadership, 11, 353-370. http://dx.doi.org/10.1002/nml.11308
[14] Lines, R. (2004) Influence of Participation in Strategic Change: Resistance, Organizational Commitment and Change Goal Achievement. Journal of Change Management, 4, 193-215. http://dx.doi.org/10.1080/1469701042000221696
[15] Dayson, R.G. and Foster, M.J. (1982) The Relationship of Participation and Effectiveness in Strategic Planning. Stra-tegic Management Journal, 3, 77-88. http://dx.doi.org/10.1002/smj.4250030107
[16] Freeman, E.B. (1989) Effectiveness of Strategic Planning: A Multidimensional View. Academy of Management Best Paper Proceedings, Washington DC, 1989, 12-16.
[17] Eggers, J.P. and Kaplan, S. (2013) Cognition and Capabilities. Academy of Management Annals, 7, 293-338.
http://dx.doi.org/10.1080/19416520.2013.769318
[18] Elbanna, S. (2008) Planning and Participation as Determinants of Strategic Planning Effectiveness: Evidence from Arabic Context. Management Decisions, 46, 779-796. http://dx.doi.org/10.1108/00251740810873761
[19] Cooper, D.R. and Schindler, P.S. (2006) Business Research Methods.8th Edition, McGraw Hill, Tata.
[20] Kerlinger, N.F. (2007) Foundations of Behavioural Research.Surjeet, New Delhi.
[21] O’Sullivan, D. and Abela, V.A. (2007) Marketing Performance Measurement Ability and Firm Performance. Journal of Marketing, 71, 79-93. http://dx.doi.org/10.1509/jmkg.71.2.79
[22] Aosa, E. (1992) An Empirical Investigation of Aspects of Strategy Formulation and Implementation within Large Pri-vate Manufacturing Companies in Kenya. Unpublished PhD Thesis, University of Strathclyde, Glasgow.
[23] Awino, Z.B. (2010) Effects of Selected Strategy Variables on Corporate Performance: A Survey of Supply Chain Management in Large Private Manufacturing Firms in Kenya. Lambert Academic Publishing, Saarbrucken.
[24] Saunders, M., Lewis, P. and Thornhill, A. (2009) Research Methods for Business Students.5th Edition, Prentice Hall, Harlow.
[25] Lee, N. and Lings, I. (2008) Doing Business Research: A Guide to Theory and Practice. Sage Publishers, London.
[26] Bartlett, J.E., Kotrlik, J.W. and Higgins, C. (2001) Organizational Research: Determining Appropriate Sample Size in Survey Research. Information Technology, Learning and Performance Journal, 19, 43-50.
[27] Nunnaly, P. (1978) Psychometric Theory. McGraw Hill, New York.
[28] EPZA (2010) Export Processing Zones Incubator Project. Annual Report.
[29] Chabari, N. (2000) The Role of EPZ in Kenya: An Assessment. Unpublished MA Thesis, University of Nairobi, De-partment of Economics.
[30] Holcomb, T.R., Holmes, R.M. and Connelly, B.L. (2009) Making the Most of What You Have: Managerial Ability as Source of Resource Value Creation. Strategic Management Journal, 30, 457-485.