Efficient Contrast Enhancement using Kernel Padding
and DWT with Image Fusion
Deepak Kumar Pandey
P.G.Scholar, Department of ECNIIST, Bhopal, India
Rajesh Nema
Head, Department of ECNIIST, Bhopal, India
ABSTRACT
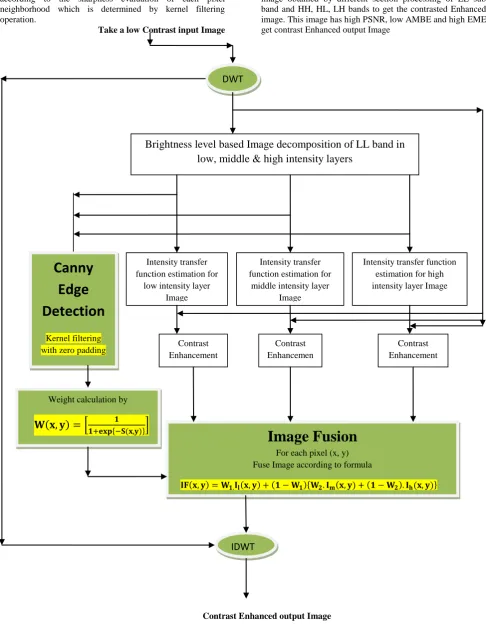
Contrast enhancement algorithms for varying intensity distribution Images creates intensity distortion in some regions, over enhancement & unnatural effects in other regions of Images. The main reason of this effect is due to not consideration of image edges & sharp details during enhancement process. On the other hand, the human visual system is more sensitive to edges and sharp details of image. In this paper we are proposing a method titled efficient contrast Enhancement using Kernel Padding and DWT with Image Fusion that Enhances the contrast of Images that has varying intensity distribution specially satellite images, preserve the brightness of images, sharpens the edges and remove the blurriness of images. Basically this is a pixel based edge guided image fusion technique. In this method LL sub band of Image DWT is processed by contrast enhancement section where based on image brightness level image is decomposed in different layers and then each layers intensity is stressed or compressed by generated intensity transformation function. The decomposed intensity layers are also processed by canny edge detection method as all the satellite images contains the noise due to atmospheric turbulence and this is Gaussian by nature. Canny edge detector is the best method for detecting edges of image in the presence of Gaussian noise. Finally the contrast enhanced images are fused according to the weight map determined by edge map of image.
General Terms
Image Contrast Enhancement
Keywords
Digital Image Processing, Canny Edge Detection, Kernel Filtering, Image Fusion, Weighting Map Determination, DWT, Contrast Enhancement
1.
INTRODUCTION
In digital image processing, image enhancement algorithms are used to improve the quality of input image by which the output image looks better than the original image. For image enhancement purpose one or more attributes of image are enhanced. Basically there are two image enhancement domains, which are is spatial domain and transform domain. In all spatial domain techniques [1] we directly deal with image’s pixel, it means in spatial domain the intensity values of image pixels are manipulated, on the other hand in transform domain [2] all enhancement operations are performed on transform domain coefficients of the image & then the inverse transform is performed to get Resultant enhanced image.
The basic concept of spatial domain [1] is to directly manipulate the values of image pixels so that desired output could be achieved. In mathematical form, in spatial domain the value of pixel intensity are manipulated directly as equation given below,
G(x, y) =T [f(x, y)] (1)
In frequency domain methods [2], for Image enhancement image is first transferred in to frequency domain by using Fourier Transform. Further enhancement operations are now performed on the Fourier transform of the image then the Inverse Fourier transform is performed to get the resultant image. The transform operations in image are performed in order to modify the image attributes like image brightness, contrast or distribution of the grey levels etc. It means that the pixel value of the output image will be modified according to the transformation function applied on the input. In the frequency domain the image enhancement can be done as following equation,
G (u, v) = H (u. v) F (u, v) (2)
Where G (u, v) is enhanced image, F (u, v) is input image and H (u, v) is transfer function.
Image enhancement simply means, transforming an input image “f” into output image “g’ using transformation function “T”. The values of pixels in images “f” and “g” could be denoted by “R” and “S”, respectively. These are related by the expression,
Output pixel value (S) = T(R) (3)
Here the transformation function is T and according to this we will map a pixel value R into a pixel value S. The resultant transformation is mapped into the grey scale range as we are dealing here only with grey scale digital images. I will consider only gray level images. Digital gray image can have pixel values in the range of 0 to 255.
Images Based on Histogram Equalization [12],Content-Aware Dark Image Enhancement through Channel Division [13],Contrast Enhancement using Dominant Brightness Level Analysis and Adaptive Intensity Transformation for Remote Sensing Images(DBAIT) [14] .These techniques enhances the contrast of image up to some extent but any one of them does not preserve brightness, does not sharpens image, does not remove blurriness of the image. These methods contain more AMBE (absolute mean brightness error) rate, less PSNR (peak signal to noise ratio) and less EME (Enhancement measure evaluations). Now we proposed a new technique for image enhancement that is titled “Efficient Contrast
Enhancement using Kernel Padding and DWT with Image Fusion” (KPFDWT) which Enhances contrast with brightness preservation having less error rate (AMBE), more PSNR and more EME. Basically this is fusion technique where fusion of different intensity layers of image is done on the basis of weighting map which is evaluated by kernel filtering concept incorporated by canny edge detection method.
The organization of this paper is as follows. Section I is Introduction and we have gone through it, Section II is Literature review in which we will study some of previously proposed techniques for image contrast enhancement, Section III presents proposed algorithm , Section IV presents results discussion & performance evaluation of proposed algorithm with some of previously proposed algorithms, and finally, Section V provides some concluding remarks.
2.
LITRATURE REVIEW
This section describes some previous works in the literature which is used for the purpose of image enhancement i.e. improving the quality of Image in respect of visual perception by modifying the different attributes of Image.
As we know HE has Good enhancement of contrast cdf distribution but it Creates artefacts, degraded sharpness, washed-out effects in reconstructed Image.
According to Kim [3], one drawback of the histogram equalization can be found on the fact that the brightness of an image can be altered after the histogram equalization, just because of to the flattening property of the histogram equalization. Therefore, it is rarely utilized in consumable electronic products such as TV where preserving original input brightness may necessary in order not to introduce unnecessary visual deterioration.
Kim Proposes [5] “Contrast enhancement using brightness preserving bi-histogram equalization” Basically this technique is abbreviated as BBHE technique. Attribute of image as Contrast Enhancement by BBHE is achieved by dividing the image histogram in two sub-histograms on the basis of its mean value. The BBHE firstly decomposes an input image into two sub-images based on the mean of the input image. Then the BBHE equalizes the sub-images independently based on their respective histograms with the constraint that the samples in the formal set are mapped into the range from the minimum gray level to the input mean and the samples in the latter set are mapped into the range from the mean to the maximum gray level. Thus, the resulting equalized sub-images are bounded by each other around the input mean, and input mean has an effect of preserving mean brightness but generated image might not have a natural appearance.
In the [6] “Dualistic sub-image histogram equalization”
was proposed by Wan et. Al. The Dualistic technique is
abbreviated as DSIHE in which the histogram of input image is divided on the basis of median value of image histogram and rest of process is same as BBHE operates. But the criterion for separation of histograms is median value.
Chen and Ramli [7] propose “Minimum Mean Brightness
Error Bi-Histogram Equalization” (MMBEBHE). In put image histogram division used here also.A threshold level which is equivalent to minimized difference between the input mean and output mean is used to divide the input image histogram. In case of preserving the brightness of original image this method is better than BBHE and DSIHE but use of input mean as the threshold level to separate the histogram limit its performance.
Wan et. Al in [8] also proposed another technique namely (RMSHE) “Recursive Mean Separate Histogram Equalization”, in 2003.Basically this was an extension of DISHE. In Recursive Mean Separate Histogram Equalization based on local mean values of input image, histogram is portioned in recursively in and number of sub histograms (2r)
is given by user
Menott et. al. [9] proposes “Multi-histogram equalization” (MMLSEMHE) methods to overcome from the drawbacks of BBHE and other techniques. According to them, though bi-HE methods preserve the brightness of the original image but, the output image may not look as natural as the original image. They proposed a technique which on one hand preserves the brightness of the input image and on the other hand generated images with natural appearances.
Demirel et. al. [10] proposed “Satellite Image Contrast
Enhancement Using Discrete Wavelet Transform and Singular Value Decomposition” a new method for enhancement of satellite images contrast. Their method was based on Discrete Wavelet Transform (DWT) and singular-value decomposition. They first applied DWT to input image to divide it into four frequency sub-bands, then used singular value decomposition and then again applied inverse DWT to reconstruct the image. Their technique showed better results than conventional Brightness preserving Dynamic Histogram Equalization (BPDHE) method and other methods.
P. Rajavel [11] proposed algorithm called “Image Dependent Brightness Preservation Histogram Equalization”
(IDBPHE) for brightness preservation. In this technique the bright regions of images are identified using Curve let Transform and then histogram of original image is modified with respect to the histogram of the identified regions. The corresponding steps of IDBPHE methods are given below.
• Bright Region identification and separation: The curve let transform is used to identify bright regions of an original image.
• Histogram computation and matching: in this Histogram of the original image is taken and also the histogram of pixels is taken which belong to the identified regions. & then we will modify the histogram of the original image with according to histogram of the identified regions.
Due to use of wrapping curve let transform for Region identification preserve high degree of brightness but it is Unable to recover information from the shadowed or dark areas of images that had near-black intensities.
multiple-peak. In this process at first, the input image is convolved by a Gaussian filter T first. Then secondly, the original histogram can be divided into different areas by the valley values of the image histogram. After this finally we use the multiple peak technique to processes images. Multiple peak method has excellent degree of simplicity and adaptability in comparison of others methods. Use of Gaussian filter reduce the noise interference & blocking effect but Use of peak & valley point of histogram to separate image into sub images limits its performance for image in which peak & valleys are nearby.
Adin Ramirez Riveraet. al. [13] proposes “Content-Aware
Dark Image Enhancement through Channel Division”. Images having dominantly dark regions can be enhanced by this method. This algorithm produces an ad hoc transformation for each image. In this technique they specially analyzed the contrast of the image in the boundary and textured regions, and then grouping of the information done with common characteristics. Then these groups were used to model the relations within the image, from these groups the transformation functions were extracted. The results of the above whole process were mixed adaptively by considering the human vision system characteristics, this boost the details in the image. This algorithm Enhance the appearance of human faces, blue skies without introducing artifacts but it is unable to recover information from the shadowed or dark areas of images that had near-black intensities.
In [14] Eunsung lee proposes “Contrast Enhancement using Dominant Brightness Level Analysis and Adaptive Intensity Transformation for Remote Sensing Images” (DBAIT) especially for Images taken from satellite. This method uses dominant brightness level of Image for decomposing the Image in different three layers and then these layers are used for calculation of adaptive intensity transfer function. This estimated adaptive intensity transfer function is used for image contrast enhancement then these layers are fused to get enhanced image. This method gives the better result in comparison of all above mentioned techniques.
3.
PPROPOSED METHOD
In digital image processing various techniques have proposed to enhance the quality of image such as histogram Equalization, multi-histogram equalization, pixel dependent contrast preserving and many other. Now we proposed an
“Efficient Contrast Enhancement using Kernel Padding and DWT with Image Fusion” that provides a better result for contrast enhancement with brightness preservation.
The proposed algorithm broadly categorized in six sections which are DWT, Image Decomposition, Contrast Enhancement section, Kernel Filtering, Image Fusion and IDWT sections.
3.1
DWT
DWT is used to separate the input low contrast image into different frequency sub bands, where the LL sub band concentrates the illumination information. That is why only the LL sub band goes through the proposed process, which preserves the high-frequency components (i.e., edges). Hence, after inverse DWT (IDWT), the resultant image will be sharper with good contrast. The illumination information is embedded in the LL sub band. As in other sub bands contains the edge information of image and other unwanted details. The other sub bands are LH, HL, and HH. Hence, separating the high-frequency sub bands and applying the contrast
enhancement in the LL sub band only will protect the edge information from possible degradation.
3.2
Image Decomposition
In this section the luminance of LL sub band of Image is computed and on the basis of these values LL sub band Image is decomposed in to low, middle & high intensity layers. As we know that the high intensity values are dominant in bright region and vice versa. The dominant brightness of any Image varies in the range between 0 to 1, so here we will fix a particular value range for low, middle and high intensity layer and then we will decompose the LL sub band Image on the basis of these values.
3.3
Contrast Enhancement
In this section the Intensity transfer function is generated on the basis of each decomposed layer. As Image could have non uniform and varying intensity distribution so we have to generate effective transfer function which could effectively work on all three brightness regions for effective and proper contrast enhancement. The intensity transfer function is generated by combining the knee transfer function and modified gamma adjustment function. The knee transfer function is used first and it stretches the low intensity range by calculating knee point on the basis of brightness level of each layer.
Knee point for low intensity layer is Pl, Bl is low bound, Wl is
tuning parameter & Ml is mean brightness of low intensity
layer then,
Pl = Bl + Wl (Bl -Ml) (4) Knee point for high intensity layer is Ph, Bh is low bound, Wh
is tuning parameter & Mh is mean brightness of low intensity
layer then,
Ph=Bh + Wh (Bh - Mh) (5) For middle intensity layer two knee points will be,
Pml=Bl-Wm (Bml-Mm) + (Pl-Ph) (6)
Pmh=Bh-Wm (Bmh-Mm) + (Pl-Ph) (7) Knee transfer function work well for in middle intensity layer and distort image details in lower and higher intensity layers, therefore gamma adjustment function is used for these regions .The gamma adjustment function is modified from its original form to incorporate the knee transfer function.
(8)
Here k=l,m,h and M stand for each section intensity range, Ml=Bl,Mm=Bh-Bl,Mh=1-Bh& L is the intensity value.
By this gamma adjustment function distortion in low & high intensity range created by knee operator is corrected.
After generating intensity transfer function the intensity of three layers are modified by applying generated intensity transfer function to enhance the contrast of three layers.
3.4
Kernel Filtering & Zero Padding
In this section the three layer images (low, middle & high intensity layer) are first processed by canny edge detection technique because all the satellite & remote sensing images contains the noise due to atmospheric turbulence and this is Gaussian in nature. Canny edge detector is the best method for detecting edges of image in the presence of Gaussian noise. After this weights are calculated for each layers of image pixel by pixel. Aim of this section is to calculate the weighting map for the fusion purpose because in our method the fusion of different intensity layers images will be guided by this weighting map. This weighting map is determined by image edge map therefore our fusion method is called edge guided fusion method.
In canny edge detection section our main goal is to find the image edge map at the output of this section. The algorithm runs in many steps and in each step separate pre specified Kernel is used for filtering the image to obtain different effect at the output of that step. For filtering convolution operations performed with pre specified kernel. In this operation output pixel is calculated as weighted average of input pixel and kernel matrix. For calculation output pixel at the boundary of an image we use padding of zeros because for these pixels of input image a portion of kernel matrix is off the edge of the image.
Steps for canny edge detection is as follows,
1. Smoothing the Image by filtering the Image with Gaussian Kernel to remove noise.
2. Next is to Find the gradients, in this the edges are marked where the gradients of the image has large magnitudes. This is achieved by filtering the smoothened image by two different kernel for x & y direction.
3. Non-maximum suppression is the third step, in this step only local maxima should be marked as edges. Basically the purpose of this step is to deblurre the image by sharpening the blurred edges obtained in previous step.
4. Then we will do double thresholding for determining the potential edges of image and edges due to noise are removed.
5. The last step of canny edge detection is Edge tracking by hysteresis, in these final edges is determined by suppressing all edges that are not connected to strong edges.
In kernel filtering section after canny edge detection next section is weighting map calculation section. By canny edge detection section we will get edge image or edge map for all three intensity layer images. Steps for weighting map calculation section is as follows,
1. Assign weight to each pixel based on strength of edges or sharpness value of pixel for generating weighting map. Weight is calculated by formula,
(9) Where W(x, y) is weight for the pixel at (x, y) and S(x, y) is the strength of Edges also called sharpness Measure of pixel present at (x,y) location in the Image.
2. Repeat step 1 for pixel by pixel first pixel of first row to last element of last row for all three intensity layer images. By this we will get three weighting maps W1, W2, W3, one for each i.e. for low, middle & high intensity layers.
3. Next step is to select two largest weighting maps & give it to fusion section, suppose here W1 & W2 are largest and second largest weighting map.
3.5
Image Fusion
According to fundamental principle of Image fusion, one particular enhancement method improves some regions and actually deteriorates the other regions .So fusion concept is used to fuse different section of images obtained by different
enhancement methods and the resultant fused image will be highly enhanced image .We are here proposing edge guided image fusion in which image edge are detected by different kernels (Canny edge detection) approach.
In this section the low, middle & high intensity contrast enhanced images from intensity transformation section are fused pixel by pixel on the basis of weighting map calculated by Kernel filtering section.
For each pixel (x, y) we have,
1. Three contrast enhanced images having brightness measure
Il(x, y), Im(x, y) and Ih(x, y) for low, middle & high intensity contrast enhanced layers respectively obtained from contrast enhancement section.
2. Two largest weighting map W1(x, y) & W2(x, y) out of three weighting maps W1(x, y), W2(x, y) and W3(x, y) from kernel filtering & weighting map section is used to guide the fusion process pixel by pixel.
3. Fusion at pixel (x,y) will be performed according to following expression,
(10)
4. Repeat steps 2 and 3 for all pixels present in image, ideally start from first pixel of first row to end last pixel of last row.
5. From step 4 we will get a fusion image of LL sub band of original image.
3.6
IDWT
Here the Fusion Image obtained by LL sub band and LH, HL and HH sub band Images of original Image are recombined by applying IDWT to generate resultant Contrast Enhanced Image. After reconstruction using IDWT, the resultant image will not only be contrast enhanced, but also be blurriness free, having less noise and more sharper.
The outline of proposed method is as follows,
Take a low Contrast Image 1. Apply DWT transformation on the input image.
2. LL sub band of DWT out is taken & brightness level of the LL band is analyzed for image decomposition purpose.
3. Image Decomposition of LL sub band of the image on the basis of brightness level in low, middle & high intensity layers.
4-These low, middle & high intensity layer Image is taken as input by two different sections which are as follows.
Low, Middle & High intensity layers are given to contrast enhancement section where intensity transfer function generated first and then apply generated transfer function on LL sub band of image for contrast enhancement of each intensity layer.
Low, Middle & High intensity layers are also given to kernel filtering section where Edge map by canny edge detection is created for guiding image fusion process in next step.
5- The output of canny edge detection section is given to the weighting map determination section where weighting map for all three intensity layer s are calculated on the basis of image edge strength.
6- Now the output of weighting map determination section is given to weighting map selection section where two largest weighting map out of three is selected to guide image fusion process.
given to Image fusion section where all the images are fused according to the sharpness evaluation of each pixel neighborhood which is determined by kernel filtering operation.
Take a low Contrast input Image
8- The inverse DWT (IDWT) is then applied on the fusion image obtained by different section processing of LL sub band and HH, HL, LH bands to get the contrasted Enhanced image. This image has high PSNR, low AMBE and high EME get contrast Enhanced output Image
DWT
Weight calculation by
Intensity transfer function estimation for
middle intensity layer Image
Contrast Enhancement Contrast
Enhancemen t
Canny
Edge
Detection
Kernel filtering with zero padding
Brightness level based Image decomposition of LL band in
low, middle & high intensity layers
Contrast Enhancement
Intensity transfer function estimation for high intensity layer Image Intensity transfer
function estimation for low intensity layer
Image
IDWT
Image Fusion
For each pixel (x, y) Fuse Image according to formula [image:5.595.54.541.89.728.2]
4.
RESULT DISCUSSION &
PERFORMANCE EVALUATION
For evaluating the performance of the proposed algorithm, we tested low-contrast image taken from satellite. The performance of the proposed algorithm is compared with existing well-known algorithms including standard HE, MHE, IDBPHE and DBAIT. The proposed method is evaluated using the Peak Signal to Noise Ratio (PSNR), Absolute Mean Brightness Error (AMBE and Measure of Enhancement (EME).
1-Peak signal to noise ratio (PSNR) is used to assess the degree of contrast enhancement, high value of PSNR is better. PSNR is the quality measurement between the original image and the reconstructed image which is calculated through the Mean Squared Error (MSE).
The MSE represents the cumulative squared error between the compressed and the original image, while term PSNR represents a measure of the peak error. PSNR is calculated by,
PSNR=20 log ( ) (11)
2-Absolute mean brightness error (AMBE) is used to Assess the degree of brightness preservation. Smaller AMBE is better. AMBE is determined by,
AMBE=(X, Y) =Mx – My (12)
Where the Mx is mean of input and My is the mean of output image.
3-The EME represents the overall image quality enhanced with preserving the average brightness level and edge details in all intensity ranges.
(13)
Where k1k2 represent total number of blocks in an image, (k,l) represent maximum value of the block, (k,l)represent minimum value of the block, and c
represent a small constant to avoid dividing by zero error.
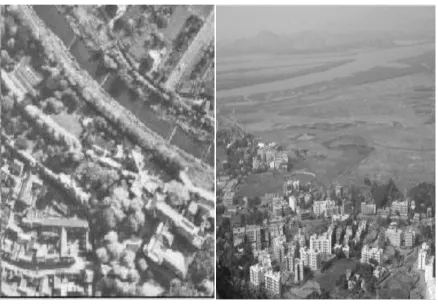
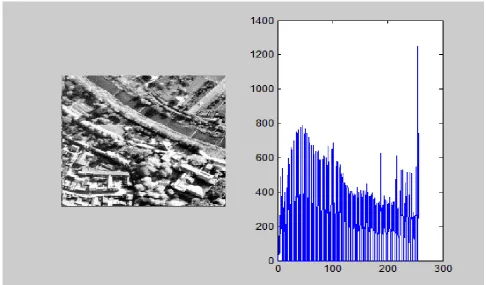
[image:6.595.81.520.355.662.2]Image1 Image2
Figure 3-Original Image1 with its histogram
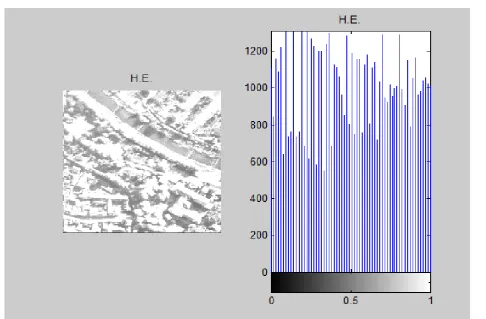
[image:7.595.45.532.403.722.2]Figure 5- Enhanced Image1 by MHE with respective histogram
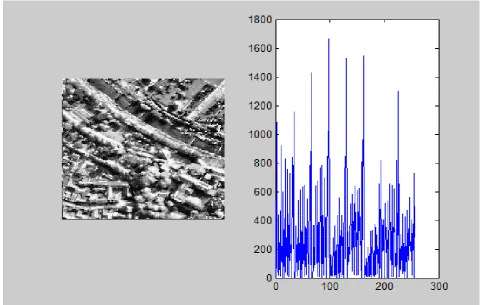
[image:8.595.56.540.426.731.2]Figure 7- Enhanced Image1 by DBAIT with respective histogram
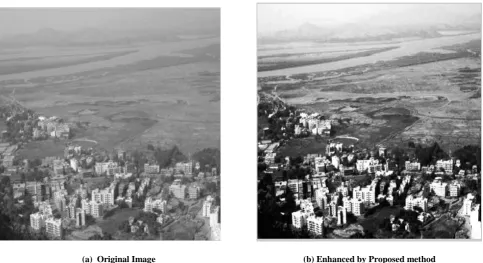
[image:9.595.55.542.434.719.2]A closer look of original image-1 and image enhanced by proposed method for comparison purpose of both methods performance
[image:10.595.312.543.136.348.2](a) Original Image (b)Enhanced by Proposed method
Figure 9- A closer look of Original image (a) & Enhanced Image by Proposed method (b)
A closer look of original image-2 and image enhanced by proposed method for comparison purpose of both methods performance
[image:10.595.60.544.483.746.2](a) Original Image (b) Enhanced by Proposed method
For pages other than the first page, start at the top of the page, and continue in double-column format. The two columns on the last page should be as close to equal length as possible.
Table 1. Table captions should be placed above the table Graphics Top In-between Bottom
Tables End Last First
Figures Good Similar Very well
4.1
Page Numbering, Headers and Footers
Do not include headers, footers or page numbers in your submission. These will be added when the publications are assembled.
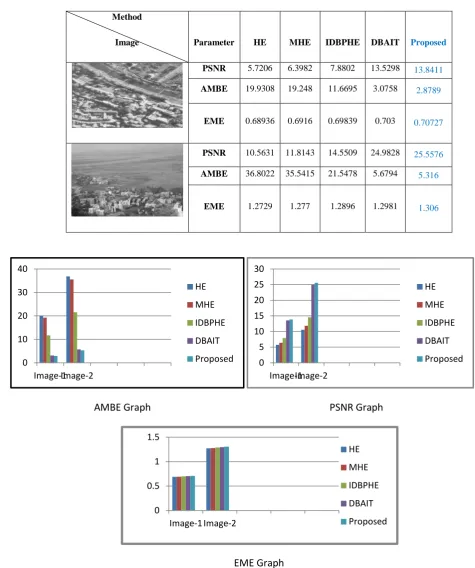
The proposed method for contrast enhancement has applied on several images; and in above pages we have displayed the result of two images and now we are comparing the result of proposed method with other image enhancement methods such as HE, MHE, IDBPHE & DBAIT methods. The result is shown below in Table-1,
Table-1.Comparison of results between Proposed Method and other Existing Techniques
Method
Image Parameter HE MHE IDBPHE DBAIT Proposed
PSNR 5.7206 6.3982 7.8802 13.5298 13.8411
AMBE 19.9308 19.248 11.6695 3.0758 2.8789
EME 0.68936 0.6916 0.69839 0.703 0.70727
PSNR 10.5631 11.8143 14.5509 24.9828 25.5576
AMBE 36.8022 35.5415 21.5478 5.6794 5.316
EME 1.2729 1.277 1.2896 1.2981 1.306
AMBE Graph PSNR Graph
EME Graph
0 10 20 30 40
Image-1 Image-2
HE
MHE
IDBPHE
DBAIT
Proposed 0
5 10 15 20 25 30
Image-1 Image-2
HE
MHE
IDBPHE
DBAIT
Proposed
0 0.5 1 1.5
Image-1 Image-2
HE
MHE
IDBPHE
DBAIT
5.
CONCLUSION & FUTURE SCOPE
Conclusion of above discussion is that classical methods of Contrast enhancement losses some of the detail information of the images during enhancement process, As per above discussion Histogram Equalization gives better results but not the best as it cannot preserve the brightness of the original image. Some other algorithms like MHE, BBHE, MMBEBHE, IDBPHE, Multiple-Peak Images Based on Histogram Equalization, content aware algorithms and DBAIT were proposed for contrast enhancement with brightness preservation of original image and to give great PSNR, low AMBE and high enhancement factor EME value. Up to some extent these algorithms gives good result by achieving their goal. But we know that there is no any particular reference point of existing parameters which could be taken as reference for declaring any image quality as good or bad. If the output image of any algorithm look good for our eye then the algorithm said good otherwise it is not up to mark. In this paper, we have presented contrast enhancement method for low contrast varying intensity distribution Images and this technique use kernel padding and DWT with image fusion concept for contrast enhancement of image. The basic enhancement occurs due use of edge guided image fusion concept. Performance of this technique has been compared with existing contrast enhancement techniques like Histogram Equalization, Multi Histogram Equalization(MHE),Image Dependent Brightness Preserving Histogram Equalization(IDBBPHE) & Dominant Brightness level & Adaptive Intensity Transformation Technique((DBAIT) based techniques. The experimental results show that the our proposed technique gives better performance in terms of contrast (EME), brightness (AMBE) & Signal to noise ratio (PSNR) of the enhanced image as compared to the other existing techniques and also increase the image sharpness & avoids over enhancement. Thus, this technique can be considered suitable for enhancement of low contrast image without changing original image quality & details of images. In our work as we have considered the EME, PSNR & AMBE for performance evaluation. There is more scope for work in the area of power consumption and execution time of algorithm in future. Main challenge in the future will be to decrease the execution time of algorithm to give the result for image having huge amount of data.
6. REFERENCE
[1] Bhabatosh Chanda and Dwijest Dutta Majumder, Digital Image Processing and Analysis 2002.
[2] Raman Maini and Himanshu Aggarwal “A Comprehensive Review of Image Enhancement Techniques “Journal of Computing, Volume 2, Issue 3, March 2010.
[3] A. Rafael C. Gonzalez, and Richard E. Woods, “Digital Image Processing,” 2nd edition, Prentice Hall, 2002.
[4] Joung-Youn Kim, Lee-Sup Kim and Seung-Ho Hwang, “An advanced contrast enhancement using partially overlapped sub-block histogram equalization,” IEEE Trans. Circuits Syst. Video Technol., Vol. 11, pp.475-484, April 2001.
[5] Y.-T. Kim, “Contrast enhancement using brightness preserving bi-histogram equalization,” IEEE Trans. on Consumer Electronics, Vol. 43, pp.1-8, February 1997.
[6] Y. Wang, Q. Chen, and B. Zhang, “Image enhancement based on equal area dualistic sub-image histogram equalization method,” IEEE Trans. on Consumer Electronics, Vol. 45, pp.68-75, February 1999.
[7] S.-D. Chen and A. Ramli, “Minimum mean brightness error bi-histogram equalization in contrast enhancement,” IEEE Trans. on Consumer Electronics, Vol. 49, pp.1310-1319, November 2003.
[8] Soong-Der Chen and Abd. Rahman Ramli, “Contrast enhancement using recursive mean-separate histogram equalization for scalable brightness preservation, IEEE transactions on Consumer Electronics, Vol.49, pp.1301-1309, November 2003.
[9] David Menotti, Laurent Najman, Jacques Facon, and Arnaldo de A. Araújo” Multi-Histogram Equalization Methods for Contrast Enhancement and Brightness Preserving” IEEE Transactions on Consumer Electronics, Vol. 53, pp.1186-1194, August 2007.
[10] Hasan Demirel, Cagri Ozcinar, and Gholamreza Anbarjafari,” Satellite Image Contrast Enhancement Using Discrete Wavelet Transform and Singular Value Decomposition”, IEEE Geoscience and Remote Sensing Letters, vol. 7, no. 2, pp. 333-337, April 2010.
[11] P. Rajavel “Image Dependent Brightness Preserving Histogram Equalization” IEEE Transactions on Consumer Electronics, Vol. 56, pp.756-763, May 2010.
[12] Fan Yang, Jin Wu “An Improved Image Contrast Enhancement in Multiple-Peak Images Based on Histogram Equalization” IEEE International Conference on Computer Design and Applications, Vol.1, pp.346-349, 2010.
[13] Adin Ramirez Rivera, Byungyong Ryu, and Oksam Chae “Content Aware Dark Image Enhancement through Channel Divison”IEEE Transactions on Image Processing,volume 21,issue 9, 2012.
[14] Eunsung Lee, S.Kim, W.Kang, D.Seo and Jooki Paik “Contrast Enhancement using Domonant Brightness Level and Adaptive Intensity Transrormation for Remote Sensing Image”IEEE Geoscience and Remote sensing letters, Vol. 10, no.1, January 2013.
[15] X. Fang, J. Liu, W. Gu, Y. Tang ,“ A Method to Improve the Image Enhancement Result based on Image Fusion,” 978-1-61284-774-0/11 ©2011 IEEE.
[16] Leslie N. Smith “Estimating an Images Blur Kernel from Edge Intensity Profiles” Naval Research Laboratory, Washington, DC 20375-5320.