Estimation of Confidence Level ‘h’ in Fuzzy Linear
Regression Analysis using Shape Preserving Operations
B. Pushpa
Department of Mathematics Panimalar Institute of Technology Poonamallee, Chennai – 600 123, India
R. Vasuki
Department of Mathematics SIVET College, Gowrivakkam
Chennai – 600 073. India
ABSTRACT
The aim of this discussion is to introduce a new fuzzy regression model, based on the distance between the outputs of the model in terms of its measurements along with the optimal confidence level ‘h’ using the shape preserving operations. Simple fuzzy regression models with fuzzy input- fuzzy outputs are also considered in which the coefficients of the models are themselves triangular fuzzy numbers. In the proposed method, the arithmetic operations are based on Tw norm, which preserves the shape during multiplication of two fuzzy numbers and it also satisfies the scale independent property. The numerical examples indicate that the proposed method has effective performance, especially when the data set includes some outliers.
General Terms
Fuzzy regression models, Shape preserving operations.
Keywords
Fuzzy linear regression, Tw norm based arithmetic operations, Fuzzy input and fuzzy output.
1.
INTRODUCTION
Regression analysis has a wide spread applications in various fields such as business, engineering and economics to explore the statistical relationship between input (independent or explanatory) and output (dependent or response) variable. In the year 1970, Bellman and Zadeh [1] proposed the concept of fuzzy set theory. Since then several authors have constructed different fuzzy regression models and proposed the associated solution methods. The first approach, which is called the possibilistic regression, was introduced by Tanaka et al. [2]. They considered the regression problem with fuzzy dependent variable and crisp independent variable which was formulated as a mathematical programming problem. In their study, a regression problem with fuzzy dependent variable and crisp independent variable was formulated as a mathematical programming problem. The objective of Tanaka’s method was to minimize the total spread of the fuzzy regression coefficients subject to the constraint that the regression model needed to satisfy a pre-specified membership value in estimating the fuzzy responses. The main drawback of Tanaka’s approach is the scale dependent. Although this approach was later improved by Tanaka [3], Tanaka and Watada [4] and Tanaka et al. [5] and still suffered the problem of being extremely sensitive to outliers as pointed out by Redden and Woodall [6].
The main purpose of fuzzy regression models is to find the best model with the least error. Based on this, the methods are classified as follows:
(1) Possibilistic approach, which tries to minimize the fuzziness of the model by minimizing the total spread of its fuzzy coefficients, subject to include the data points of each sample within a specified feasible data interval. (2) Least square approach, which minimizes the total spread
of errors in the estimated value, based on their specification. This approach is an extension of ordinary least squares which obtains the best fitting to the data, based on the distance measure under fuzzy consideration. Fuzzy linear regression by fuzzy least square approach is proposed by Celmins [7] and Diamond [8]. Some recent works on this topic are as follows: Hong et al. [9] studied the fuzzy least squares regression modeling by using shape preserving operations. Mohammadi and Taheri [10] explained the application of least square method in soil sciences when the data for the response variable are fuzzy numbers. Coppi et al. [11] studied the dependence of an LR fuzzy response variable on a set of crisp explanatory variables. Using a generalization of the Diamond’s metric, Arabpour and Tata [12] investigated a fuzzy least squares regression method. Kim et al. [13] investigated some asymptotic properties of least square estimators for fuzzy regression models. Lu and Wang [14] proposed an enhanced fuzzy regression model, in which the spreads of the estimated dependent variables fit the spreads of the observed dependent variable.
The objective of this study is to minimize distance between the outputs of the model and the measurements. The proposed objective function estimates an optimal confidence level namely ‘h’ too. In this paper, section II focuses on some important preliminaries on fuzzy arithmetic operations based on the weakest T-norm. In section III, the new approach is presented and in section IV, the proposed method is analyzed with different data types. Comparison between the proposed approach and existing approaches are made to assess the performance of the proposed method.
2.
T
WBASED
ALGEBRAIC
OPERATIONS OF FUZZY NUMBERS
A fuzzy number is a convex subset of the real line with a normalized membership function. A triangular fuzzy number
a(a, , ) is defined by a t
1 , if a t a
a t
a(t) 1 ,if a t a
0 , otherwise
where a is the center, 0 is the left spread and 0 is the right spread of a. If , then the triangular fuzzy number is called a symmetric triangular fuzzy number and it is denoted by (a, ) . A fuzzy number a(a, , ) LR of types L-R is a function from real number into the interval (0, 1) satisfying
t a
R , a t a
a t
a(t) L ,a t a
0 , otherwise
where L and R are non increasing and continuous functions from (0,1) to (0,1) satisfying L(0)=R(0)=1 and L(1)=R(1)=0. A binary operation T on the unit interval is said to be a triangular norm [22] (t-norm) if T is associative, commutative, non-decreasing and T(x,1)=x for each x[0,1] . Moreover, every t-norm satisfies the inequality,
w M
T (a,b)T(x, y)T (a,b)min(a,b) , where
w
a ,if b 1 T (a, b) b ,if a 1
0 ,otherwise
The critical importance of
w
min(a,b), a b, max(0,a b 1) and T (a,b)
is emphasized from a mathematical point of view in Ling [22], among others. The usual arithmetic operations on real numbers can be extended to the arithmetic operations on fuzzy numbers by means of extension principle by Zadeh [23], which is based on a triangular norm T. Let
A
andB
be fuzzy numbers ofthe real line . The fuzzy number arithmetic operations are summarized as follows:
Fuzzy number addition :
x,y,x y z
A
B (z)
sup
T A(x), B(y) .
Fuzzy number multiplication :
x,y,x.y z
A
B (z)
sup
T A(x), B(y) .
The addition and subtraction rule for L-R fuzzy number is well known in case of TM based addition, in which the resulting sum is again an L-R fuzzy number, i.e., the shape is preserved. LetA(a, A, A LR) , B(b, B, B LR) . Then using TM in the above definition,
M A B A B LR
A B(a b, , )
It is also known that the T based addition and w multiplication preserves the shape of L-R fuzzy numbers [24, 25, 26, 27]. It is known that TM based multiplication does not preserve the shape of L-R fuzzy numbers. In this section, we consider T based multiplication of L-R fuzzy numbers. w LetTTw be the weakest t-norm and let
A A LR
A(a, , ) , B(b, B, B LR) be two L-R fuzzy numbers, from D.H. Hong [28].
W A B A B LR
A B (a b,max( , ),max( , ))
A B A B LR
A B A B RL
W A B A B LL
A A LR
A A RL
LR
(ab, max( b, a), max( b, a)) , for a, b 0 (ab, max( b , a ), max( b , a )) ,
for a, b 0 A B (ab, max( b, a ), max( b, a )) ,
for a 0, b 0 0, b, b , for a 0, b 0 0, b, b , for a 0, b 0 (0,0,0) , for a 0, b 0
In particular, if A( ,aA),B( ,bB)are symmetric fuzzy numbers, then the multiplication of A and B is written as, A wB(ab, max(Ab ,Ba ))LL
3.
FUZZY
LINEAR
REGRESSION
USING THE PROPOSED APPROACH
In this section, the proposed approach based on the absolute distance between spreads and centers of the observed and estimated values of the outputs to the fuzzy linear regression models using Tw norm is discussed here, with crisp/fuzzy input- fuzzy output data, in which the coefficients of the models are also considered as fuzzy numbers.
Consider the set of observed data
(X , Y ),i 1,..., ni i
where Xi(x ,i i)and Yi(y ,e )i i are symmetric fuzzy numbers. Our aim is to fit a fuzzy regression model with fuzzy coefficients to the aforementioned data set as follows:i 0 w 1 w i1 w w p w ip w i
ˆ
Y A (A X ) ... (A X ) A X
, i1,....n
whereAj
a ,jj
, j 1,...p are symmetric fuzzy numbers and the arithmetic operations are based on the weakest Tw norm.It is known that the overlap of the given outputs Yi and the estimated fuzzy number Yi is not empty (conjuncture ˆ problem). Based on this concept, an objective function is proposed, which minimizes the inequality of the given outputs Yi and the estimated fuzzy number Yi in order to maximize the possibility of equality of those fuzzy numbers. Therefore the objective function minimizes the sum of the absolute difference between upper limits and lower limits of the observed and estimated values of the outputs with arithmetic operations using Tw norm,
n
T 1 1
a xi L (h) max aj ij, xij j yi L (h)ei m 11 j p
min
n
i 1 T 1 1
a xi L (h) max aj ij, xij j yi L (h)ei 1 j p
1
(2) In this approach, h is included in the objective function to estimate its value optimally with high accuracy. To obtain the constraints, the possibility of the equality of observed and estimated outputs is with atleast ‘h’ degree of belongingness. Here we use the reference functionL (x)1 1 x, for triangular fuzzy number [29],
T i i
i i T
i i T i i T i i T i i T i i T i i T i i
T T T
i i i i i i
a x y ˆ
Poss(Y Y ) L h
x e a x y
1 h
x e a x y 1 h
x e a x y
(1 h) (1 h)
x e
(1 h) x e a x y (1 h) x e
(3) Then the optimization problem is summarized as follows:
n
T 1 1
a xi L (h) max aj ij, xij j yi L (h)ei
m 1 j p
1 min
n
i 1 T 1 1
a xi L (h) max aj ij, xij j yi L (h)ei 1 j p
1
subject to
n n 1 1a xj ij L (h) max aj ij, xij j yi L (h)ei 1 j p
j 0 1
n n
1 1
a xj ij L (h) max aj ij, xij j yi L (h)ei 1 j p
j 0 1
0 h 1,
max aj ij, xij j 0, i 1, 2,...m 1 j p
(4) Solving this optimization problem using LINGO, the fuzzy coefficients of the model are estimated.When outliers exist in the dataset, Chen’s [30] approach of modifying the outlier data is applied for crisp/ fuzzy input and fuzzy output data. The modified proposed optimization problem to estimate the fuzzy coefficients using Chen’s approach of modifying the outlier data is explained below: For detecting outliers, the width between the spread of estimated value and dependent value must be below a certain specified value ‘k’. If this difference is larger than ‘k’, the problem has no feasible solution and the equation must be added to the constraints max
aj ij, xij j
ei k,1 j p
the
optimization problem becomes,
n
T 1 1
a xi L (h) max aj ij, xij j yi L (h)ei
m 1 j p
1 min
n
i 1 T 1 1
a xi L (h) max aj ij, xij j yi L (h)ei 1 j p
1
subject to
n n 1 1a xj ij L (h) max aj ij, xij j yi L (h)(1 )ei 1 j p
j 0 1
n n
1 1
a xj ij L (h) max aj ij, xij j yi L (h)(1 )ei 1 j p
j 0 1
0 h 1,
max aj ij, xij j ei k, i 1, 2,...m 1 j p
(5) The difference between estimated spread and the observed spread is below a certain specified value ‘k ‘, Where
i M
j Mi i 1 j j 1 i j
k max e max e
can be used.
i.e. max
aj ij, xij j
ei k 1 j p
If this difference is greater than ‘k’ the problem has no feasible solution. Generally a normal e value should be i eitherei 1 ei ei 1 or ei 1 ei ei 1 , Therefore to modify
the outlier data, the corresponding constraints are modified as,
n n
1 1
a xj ij L (h) max aj ij, xij j yi L (h)(1 )ei 1 j p
j 0 1
n n
1 1
a xj ij L (h) max aj ij, xij j yi L (h)(1 )ei 1 j p
j 0 1
The value of 1 ei r .... ei 2 ei 1 ei 1 ei 2 ...ei r 2rei
where
r
value is reasonably large.4.
EXAMPLE
output data is used in example 3 to assess the performance of the proposed method in the case of large sample size. For the above examples, the sensitivity of the proposed approach with respect to outlier data points is studied with Chen’s [30] outlier treatment.
To investigate the performance of the fuzzy regression models, we use similarity measure based on the Graded mean integration representation of distance proposed by Hsieh and Chen [31] where the degree of similarity S(A, B) between
A and B are calculated as S(A, B) 1 1 d(A, B)
,
d(A,B)P(A) P(B) , P(A) and P(B) are the graded mean integration representation distance.
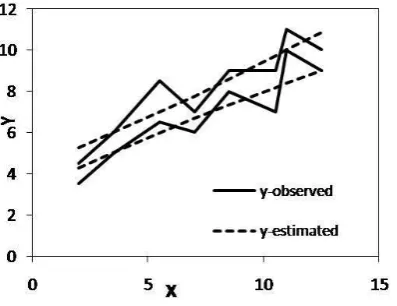
Example 1: Consider the data set in Table .1 in which the observations of the input and output variables are symmetric triangular fuzzy numbers. Our proposed method is compared with other methods such as Hong et al. [9], Nasrabedi and Nasrabedi [32] and Diamond [8], they applied least-square method. The results of fitting models to the data set in TABLE 1 are as follows:
The fuzzy regression model obtained by the proposed approach,
Y
(3.78,0.5)
w(0.49,0.074)
wX
with optimum value h=0 and the graph is shown in Figure 1. [image:4.595.311.537.83.306.2]D.H. Hong et al. [9] proposed the Tanaka’s model using Tw - norm and obtained the fuzzy regression model for the given data as:
Y
(4.153, 2.643)
w(0.459,0.281)
wX
Figure 1. Data set in Table 1 using proposed approach.
Using Nasrabedi and Nasrabedi (2006) method of approach for the given fuzzy input and fuzzy output data, The
regression model is given below:
Y
(3.39,0.75) (0.5454,3.045)X
with h=0.6Diamond [8] also proposed the least square approach for fuzzy observations in TABLE 1, for which the following fuzzy regression model is constructed:
Y
3.57 (0.547,0.1)X
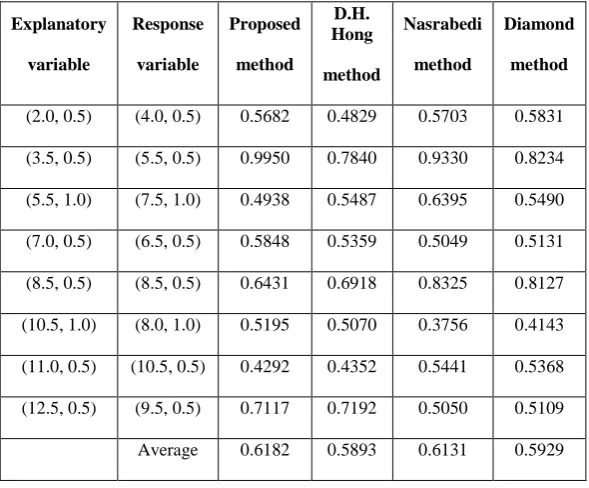
The similarity measures between the observed and estimated fuzzy responses for the aforementioned models are given in TABLE 1, the proposed fuzzy model obtained by the absolute deviation between the observed and estimated responses using Tw norm based operations has larger similarity measure than Hong et al., Nasrabedi and Diamond approach.
Consider the data set in TABLE 2 with fuzzy input and fuzzy output spread with outlier. The fuzzy regression model using the proposed approach for the data with outlier is,
w w
Y
(3.397,0.709)
(0.568,0.2212)
X
with h= 0.5588 (given in Figure 2).Figure 2. Data set in Table 2 using proposed approach with outlier.
The fuzzy regression model obtained by the proposed approach modifying the outlier data using Chen’s [30]
approach is given below:
w w
[image:4.595.314.531.387.572.2]Y
(4.4406, 2.5)
(0.432,0.2)
X
with h=0.3475 (given in Figure 3)Figure 3. Data set in Table 2 using proposed approach with modified outlier data.
Figure 3 displays the observation intervals (bold lines) and the proposed method fuzzy band (dotted line). Looking at the results, the proposed method provide a more balanced result, which has relatively low values for sum of half width of regression coefficients 2.7
sj
and the sum of half widthof predicted intervals 17.74
T
js x
. [image:4.595.54.253.405.558.2]Table 1: Data set and Similarity measures for different models without any outlier.
Explanatory
variable
Response
variable
Proposed
method
D.H. Hong
method
Nasrabedi
method
Diamond
method
(2.0, 0.5) (4.0, 0.5) 0.5682 0.4829 0.5703 0.5831
(3.5, 0.5) (5.5, 0.5) 0.9950 0.7840 0.9330 0.8234
(5.5, 1.0) (7.5, 1.0) 0.4938 0.5487 0.6395 0.5490
(7.0, 0.5) (6.5, 0.5) 0.5848 0.5359 0.5049 0.5131
(8.5, 0.5) (8.5, 0.5) 0.6431 0.6918 0.8325 0.8127
(10.5, 1.0) (8.0, 1.0) 0.5195 0.5070 0.3756 0.4143
(11.0, 0.5) (10.5, 0.5) 0.4292 0.4352 0.5441 0.5368
(12.5, 0.5) (9.5, 0.5) 0.7117 0.7192 0.5050 0.5109
Average 0.6182 0.5893 0.6131 0.5929
also be observed graphically. Also the effect of outlier in fuzzy input and fuzzy output data is discussed in TW- norm with proposed method and it is shown in Figure 2 and Figure 3.
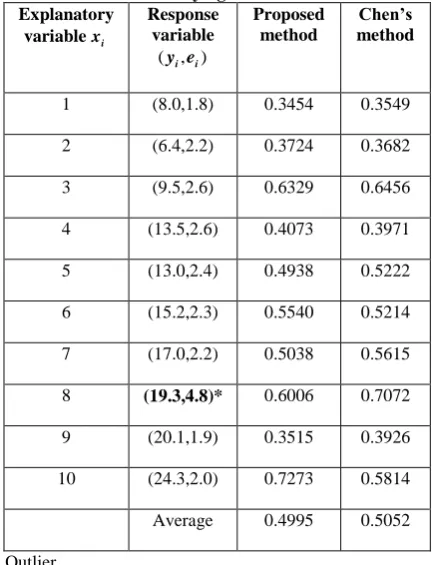
[image:5.595.58.276.486.731.2]Example 2: Consider the data set in Table 3 used by Chen [30] with crisp input and fuzzy output. The fuzzy regression model obtained by the proposed approach for the data set given in Table 3 is given below:
Table 2: Data set (fuzzy input and fuzzy output) with and Similarity measure for proposed model and Chen’s model
with modified outlier.
Explanatory
variable
( , )
x
i
iResponse variable
( , )
y e
i iProposed method
Chen’s method
(2.0,0.5) (4.0,0.5) 0.6576 0.4159
(3.5,0.5) (5.5,0.5) 0.0.8797 0.6441
(5.5,1.0) (7.5,1.0) 0.4965 0.6741
(7.0,0.5) (6.5,0.5) 0.5466 0.4844
(8.5,0.5) (8.5,2.5)* 0.7532 0.7768
(10.5,1.0) (8.0,1.0) 0.4356 0.4594
(11.0,0.5) (10.5,0.5) 0.5199 0.4530
(12.5,0.5) (9.5,0.5) 0.5209 0.6942
Average 0.6013 0.5752
* Outlier
w
Y
(4.125, 4.8)
(1.98,0.3649)
X
with confidence level h=0.3479 (shown in Figure 4). Chen’s method of modifying outlier in Tanaka approach for the given data is given below:Y
(4.25,5.63) (1.933,0.489)X
with confidence level h= 0 level.
Figure 4 displays the observation intervals (dotted lines) and the proposed method fuzzy band (bold line). The proposed method provide a more balanced result, which has relatively low values for sum of half width of regression coefficients 5.165
sj
and the sum of half width of predicted intervals 31.667
T
j
s x
. Note that the average similarity measure 50% indicates a fairly good fuzzy linear relationship which can also be observed graphically for the proposed method in crisp input and fuzzy output data set. Also the effect of outlier in crisp input and fuzzy output data is discussed in Tw - norm with proposed method and the parameter values for both the proposed method and Chen’s method almost have the same values.Example 3. Consider the real data set given in TABLE 4. The fuzzy regression model using the proposed approach is given as follows:
Y
(1.33,0.6922)
w(0.123,0)
wX
Hong et al. [33] used the above data set and obtained the following regression model based on their approach as,
Table 3: Data set (crisp input and fuzzy output) and Similarity measure for Proposed and Chen’s models with
modifying outlier. Explanatory
variablexi
Response variable
( , )y ei i
Proposed method
Chen’s method
1 (8.0,1.8) 0.3454 0.3549
2 (6.4,2.2) 0.3724 0.3682
3 (9.5,2.6) 0.6329 0.6456
4 (13.5,2.6) 0.4073 0.3971
5 (13.0,2.4) 0.4938 0.5222
6 (15.2,2.3) 0.5540 0.5214
7 (17.0,2.2) 0.5038 0.5615
8 (19.3,4.8)* 0.6006 0.7072
9 (20.1,1.9) 0.3515 0.3926
10 (24.3,2.0) 0.7273 0.5814
Average 0.4995 0.5052
[image:6.595.58.276.102.385.2]* Outlier
Table 4: Data set and Similarity measures for Proposed and Hong et al.’s method
Explanatory variable(xi, )i
Response variable
(y ei, )i
Proposed method
D.H.Hong method
(21.0,2.1) (4.0,0.8) 0.9199 0.9091
(15.0,2.25) (3.0,0.3) 0.8511 0.8475
(15.0,1.5) (3.5,0.35) 0.7547 0.7576
(9.0,1.35) (2.0,0.40) 0.6959 0.6849
(12.0,1.2) (3.0,0.45) 0.8375 0.8475
(18.0,3.6) (3.5,0.70) 0.9579 0.9616
(6.0,0.6) (2.5,0.38) 0.6983 0.7143
(12.0,2.4) (2.5,0.5) 0.7657 0.7576
Average 0.8101 0.8099
The similarity measure between the observed and the estimated values for aforementioned model is given in TABLE 4 and 81% of average similarity measure shows the good relationship. From the above example, it is clear that the parameters estimated by the proposed method and by Hong et al. [33] method are almost same, which shows that the proposed method using TW norm is also effective when compared to the existing methods.
Figure 4. Data set in Table 3 using proposed approach with modified outlier data.
5. Conclusion
Based on the distance between the centers and spreads, a new method is proposed for fuzzy simple regression using Tw -norms. The models which used here have the input and the output data as well as the coefficients are assumed to be fuzzy. The arithmetic operations based on the weakest t-norm are employed to derive the exact results for estimation of parameters. The efficiency of the proposed approach is studied by similarity measure based on the graded mean integration representation distance of fuzzy numbers. In addition, the effect of the outlier is discussed for the proposed approach. By comparing the proposed approach with some well known methods, applied to three data sets, it is shown that the proposed approach is effective. Studying the effect of outlier in center value of response variable using proposed method with TW norm operation is our future work.
6. REFERENCES
[1] R.E. Bellman and L.A. Zadeh, “Decision making in a fuzzy environment”, Manage. Sci. Vol. 17B, Pp. 141-164, 1970.
[2] H. Tanaka, S. Ueigma and K. Asai, “Linear regression analysis with fuzzy mode”, IEEE Trans Systems, Man Cybernet. Vol. 12, Pp. 903-907, 1982.
[3] H. Tanaka, “Fuzzy data analysis by possibilistic linear models”, Fuzzy Sets and Systems, Vol. 24, Pp. 363-375, 1987.
[4] H. Tanaka and J. Watada, “Possibilistic linear systems and their applications to the linear regression model”, Fuzzy Sets and Systems, Vol. 27, Pp. 275-289, 1988. [5] H. Tanaka, I. Hayashi and J. Watada, “Possibilistic linear
regression analysis for fuzzy data”, Eur. J. Opera. Res. Vol. 40, Pp. 389-396, 1980.
[6] D. T. Redden and W. H. Woodall, “Properties of certain fuzzy linear regression models”, Fuzzy Sets and Systems, Vol. 44, Pp. 361-375, 1994.
[7] A. Celmins, “Least squares model fitting to fuzzy vector data”, Fuzzy sets and systems, Vol. 22, Pp. 245-269, 1987.
[image:6.595.58.276.409.655.2][9] D.H. Hong, S. Lee and D.Y. Do, “Fuzzy linear regression analysis for fuzzy input-output data using shape preserving operations”, Fuzzy sets and Syst. Vol. 122, Pp. 513-526, 2001a.
[10]J. Mohammadi and S.M. Taheri, “Pedomodels fitting with fuzzy least squares regression”, Iranian Journal Fuzzy Syst., Vol. 1, Pp. 45- 61 2004.
[11]R. Coppi, P.D. Urso, P. Giordani and A. Santoro, “Least squares estimation of a linear regression model with LR fuzzy response”, Comput. Stat. Data anal. Vol. 51, Pp. 267-286, 2006.
[12]A. R. Arabpour and M. Tata, “Estimating the parameters of a Fuzzy Linear Regression model”, Iranian J. Fuzzy syst. Vol. 5, Pp. 1-20, 2008.
[13]H.K. Kim, J.H. Yoon and J.H. Li, “Asymptotic properties of least squares estimation with fuzzy observations”, Infor. Sci. Vol. 178, Pp. 439-451, 2008. [14]J. Lu and R. Wang, “An enhanced fuzzy linear regression
model with more flexible spreads”, Fuzzy sets and Syst. Vol. 160, Pp. 2505-2523, 2009.
[15]P.T. Chang and E.S. Lee, “Fuzzy least absolute deviations regression based on the ranking of fuzzy numbers”, Proc. IEEE world congress on computational intelligence, Pp. 1365-1369, 1994.
[16]K.J. Kim, D.H. Kim and S.H. Choi, “Least absolute deviation estimator in fuzzy regression”, J. Appl. Math. Comput. Vol. 18, Pp. 649-656, 2005.
[17]H. Torabi and J. Behboodian, ” Fuzzy least absolutes estimates in linear regression models”, Communi. Stat. – Theory methods, Vol. 36, Pp. 1935-1944, 2007. [18]L.H. Chen and C.C. Hsueh, “A mathematical
programming method for formuation a fuzzy regression model based on distance criterion”, IEEE Trans. Syst. Man Cybernet. Vol. B 37, Pp. 705-712, 2007.
[19]S.H. Choi and J.J. Buckley, “Fuzzy regression using least absolute deviation estimators”, Soft Comput. Vol. 12, Pp. 257-263, 2008.
[20]S.M. Taheri and M. Kelkinnama, “Least absolute regression”, Proc. 4th
international IEEE conference on intelligent systems, varna Bulgaria, Vol. 11, Pp. 55-58, 2008.
[21]S.M. Taheri, and M. Kelkinnama, “Fuzzy linear regression based on least absolute deviations”, Iranian J. fuzzy system, Vol. 9, Pp. 121-140, 2012.
[22]C.H. Ling, “Representation of associative functions”, Publicationes Mathematicae – Debrecen, Vol. 12, Pp. 189-212, 1965.
[23]L.A. Zadeh, “Fuzzy sets as a basis for a theory of possibility”, Fuzzy sets and Syst., Vol. 1, Pp. 3-28, 1988. [24]D.H. Hong, “Shape preserving multiplication of fuzzy
intervals”, Fuzzy sets and Syst,. Vol. 123, Pp. 81-84, 2001.
[25]D.H. Hong, “On shape preserving addition of fuzzy intervals”, Journal of Mathematical Analysis and applications, Vol. 267, Pp. 369-376, 2002.
[26]A. Kolsevera, “Additive preserving the linearity of fuzzy intervals”, Tata mountains Math. Publi. Vol. 6, Pp. 75-81, 1994.
[27]R. Mesiar, “Shape preserving addition of fuzzy intervals”, Fuzzy sets and Syst., Vol. 86, Pp. 73-78, 1997.
[28]D.H. Hong and H.Y. Do, “Fuzzy system reliability analysis by the use TW (the weakest norm) on fuzzy arithmetic operations”, Fuzzy Sets and Systems., Vol. 90, Pp. 307-316, 1997.
[29]E. Modarres, E. Nasrabadi and M.M. Nasrabedi, “Fuzzy linear regression models with least square error”, Applied mathematics and Computation, Vol. 163, Pp. 977-989, 2005.
[30]Y.S. Chen, “Outliers detection and confidence interval modification in fuzzy regression”, Fuzzy sets and systems, Vol. 119, Pp. 252-279, 2001.
[31]C.H. Hsieh and S.H. Chen, “Similarity of generalized fuzzy numbers with graded mean integration representation”, Proceedings of Eighth international fuzzy system association world congress, Taipei, Taiwan, Republic of China, Vol. 2, Pp. 551-555, 1999.
[32]M.M. Nasrabedi and E. Nasrabedi, “Mathematical programming approaches to fuzzy linear regression analysis”, Appl. Math. Comput., Vol. 155, Pp. 873-881, 2004.