Development of Multimodal Biometric Framework for
Smartphone Authentication System
Tapas Kumar Mohanta
M.Tech ScholarDepartment of Computer Science and Engg Birla Institute of Technology, Mesra, Ranchi, India
Subrajeet Mohapatra
Assistant ProfessorDepartment of Computer Science and Engg. Birla Institute of Technology, Mesra, Ranchi, India
ABSTRACT
Secret knowledge, like remembering password or token based authentication systems are deemed inconvenience and difficult to use for users such as password may be forgotten or token may be lost. So burdens like remembering password and stolen or forged token based authentication have raised a current trend of biometric authentication system. Now in this current tech world, everyone needs security everywhere to protect our personal gadgets. Now-a-days smartphone gradually becoming a vital tool to manipulate enormous applications which were being done in a computer before. So to keep it secured, biometric based approach can be applied for better convenience and ease of use for the user.
In this paper, a novel hybrid multimodal approach for ear recognition and speech recognition has been presented for better robustness and efficiency which can be applied in various fields of applications like authentication in banking transactions. Here two techniques DWT (using haar wavelet) and GLCM have hybridized to extract both shape and texture information from ear images. Again MFCC technique has applied to extract features from speech signals. Afterwards fusion is applied to mix both of those ear and speech features. Those features can be easily and efficiently manipulated by applying Euclidean distance and Bhattacharya distance as the similarity or dissimilarity measures. This proposed approach is very convenient and simple to use, thereby its ease of use allows very fast feature extraction.
General Terms
Image Processing, Biometrics, Security, Authentication
Keywords
Multimodal Biometrics, Ear, Speech, Fusion, Smart phone
1.
INTRODUCTION
Cell phones are already prime targets for theft. The rapid growth of smartphone users and vast trend of smartphone becoming personal device carrying sensitive data are the obvious reasons. But the question arises that what is protecting these confidential data stored on smartphones? However, authentication for smartphone is critical that’s why it is gaining many research interests. Currently the authentication methods can be broadly divided into three main areas which are
i. Knowledge based ii. Token based
iii. Biometric based authentication.
A large number of users believe that an alternative method like biometrics to security would be a good idea. Because password may be forgotten and token may be lost. In this paper, study on a multimodal biometrics using ear and speech biometrics approach has presented to authenticate smartphone
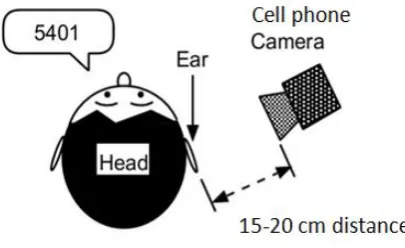
[image:1.595.321.524.538.662.2]users. First of all, ear does not change during human life as ascertained by Prague Doctor Imhofer[8], whereas face changes more significantly than any other part of human body. Other than those cosmetics, beard, mustache, hairstyle, emotions shows different state of mind such as happiness, sadness, fear or surprise. In addition to this color distribution is more uniform in ear rather than human face, iris or retina there is while working with grayscale, one does not lose much information. Besides ear is smaller than face, which means that it is possible to work faster and more efficiently with the image with the lower resolution which can be easily acquired by a smartphone camera. In addition, it is important to note that ear images cannot be disturbed by glasses, beard or makeup. Those are the reasons why ear biometric has been chosen by comparing with other biometrics such as face, iris & retina. However, sometimes occlusion by either hair or earrings is possible. Nevertheless, one can get rid of these negative points for typical applications. In addition with ear biometric, another biometric speaker recognition technique has added to increase the robustness and efficiency of the system. A voice signal carries physiological characteristics of an individual such as glottis, vocal chords and vocal tract dimensions. Automatic speech recognition (ASR) can be defined as the independent, computer‐driven transcription of spoken language into readable text in real time. ASR technology allows a computer to identify the words that a person speaks into a microphone or telephone and convert it to written text. This whole scenario of the location of speaker and camera can be visualized from the following figure 1.
Fig 1: Position of speaker and camera.
2.
SYSTEM STRUCTURE
2.1
Ear Segmentation
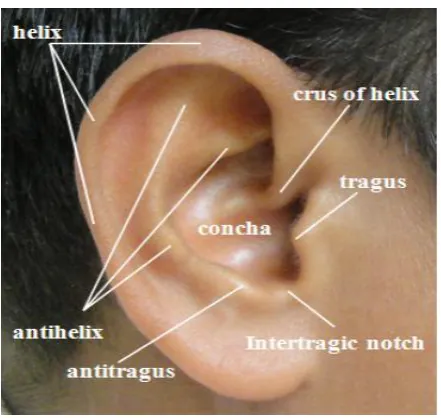
First of all ear images and speech data were collected. Next color normalization was applied because of the lighting conditions of individual images of the ear. The image acquisition system captures ear as a larger portion of image that also contains data from immediately surrounding ear region. Thus, prior to performing segmentation and feature extraction it is necessary to localize only that portion of the image that contains antihelixes, crus of helix, concha and tragus of the ear as shown in Fig 2. i.e. external ear.
Fig 3: Various features of an ear.
In this experiment color image cannot be taken. That is why this image has to be converted into gray scale image by using the function 'rgb2gray'. Then the centroid of the image was found. Then the image was cropped as depicted in the following Fig 4.
Fig 4: The process of cropping the image with respect to
the centroid.Here, the idea which is ear images can be seen as a composition of micro-patterns was taken which can be well described by fusion of two techniques such as DWT (using haar wavelet) and GLCM, into account. Afterwards, in order to get the features smartphone user can adjust the location of ear center. Then, those features were combined with DWT (using haar wavelet) and GLCM. The results of previous steps give representation of ear. Next to increase the accuracy of authentication system, the solid judgment on authenticating users can be achieved by a fusion of multiple sub authentication systems coming from multimodal human contexts such as speech recognition. Finally, recognition is performed using a nearest neighbor classifier in the computed feature space with Euclidean distance and Bhattacharya distance as similarity or dissimilarity measures.
2.1.1.
Discrete Wavelet Transform (DWT)-
A discrete wavelet transform (DWT) is any wavelet transform for which the wavelets are discretely sampled. It captures both frequency and location information. For an input represented by a list of 2^n numbers, the Haar wavelet transform may be considered to simply pair up input values, storing the difference and passing the sum. This process is repeated recursively, pairing up the sums to provide the next scale: finally resulting in (2^n-1) differences and one final sum.
[image:2.595.152.540.87.439.2]The Haar wavelet's mother wavelet function can be described as
[image:2.595.55.276.430.639.2]=
Its scaling function can be described as
=
2.1.2. Gray-Level Co-Occurrence Matrix
(GLCM)-
GLCM is a tabulation method of how often different combinations of grey levels occur in image neighborhoods. Key components in creating the GLCM are the direction (E,W,N,S,NE,NW,SE,SW) and distance between the reference pixel and neighbor pixel.
After manipulating, we have got four matrices as follows:
A – Auxiliary matrix } approximation co-efficient matrix
H – Horizontal matrix
V – Vertical matrix detail co-efficient
D – Diagonal matrix matrix
Afterwards we have to calculate the mean and variance of all four matrices as depicted above.
Deriving Statistics from a GLCM-
After creating the GLCMs, several statistics can be derived from them using the 'graycoprops' function. These statistics provide information about the texture of an image. The following table lists the statistics which can be derived.
Table 1: The statistics which provide information about the texture of an image
Property
Description
Contrast It measures the intensity contrast between a pixel & its neighbor over the whole image.
Correlation It measures how correlated a pixel is to its neighbor over the whole image.
Energy It returns the sum of squared elements in the GLCM.
Homogeneity It measures the closeness of the distribution of elements.
Afterwards the mean and variance of this fourier descriptor was being calculated.
2.2
Speech Recognition using MFCC:
From [3] MFCC is based on human hearing perceptions which cannot perceive frequencies over 1Khz. In other words, MFCC is based on known variation of the human ear’s critical bandwidth with frequency [8-10]. MFCC has two types of filter which are spaced linearly at low frequency below 1000 Hz and logarithmic spacing above 1000Hz. A subjective pitch
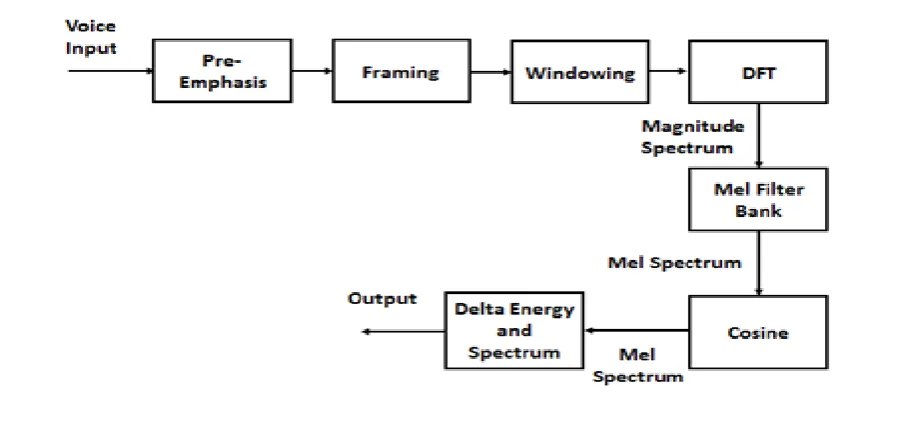
is present on Mel Frequency Scale to capture important characteristic of phonetic in speech. The overall process of the MFCC is shown in Figure 5.
As shown in Figure 5, MFCC consists of seven computational steps. Each step has its function and mathematical approaches as discussed briefly in the following:
Step 1: Pre–emphasis
Signal passes through a filter which emphasizes higher frequencies.
Step 2: Framing
Speech samples obtained from analog to digital conversion (ADC) were segmented into a small frame with the length within the range of 20 to 40 msec.
Step 3: Hamming windowing
Hamming window is used as window shape by considering the next block in feature extraction processing chain and integrates all the closest frequency lines.
Step 4: Fast Fourier Transform
Each frame of N samples was converted from time domain into frequency domain. The Fourier Transform is used to convert the convolution of the glottal pulse and the vocal tract impulse response in the time domain.
Step 5: Mel Filter Bank Processing
The frequencies range in FFT spectrum is very wide and voice signal does not follow the linear scale. The bank of filters according to Mel scale is then performed.
Step 6: Discrete Cosine Transform
Converting the log Mel spectrum into time domain using Discrete Cosine Transform(DCT). The result of the conversion is called Mel Frequency Cepstrum Coefficient.
Step 7: Delta Energy and Delta Spectrum
The voice signal and the frames changes over time, such as the slope of a formant at its transitions. Therefore, there is a need to add features related to the change in cepstral features over time.
Fusion
There is no individual trait exist which can provide 100% accuracy. Further, the results obtained from the ear biometric may sometimes arises problems such that exposure to light and if there exist any diseases. Similarly, the problem may be faced by speech biometric due to external noise or cold or due to age. Hence those biometrics leads to false recognition of an individual. Thus to overcome the problems faced by individual traits of ear or speech biometrics, a novel combination is proposed for the recognition system. The integrated system also provides more robustness and accuracy which leads by making it difficult for an intruder to spoof multiple biometrics simultaneously. The individual scores obtained from each individual are combined at matching score
speech
MS
be the matching scores obtained from ear and speech modalities respectfully. The steps involved are as follows:Step 1: Score Normalization
In this step the matching scores are being brought down between 0 and 1. The normalization of both the scores are done by the following formula
ear ear
ear ear
ear
MS
N
min
max
min
speech speech
speech speech
speech
MS
N
min
max
min
where
max
earandmin
ear are the maximum andminimum scores for ear recognition and
max
speechspeech
min
are the maximum and minimum scores for speech recognition.Step 2: Generation of Similarity Scores
The normalized score of ear biometric obtained through Haar wavelet gives the information about dissimilarity between the feature vectors of the two given images while the normalized score of speech biometric gives a similarity measure. Therefore to fuse both those obtained scores, there is a need to make both the scores as similarity or dissimilarity measure. Here the normalized score of ear biometric is converted to similarity by using the following step as follows
ear
N
=1-N
earStep 3: Fusion
The normalized similarity scores of ear and speech biometrics are being fused linearly by using the sum rule as follows
speech
ear
N
N
MS
*
'
*
Where α and β are two weighted values which can be determined by using some function. Here MS is used as the matching score. Therefore if the value of MS is more than the
given threshold value, then the individual is accepted otherwise rejected.
2.4 Cryptography Using RSA Algorithm:
Those extracted values of the ear and speech data are then sent over an unsecured channel to the central server. So to make those data secured, encryption is used while sending those data. Then after getting those encrypted data at the server side, the server decrypt those data to get the original values. Here in this experiment, a cryptography technique RSA algorithm is used.2.5 Feature Matching
There are two kinds of matching modes: 1. One: One (verification)
2. One: Many (identification)
Identification is the process of trying to find out a person’s identity by comparing the person who is present against a biometric pattern or template database. The system would have been pre-programmed with biometric pattern or template of multiple individuals. During the enrolment stage, a biometric would have been processed, stored and encrypted, for each individual.
A pattern or template that is going to be identified is going to be matched against every known template, yielding either a score or distance describing the similarity between the pattern and the template. The system assigns the pattern to the person with the most similar biometric template. To prevent impostor patterns (in this case all patterns of persons not known by the system) from being correctly identified, the similarity has to exceed a certain level. If this level is not reached, the pattern is rejected.
With verification, a person’s identity is known and therefore claimed a priority to search against. The pattern that is being verified is compared with the person’s individual template only. Similar to identification, it is checked whether the similarity between pattern and template is sufficient enough to provide access to the secured system or area.
[image:4.595.58.510.77.297.2]Here in this approach, one:many approach has been used.
2.6 Summary
In this chapter an endeavor has been made to develop an efficient preprocessing approach that generates desired segmented ear image for feature extraction. In addition to that speech biometric the proposed model increases robustness and becomes more efficient. This (Fig 6) describes how the authentication system works in web.
[image:5.595.77.265.163.297.2]Fig 6: The process of pattern comparison and authentication in web.
3.
EXPERIMENTAL RESULT
A.
Ear and speech databases used in the
research.
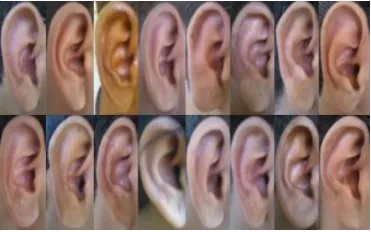
[image:5.595.309.548.196.350.2]To measure the performance of automated ear biometric and speech biometric system, extensive experiments have been carried out at various levels. Experimental results are obtained on own created database to take all possible factors into consideration like scaling, illumination and different camera view point. This database is acquired in an indoor environment such that less noise factors available during image acquisition and speech recording. Database is collected over 250 right ear images of ±10◦ angle variation and speech data were taken from 50 subjects (5 images per person) at approximately. Ear samples from the created databases are shown in Fig 7. Ear images and speech data were taken from university students using smartphone Nokia Lumia 710 having 5MP camera.
Fig 7: Sample ear images from own created database
Fig.7 shows some ear images from the databases. In order to get the final result, two special techniques known as 'euclidian distance' and ‘bhattacharya distance’ was applied which are faster methods to calculate efficiently.
Upon completing all experiments, the recognition rates (in %) are listed in Table 2 and Table 3. In these experiments, in every methods trial, the template set consists of three random images from each subject and the remaining images serve as
the testing set. One individual testing set was compared with one template set from 30 persons with 3 template images each. Then, one test image is compared against all 85 template images using a classifier. The result per trial is the closest matching image in template. Using euclidean distance 93.5% and using bhattacharya distance, 85.17% accuracy was obtained as mentioned in the following table.
3.1
Comparison Table
Table 2.Classification accuracy for different biometrics using Euclidean Distance measure
Trail 1
Trail 2
Trail 3
Trail 4
Trail 5
Avg.
Ear Biometric
63.59 82.63 51.83 82.58 64.26 68.97
Speech Biometric
83.07 67.12 74.16 87.49 82.58 78.88
Multimodal Biometric
91.23 100 86.3 93.65 96.32 93.5
Table 3.Classification accuracy for different biometrics using Bhattacharya Distance measure
Trail 1
Trail 2
Trail 3
Trail 4
Trail 5
Avg.
Ear Biometric
63.8 58.38 48.29 72.57 82.29 65.06
Speech Biometric
78.97 89.48 63.59 73.92 68.13 74.81
Multimodal Biometric
91.73 94.31 76.38 89.98 73.48 85.17
4.
CONCLUSION AND FUTURE WORK
Here, a novel approach for multimodal ear recognition and speech recognition was represented with respect to smartphone. Using services like IaaS, Staas, Saas, Paas users can even simply rely on a cell phone or thin client to do many of things that can only be done on a personal computer in the past, which means that cloud computing is universal.
Unlike one:one this describes comparison of 1 sample with pool of data sets present in the server as described in fig. 7. The proposed approach has capability to apply and implement in various fields practically such as banking transaction.
[image:5.595.311.548.399.547.2] [image:5.595.74.260.531.647.2]smartphone by creating application software in Java programming language.
5.
ACKNOWLEDGMENTS
Our special thanks to Tanushree Mam, Assistant Professor at Dept. of Computer Science and Engg., Birla Institute of Technology, Mesra, Ranchi, India
6.
REFERENCES
[1] Ali Fahmi P.N., Elyor Kodirov, Deok-Jai Choi, Guee-Sang Lee, Shohel Sayeed and Mohd Fikri Azli A. Implicit Authentication based on Ear Shape Biometrics using Smartphone Camera during A Call at 2012 IEEE International Conference on Systems, Man, and Cybe-rnetics. Cybernetics October 14-17, 2012, COEX, Seoul, Korea.
[2] Koji Iwano, Tomoharu Hirose, Eigo Kamibayashi, and Sadaoki Furui. Audio-Visual Person Authentication Using Speech and Ear Images Tokyo Institute of Technology, Department of Computer Science 2-12-1 Ookayama, Meguro-ku, Tokyo, 152-8552 Japan.
[3] Chadawan Ittichaichareon, Siwat Suksri and Thaweesak Yingthawornsuk. Speech Recognition using MFCC. International Conference on Computer Graphics, Simulation and Modeling (ICGSM'2012) July 28-29, 2012 Pattaya (Thailand).
[4] Lindasalwa Muda, Mumtaj Begam and I. Elamvazuthi. Voice Recognition Algorithms using Mel Frequency Cepstral Coefficient (MFCC) and Dynamic Time
Warping (DTW) Techniques. Journal Of Computing, Volume 2, Issue 3, March 2010, ISSN 2151-9617.
[5] Shuo Wang and Jing Liu. Biometrics on Mobile Phone. Department of Biomedical Engineering, School of Medicine, Tsinghua University P. R. China.
[6] Adrian POCOVNICU. Biometric Security for Cell Phones. . Informatica Economică vol. 13, no. 1/2009 Academy of Economic Studies, Bucharest, Romania.
[7] M. Burge and W. Burger, Ear Biometrics. In A. Jain R. Bolle and S. Pankanti, editors, Biometics: Personal Identfication in a Networked Society, Kluwer Academic, 1998, pp. 273-286.
[8] H. Sieger, N. Kirschnik, and S. Möller, “POSTER: User Preferences for Phones,” Proceeding of the 6th Symposium on Usable Privacy and Security (SOUPS’10), 2010.
[9] S. Furnell, N. Clarke, and S. Karatzouni, “Beyond the PIN: enhancing user authentication for mobile devices,” Computer Fraud and Security, pp. 12-17, 2008.
[10] Confident Technologies, (2011, September 28). Survey Shows Smartphone Users Choose Convenience over
Security [Online]. Available: