Psychology Dissertations Department of Psychology
4-30-2018
A LONGITUDINAL STUDY OF
ELEMENTARY SCHOOL CLIMATE AND
ACHIEVEMENT: TESTING A PROTECTIVE
RESILIENCE MODEL
Katelyn Cleary Plescow
Follow this and additional works at:https://scholarworks.gsu.edu/psych_diss
This Dissertation is brought to you for free and open access by the Department of Psychology at ScholarWorks @ Georgia State University. It has been accepted for inclusion in Psychology Dissertations by an authorized administrator of ScholarWorks @ Georgia State University. For more information, please [email protected].
Recommended Citation
Plescow, Katelyn Cleary, "A LONGITUDINAL STUDY OF ELEMENTARY SCHOOL CLIMATE AND ACHIEVEMENT: TESTING A PROTECTIVE RESILIENCE MODEL." Dissertation, Georgia State University, 2018.
A LONGITUDINAL STUDY OF ELEMENTARY SCHOOL CLIMATE AND
ACHIEVEMENT: TESTING A PROTECTIVE RESILIENCE MODEL
By
KATELYN CLEARY PLESCOW
Under the Direction of Christopher C. Henrich, PhD
ABSTRACT
This study sought to fill a gap in resilience and school climate theory. Research has found that
the protective model of resilience allows resources and assets to act as moderators to protect
individuals from risk. The protective model thus provides a way to understand how the school
environment can protect youth from individual level risk. School climate, providing a holistic
measure of the school environment may act as a resource to protect youth from risk on academic
achievement. This dissertation first investigated how school climate should be defined in a
longitudinal study and then hypothesized that student, parent, and personnel perceptions of
positive school climate will protect youth from individual risk on grades and test scores. The
study relied on elementary student data provided from a large urban school district in the
southeast of the United States of America. Findings showed that school climate perceptions stay
consistent over a three-year span and that the relationship of student risk on test scores or grades
was not conditional on student, parent and faculty reported school climate. Other findings,
limitations and applications are discussed.
ACHIEVEMENT: TESTING A PROTECTIVE RESILIENCE MODEL
by
KATELYN CLEARY PLESCOW
A Dissertation Submitted in Partial Fulfillment of the Requirements for the Degree of
Doctor of Philosophy
In the College of Arts and Sciences
Georgia State University
Copyright by Katelyn Cleary Plescow
ACHIEVEMENT: TESTING A PROTECTIVE RESILIENCE MODEL
by
KATELYN CLEARY PLESCOW
Committee Chair: CHRISTOPHER C. HENRICH
Committee: GABRIEL P. KUPERMINC
JOEL P. MEYERS
ROSE SEVCIK
Electronic Version Approved:
Office of Graduate Studies
College of Arts and Sciences
Georgia State University
DEDICATION
This manuscript is dedicated to my husband, Jason, for not always understanding what I was
talking about but for pretending to anyway and to my father, Joe, for teaching me what resilient
ACKNOWLEDGEMENTS
First and foremost, I want to thank my advisor, Dr. Christopher Henrich for his
advisement and support on this project and my entire doctoral study. Your support in every step
of my career, no matter how crazy the idea, has been unwavering and I cannot thank you enough.
I also would like to express gratitude to the rest of my committee and the faculty members in the
Department of Psychology.
I also want to thank my family. First, I want to thank my husband, Jason, for his support
in every step of my academic career. Babe, without you I would have 100% lost all my screws
by now, thank you for keeping me calm and crazy all at the same time. This degree has been
going on for a good majority of our relationship and you haven’t waived in your support of me,
even when I moved us- twice (sorry bout that). I love you! I also want to thank my dad, Joe.
Dad, you raised me to be strong-willed and headstrong, just like you, and although it may drive
you insane now, it got me to where I am today because I am just like you. I also want to thank
Mari & David, my in-laws, for always having my back. You guys have been there for every step
of this process (with a bottle of Prosecco) and I appreciate you so much. Also, I have to mention
Ruby & Prince because they have no idea but they for sure helped me stay sane.
Last and not least, I have a huge thank you for my friends. Jessica, you’re my best friend
and I would have jumped off many a cliff without you. Not only did we survive cognitive
psychology and pasta-gate of 2011 but everything else after that. Thank you for being the best.
To my R&E team – thank you all for listening to me complain and for the constant laughs. Insert
lame quote about how if you love what you will do, you will never work a day in your life here.
Serious megacube love for life. I’m sure there are people I forgot but honestly after writing this
TABLE OF CONTENTS
ACKNOWLEDGEMENTS ... v
LIST OF TABLES ... vii
LIST OF FIGURES ... viii
1.INTRODUCTION ... 1
1.1 Resilience ... 1
1.1.1 Models of Resilience ... 2
1.1.2 Risk Factors ... 7
1.1.3 Protective Factors ... 10
1.2 School Climate ... 13
1.3 Developmental Perspective ... 19
2. THE CURRENT STUDY ... 22
2.1 Research Questions ... 23
3. METHODOLOGY ... 26
3.1 Sample ... 26
3.2 Measures ... 27
3.3 Analyses ... 35
4. RESULTS ... 44
4.1 Descriptive Statistics ... 44
4. 2 Model Results ... 44
5. Discussion ... 80
5.1 Summary of Findings and Theoretical Implications ... 80
5.2 Limitations and Future Directions ... 85
5.3 Applied Implications ... 88
REFERENCES ... 89
APPENDICES... 99
Appendix A. ... 99
Appendix B ... 101
LIST OF TABLES
Table 1. Demographics of Sample in 2014 ... 26
Table 2. List of Elementary Student Items & Domains ... 30
Table 3. Parent Items & Domains ... 31
Table 4. Personnel Items & Domains ... 32
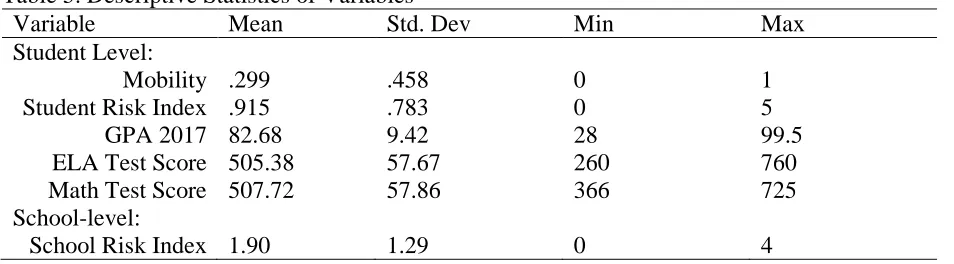
Table 5. Descriptive Statistics of Variables ... 44
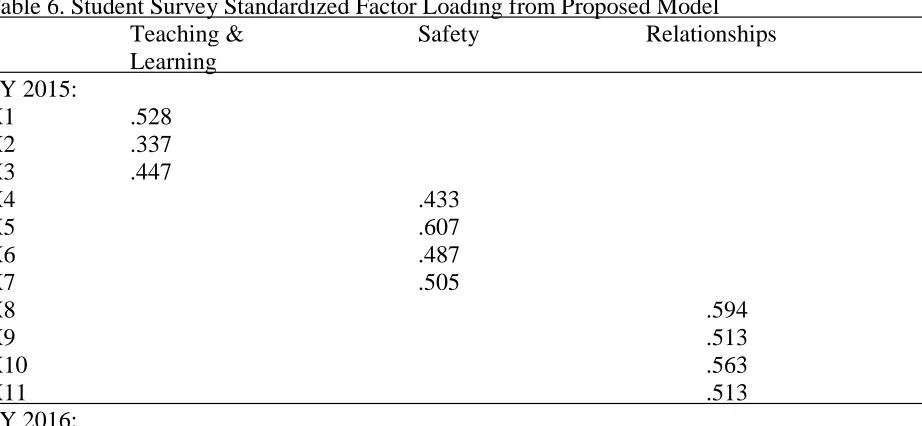
Table 6. Student Survey Standardized Factor Loading from Proposed Model ... 45
Table 7. Standardized Factor Loadings for Best Fitting Model. ... 47
Table 8. Fit Indices for Invariance Tests for Student Survey ... 48
Table 9. Standardized Factor Loadings & Residual Variances of Student Scalar Model ... 48
Table 10. Parent Survey Standardized Factor Loadings for the Proposed Model ... 49
Table 11. Factor Correlations of 2017 Group for Parent Survey ... 51
Table 12. Parent Survey Standardized Factor Loadings for Best Fitting Model ... 51
Table 13. Parent Survey Standardized Factor Loadings with Higher-Order Factor... 54
Table 14. Fit Indices for Invariance Tests for Parent Survey without Higher-Order ... 56
Table 15. Parent Survey Standardized Factor Loadings for the Scalar ... 56
Table 16. Personnel Survey Standardized Factor Loadings for the Proposed Model ... 58
Table 17. Factor Correlations of Personnel Survey SY2017 ... 60
Table 18. Personnel Survey Standardized Factor Loadings for Best Fitting Model ... 61
Table 19. Personnel Survey Standardized Factor Loadings with Higher-Order Factor ... 63
Table 20. Fit Indices for Invariance Tests for Personnel Survey without Higher- Order ... 66
Table 21. Personnel Survey Standardized Factor Loadings for Scalar Model... 66
Table 22. Descriptive Statistics for Climate Variables ... 68
Table 23. Correlations Across Year and Survey ... 69
Table 24. Slopes & Intercepts Estimates of Growth Curve ... 69
Table 25. Correlations between Aggregated School Climate Variables ... 70
Table 26. Correlations of Student-Level Variables ... 71
Table 27. Hierarchical Linear Model Estimates for Average Grade in Core Subjects ... 73
Table 28. Hierarchical Linear Model Estimates for ELA Scale Scores ... 76
Table 29. Hierarchical Linear Model Estimates for Math Scale Scores ... 78
LIST OF FIGURES
Figure 1. Confirmatory Factor Analysis for Student Survey ... 38
Figure 2. Confirmatory Factor Analysis for Personnel Survey ... 39
Figure 3. Confirmatory Factor Analysis for Parent Survey ... 40
Figure 4. Linear Growth Curve Analysis ... 41
1. INTRODUCTION
Resilience theory provides a basis to understand how individuals respond to risk (Masten,
2014). In resilience research, an individual encounters or inherits risk and overcomes negative
outcomes due to protective factors (Garmezy, Masten, & Tellegen, 1984). The two main models
the current study utilizes are the compensatory model and the protective model. The
compensatory model is a main effect model in which risk has a direct relationship an outcome
and protective factors also have a direct relationship to the same outcome (Zimmerman &
Arunkamar, 1994). The protective model is a moderation model in which the risk has a direct
relationship to an outcome but a protective factor buffers this relationship. To define risk, some
use a cumulative risk index to account for the snowball effects of risk and any relationships
between different risks (Sameroff, 2006). Protective factors can either be assets or resources
depending on how the individual interacts with them. Assets are attributes an individual already
possesses and resources are external to the individual (Windle, 2011). Within the context of
resilience, school climate may act as an important resource for children.
School Climate provides a multidimensional measure of the school environment. The
National School Climate Council (2007) defines a positive and sustainable school climate as one
which promotes youth development and learning where all individuals are engaged and respected
while developing, living and contributing to a shared school vision. The current study relies on
resilience theory to assess if school climate can act as a protective factor in the compensatory and
protective models of resilience for elementary students who are placed at risk.
1.1 Resilience
Resilience is defined as the capacity of a dynamic system to adapt successfully to
that following exposure to risk, protective factors reduce the amount of adverse outcomes
(Garmezy, Masten & Tellegen, 1984; Khanlou & Wray, 2014). Resilience is not a static trait and
has been classified as a process, continuum and a global concept (Khanlou & Wray, 2014;
Masten & Powell, 2003; Zimmerman et al., 2013). Resilience is a process that develops over
time and is dependent on interactions with other individuals and environments. It is also a
continuum as the amount of resilience an individual needs or has differs based on the amount of
risk they are experiencing. Resilience is a global concept because it can apply to multiple
domains of life. A caveat to resilience research is that for an individual to experience resilience,
they must first experience risk (Luthar, Cicchetti, & Becker, 2000). Individuals are identified as
resilient when despite experiencing risk, they have positive outcomes or reduced negative
outcomes because of protective factors working in their favor (Fergus & Zimmerman, 2005;
Masten, 2014). According to researchers, when individuals are competent in one area, they tend
to be competent in other areas by way of competence cascades (Heckman, 2006; Masten &
Cicchetti, 2010). Within competence cascades, it is theorized that skills from one domain will
cross into another and lead to competence in the other. For example, students who are competent
in math will carry those skills into science (Masten, 2014). Thus, positive outcomes following
risk will lead to individuals being competent in all areas because competence begets competence.
1.1.1 Models of Resilience
There are two general approaches to studying resilience, person-focused models and
variable-focused models. Both the person-focused and the variable-focused models provide
researchers with valuable information about how individuals are resilient. Person-focused and
following paragraphs and can lead to different generalizations about resilience (Bergman,
Magnusson, & El-Khouri, 2003; Magnusson, 2003; von Eye & Bogat, 2006)
In person-focused models, the goal is to describe differences between individuals in how
risk is related to later adjustment (Laursen & Hoff, 2006). Person-focused models rely on case
studies, profile analysis, cluster analysis or trajectory analysis to identify subgroups of
individuals who possess inherent risks and are successful following risk. Individuals are
classified into categories of high and low risk and adjustment based on their response to risk. The
main benefit of a person-focused model is that it provides an in-depth look at one group of
individuals (Laursen & Hoff, 2006). Because person-focused models allow researchers to
compare subgroups of individuals on risks and outcomes, the main limitation is that results are
focused on a particular subpopulation and may not be generalizable to others.
In comparison, studies using the variable-focused method examine how protective factors
interact with differing risks and outcomes. Variable-focused models investigate changes in
outcomes due to the things an individual encounters in their environment rather than
demographic factors (Laursen & Hoff, 2006). Thus, variable-focused models are designed to
understand patterns in behavior response because they focus on variables as the unit of analysis
rather than individuals (Garmezy, Masten, & Tellegen, 1984). Often, variable-focused models
utilize multiple regression, or structural equation modeling (Laursen & Hoff, 2006). Both the
variable-focused and person-focused models of resilience provide useful information about risk
and resilience (Laursen & Hoff, 2006). The variable-focused model is more appropriate if a
researcher is concerned with understanding the different variables which contribute to an
more appropriate if a researcher is concerned with understanding how a specific population
responds to risk (Laursen & Hoff, 2006).
Because the current study will be relying on variables that are applicable to a wider
population, focused models will be a better fit. There are several types of
variable-focused resilience models. The compensatory model and the protective model are the most
common variable-focused models studied (Garmezy et al., 1984; Masten, 2014). The
compensatory model is a main effect model or is when there is a direct effect of a risk factor on
an outcome and a protective factor on an outcome (Zimmerman & Arunkamar, 1994). In the
compensatory model, the protective factor acts directly on the outcome and compensates for the
risk but not by direct interaction with the risk. In this model, risk such as child abuse has a direct
positive relationship to a negative outcome such as suicidality. However, community support has
a direct negative relationship to suicidality. A second example is that emotional distress has a
direct positive relationship to substance use and family support and parental involvement in
school have a direct negative relationship to substance (Fleming, Kim, Harachi, & Catalano,
2002). Another example suggests that school connectedness compensates for the cumulative risk
of prior violence, substance use, and victimization on the outcome of violent behaviors
(Borowsky, Ireland, & Resnick, 2002).
In the protective model, a protective factor moderates the effect of risk on a negative
outcome. An example of the protective model is family income buffering against the effects of
neighborhood problems on adolescent substance use such that when a neighborhood has
systemic problems, youth with family that has a higher income will engage in less substance use
than those whose family has a lower income (Duncan, Duncan, & Strycker, 2000). The
the risk. Protective-stabilizing models suggest that protective factors mitigate the effects of risk
on outcomes and lead to stability for an individual, as if the risk had never occurred (Fergus &
Zimmerman, 2005; Luthar, Cicchetti, & Becker, 2000). For example, when parents do not
provide support for youth the child may develop delinquent behaviors. However, having an adult
mentor could mitigate the effects of unsupportive parents, and the child would develop as
positively as he or she would have prior to the risk (Fergus & Zimmerman, 2005). The
protective-reactive model proposes that the protective factor diminishes the correlation between
the risk and outcome, reducing the negative outcome (Fergus & Zimmerman, 2005; Luthar,
Cicchetti, & Baker, 2000). In the protective-reactive model, a child who has faced adversity will
not have lowered positive outcomes in comparison to children who had not faced adversity.
However, the resources available to them will lead to better outcomes than those who faced the
same adversity without resources. The protective-reactive model is also a moderation model.
Fergus and Zimmerman (2005) use the example that the relationship between risk of drug abuse
and the outcome of sexual risk-taking is weaker for youth who receive sexual education. The
protective-protective model suggests that the protective factor enhances the effect of a different
protective factor to produce an outcome and is also sometimes called the protective-enhancing
model (Fergus & Zimmerman, 2005; Luthar, Cicchetti, & Becker, 2000). An example of the
protective-protective model is parental involvement and academic support both individually lead
to positive outcomes for youth defined as at-risk, but when both are present, the effect is
mitigated (Fergus & Zimmerman, 2005). However, some have argued that the
protective-protective model is not a resilience model because it does not include risk unless the target
A third model, the challenge model, suggests a curvilinear relationship between risk and
is based on the amount of risk present (Luthar & Zelazo, 2003). Thus, a moderate level of a risk
factor is related to positive outcomes where high levels of the same variable are related to
adverse outcomes. It can be said that in this model, the risk factor acts as its own buffer.
Developmental researchers refer to the challenge model as an inoculation process (Rutter, 1987;
Zimmerman & Arunkumar, 1994). The premise behind this model is that low and moderate
levels of risk exposure give youth a chance to practice skills. An example of the challenge model
uses family conflict. If youth experience no family conflict they may not learn to cope with
conflict outside the home, but when there is too much family conflict youth can become hopeless
or aggressive (Fergus & Zimmerman, 2005). The challenge model is less common in resilience
research because it is hard to define what appropriate levels of risk are in a population.
The compensatory, protective and challenge models of resilience have provided starting
points for the evaluation of how protective factors influence risk and outcomes using the
variable-focused method. In all of the models, and resilience literature at large, the main idea is
that protective factors may reduce the effects of negative outcomes and promote positive
outcomes for youth following risk exposure. Using the different resilience models, researchers
have evaluated a variety of risk and protective factors and how they differ in their level of
influence on individuals and positive and negative outcomes. In review of the different models of
resilience, it becomes clear that the compensatory and protective models of resilience are the
most common models. If a researcher is mainly concerned with how a protective factor acts as a
buffer, then the most appropriate model would be the protective model. Thus, it is both the
1.1.2 Risk Factors
The study of resilience primarily emerged from risk research (Masten & Tellegan, 2012).
Risk factors are the characteristics of an individual or the environment that are associated with
maladaptive outcomes (Compas et al., 1995). Risk factors have been suggested to have a
stronger influence on youth when the factors influence the social environment, and negative
outcomes are dependent on both the social context and individual's personality (Jessor, 1993).
Defining risk includes numerous complications. To start, what some individuals perceive
as risk might differ from what a researcher has defined as risk and often the fact that risk is not a
static trait and will likely change over time (Arrington & Wilson, 2000). Further, researchers
often deem youth “at-risk” without defining what variables led to risk which then leads to
misinterpretation by others (Arrington & Wilson, 2000). An ecological perspective of risk
utilizes a multidimensional approach where individuals interact with risk on different levels of
the environment may help overcome definition limitations by taking various systems into
account (Hixson & Tinzmann, 1990; Luthar, Cicchetti, & Becker, 2000; Resnick & Burt, 1996).
The ecological approach considers how an individual interacts with their social systems based on
Bronfenbrenner’s Bioecological Theory (Khanlou & Wray, 2014). As a result, risk can include
factors on individual, family, or other environmental levels.
At the individual level, common risk factors for lower academic achievement for youth
include socioeconomic status, homelessness, ethnicity, gender or learning disabilities (Arrington
& Wilson, 2000; Fergus & Zimmerman, 2005; Masten, 2014). The individual risk of poverty has
been related to social and health problems for youth (Fiester, 2010). Poverty during childhood
has been related to many short-term and long-term negative outcomes such as lowered school
the family level, the risk of academic failure and behavioral problems can arise either from
genetic influences that were passed down from the family or factors in the environment (Masten,
2014). The most studied family-level risk variables include interparental conflict, maltreatment
or neglect, and overall poor family function (Masten, 2014) although other types have also been
considered.
School-level risk is also important because schools provide one of the primary
environments where students can interact with peers and non-family members, learn skills, and
receive social and emotional support (Doll et al., 2009). Broadly, risks within the school context
such as lowered support, reduced safety, and inadequate teaching have led to diminished
competence, engagement, achievement, and attendance for students. Further, risk in school has
been linked to bullying and overall school-level aggression (Masten, 2014). Reduced safety
within the school and neighborhood have been associated with decreased school attendance,
grades, and increased misbehavior (Hilarski, 2004). Christle, Jolivette, and Nelson (2005) found
that school-level risk factors such as poor suspension practices and lower overall socioeconomic
status may contribute more to poor academic outcomes than individual demographic and
behavioral factors. The percent of students receiving free and reduced lunch, Board of Education
violations, and school-level retention rate also are associated with lowered academic
achievement for youth. When considering social interactions at the school-level, school staff's
negative perceptions of student success and lowered family involvement also increased negative
outcomes for youth. Negative outcomes from school-level risk are further exacerbated by
individual level socioeconomic status, race, family structure, and health (Christle, Jolivette, &
Based on Bronfenbrenner’s Bioecological Theory (1994), risk at any level can be
associated with specific adverse outcomes or more broadly to poor adaption and a variety of
problems for youth. Often, risk factors have been related to each other, and the presence of one
risk factor may reflect an underlying process that is undermining development. Cumulative risk,
or the build-up of risk over time, is a standard method to characterize risk in which the number
of risk factors an individual has experienced in their life is summed (Arrington & Wilson, 2000;
Zimmerman et al., 2013). This inventory of the number of risk factors in an individual's life
provides a simple standard for assessing multiple risk factors. The goal of this approach is to
account for the snowball effects of risk and any relationships between different risks (Sameroff,
2006). Youth who experience numerous risk factors are more likely to have psychological
disorders (Rutter, 1981). Further, risk is increased when the environment the individual is in
increases their vulnerability (Arrington & Wilson, 2000). For example, prior victimization,
substance use, and problems in school have a cumulative effect leading to violent behaviors over
time (Fergus & Zimmerman, 2005). The number of problem behaviors in an individual’s life
increase as the number of risk factors increase and to study a single risk factor might
underestimate the risk exposure the child has experienced (Sameroff, Seifer, Barocas, Zax, &
Greenspan, 1987). The snowball effect of risk suggests that when something negative occurs in
one domain of a child's life, it will also influence function in other domains (Masten, 2014). For
example, if a child experiences a negative event at home, it could alter his or her function at
school and vice versa. Cumulative risk allows a method to assess the full ecological context
1.1.3 Protective Factors
Protective factors are included in models of resilience as factors that mitigate the negative
outcomes of risk and/or promote positive adaption. Protective factors are thought to provide a
buffer from risk for individuals. Khanlou and Wray (2014) suggest that resilience is a process
moving from adversity to positive adaption by way of protective factors intervening following
adversity.
Protective factors can either be considered assets or resources depending on the source of
the factor. Assets are factors which individuals already possess within themselves, such as
intrinsic motivation. Other examples of assets are positive self-esteem, internal locus of control,
religiosity and anger control skills (Bryne & Mazanov, 2001; Griffin, Scheier, Botvin, & Miller,
1999; Wills, Yaeger, & Sandy, 2003) Resources are protective factors that are external to the
individual such as positive relationships or effective academic instruction (Zimmerman et al.,
2013). Other resources include neighborhood safety and adult mentorship (Christle, Jolivette, &
Nelson, 2005; Zimmerman, Bingenheimer, & Notaro, 2002). Masten (2014) also has suggested
that youth who possess assets choose activities that will increase their assets. Therefore, assets
and resources can act in a transactional manner or as multiple layers of protection for youth
(Windle, 2011). For example, youth who possess a strong sense of religiosity are more likely to
be involved in volunteer and mentoring efforts which increase their self-esteem and religiosity
further to bolster their response to risk (Masten, 2001).
Masten (2014) has developed a "short list" of protective factors that have been validated
in multiple research studies. On the individual level, protective assets can include intelligence,
self-control, coping, and self-efficacy. These assets have been suggested as protective because
example, higher intelligence scores can enable people to apply stronger decision making skills to
novel situations and overcome risk (Masten, 2014). On the other hand, self-control promotes
self-regulation which can help youth make critical decisions when faced with risk. Other
protective assets have been suggested for reducing specific negative outcomes. For example,
pro-social beliefs, coping, and anger control skills have been proposed as assets protecting from
violent behavior (Fergus & Zimmerman, 2005).
Masten (2014) also made a short list of family-level resources that are associated with
resilience in youth such as attachment and communication. Parenting factors can also act as
protective resources. Parental involvement and family economic resources can lead to positive
outcomes for youth (Arrington & Wilson, 2000; Rai, et al., 2003). Major frameworks guiding
resilience have indicated that parental warmth is another protective resource for youth (Luthar et
al., 2000). Parental monitoring and family connectedness also have been found as significant
resources to reduce youth substance use (Rai et al., 2003).
At the school-level, protective factors all broadly fall under an effective school system
that teach youth social and emotional skills which can promote adaption in new situations (Blair,
2002; Elias, Zins, Graczyk, & Weissberg, 2003). Schools can also provide youth relationships
with competent adults outside of the family who give youth support and act as role models to
influence motivation. Teachers provide youth with opportunities to master content and build
self-efficacy and self-control providing a link between protective assets and protective resources
(Galassi & Akos, 2007). School leadership and dedicated staff have been found to be protective
on a school-wide basis by implementing and following policies that provide safety and support to
all students (Thapa, Cohen, Guffey, & Higgins-D’Alessandro, 2013). Shumow, Vandell, and
who are in the most disadvantaged areas. Gutman and Midgley (2000) found a similar result in
that the interaction of school and family support provides the best protection for youth.
Overall, positive school experiences can be a key factor in buffering or reducing risk for
youth (Christle et al., 2005; Gilligan, 2000; Masten, 2014; Shumow et al., 1999). According to
Christle and colleagues (2005), supportive school leadership and effective academic instruction
minimize the risk of youth delinquency at low-performing schools. Further, schools that have a
high percentage of low socioeconomic youth who are also high achievers have higher attendance
rates and perceptions of effective academic instruction. Researchers further indicate that youth
who are inherently at risk are protected by positive school experiences from negative outcomes
(Christle et al., 2005).
Khanlou and Wray (2014) conducted a literature review on how individuals facing risk
can benefit from a relationship between individual and environmental protective factors. The
relationship between environment and individual leads to a whole-school approach to resilience
that aims to create partnerships between youth, schools, and community. Khanlou and Wray
(2014) concluded that the best model of resilience is not individual based but instead a collective
process between multiple resources and individual assets. As community resilience provides a
framework for how systems cope and adapt, a combination of factors and environments can
influence youth placed at risk. Community resilience research suggests that models can either be
systems-centered or components-centered in providing support to those at risk (Mutsau & Billiat,
2015). Leveraging the school system to increase resilience, individual protective assets and
school protective resources can lead to a decrease in negative outcomes for at-risk youth (Cowen
et al., 1996). For example, when integrating individual and environmental factors, an
individual’s internal assets to flourish and provides a place to interact with external agencies
leading to more positive outcomes (Zimmerman et al., 2013).
One of the most widely studied school-level resource is school climate (Johnson &
Stevens, 2006). Positive school climate can lead to positive relationships between youth, parents
and teachers as the entire school community is working to support the school vision and
development (Cohen, McCabe, Michelli, & Pickeral, 2009; Zullig, Huebner, & Patton, 2011).
Thus, when youth attend schools with positive climates, they are more likely to have the
resources necessary to demonstrate resilience in the face of risk.
1.2 School Climate
The National School Climate Council (2007) broadly defined school climate as “patterns
of people’s experiences of school life and reflects norms, goals, values, interpersonal
relationships, teaching and learning practices, and organizational structures (p.4).” In other
words, school climate refers to the quality and character of the school life or environment
(Johnson & Stevens, 2006; Yang et al., 2013). Thus, most research has focused on school climate
as a characteristic of the school that provides an organizational indicator of the health of a school
(Koth, Bradshaw, & Leaf, 2008). Although research has defined school climate as a measure of
the school, largely research has relied on aggregated reports of individual-level perceptions of
climate to measure climate as a school factor (Koth, Bradshaw, & Leaf, 2008). Further, school
climate research originated from an intersection in organizational culture and school effects
research and thus, relies heavily on organizational theory to define climate at the school-level
(Anderson, 1982). To better clarify school climate, The National School Climate Council (2007)
further defined a positive and sustainable school climate as one which promotes youth
living and contributing to a shared school vision as well as the operations and physical
environment of the school. Therefore, positive school climate is a multidimensional construct
that is thought to promote positive outcomes for students (Thapa, Cohen, Guffey, &
Higgins-D’Alessandro, 2013).
School climate has the ability to influence a variety of factors for youth. The overall
construct of school climate is related to academic achievement, healthy development, and school
satisfaction. This connection includes varying factors, indicators and processes at the individual,
classroom, and school-level (Brookover et al., 1978; Cohen et al., 2009; Hopson, Schiller, &
Lawson, 2014; Thapa et al., 2013; Yang et al., 2013; Zullig, Huebner, & Patton, 2011). The
relationship between positive development and school climate may be particularly important for
youth who are low-income because they are often the most at risk for academic, emotional and
behavioral problems and schools often lack the financial resources to support them (Alvirdrez &
Weinstein, 1994; Kuperminc, Leadbeater, & Blatt, 2001). Low-income youth are thought to
benefit most from a positive school climate because it creates a safe place for youth to develop
(Kuperminc, Leadbeater, & Blatt, 2001).
Although theory has suggested that school climate is a broad construct, researchers have
also acknowledged that it is multi-dimensional (Zullig, Koopman, Patton & Ubbes, 2010).
Multiple domains of school climate have been suggested to aid in characterizing positive climate.
Given that school climate is largely focused on social relationships and feelings of safety, almost
all models include these two factors. Zullig, Koopman, Patton, and Ubbes, (2010) defined five
main domains of school climate: order, such as classroom organization, safety and discipline;
peers and teachers; clean and inviting school facilities; and school connectedness through
relationships with others.
In a follow-up study, an 8-factor structure of school climate was hypothesized (Zullig et
al., 2010) based on the creation of the survey including 8 distinct sections. This 8-factor structure
included: positive student-teacher relationships, school connectedness, academic support, order
and discipline, physical environment, social environment, perceived favoritism by teachers and
academic satisfaction (Zullig et al., 2010). However, only five of the eight factors were
significantly related to school satisfaction, these five factors were academic support, positive
relationships, school connectedness, order and discipline and academic outcomes. In a literature
review, Thapa, Cohen, Guffey, and Higgins-D’Alessandro (2013) also defined five primary
domains of school climate which are similar to Zullig and colleagues (2010) original model. The
five essential areas established by Thapa and colleagues include safety, relationships, teaching
and learning, physical environment, and school improvement processes; and can be further
defined with more specific elements (Thapa et al., 2013). Thapa and colleagues and Zullig and
colleagues share the domains of safety or order, relationships, academic achievement or teaching
and learning, and physical environment. When comparing empirical research on school climate
to the model outlined by Zullig and colleagues (2010), support for the five domain structure of
school climate becomes apparent.
In the domain of order, safety and discipline; rules and norms, physical safety, respect
and socio-emotional safety are the main components. Schools with less support, structure and
pro-social relationships are more likely to have higher absenteeism and reduced achievement
(Astor, Guerra, & VanAcker, 2010). A breakdown of safety at the school-level is also related to
occur more frequently in large schools (Lleras, 2008). Another part of safety includes the
importance of fair rules and norms. Schools that display consistent rules have lower suspension
rates (Thapa et al., 2013). The National School Safety Center states that school safety such as a
safety plan, systematic incident report system, and clear security policies should be on every
educators' agenda.
The social relationship domain focuses on student-peer relationships, teacher-student
relationships and social support (Zullig, et al., 2010). Positive school climates are associated with
a better foundation in social development and academic learning through a greater attachment to
school (Thapa et al., 2013). School connectedness has been linked to student motivation and
engagement and has been defined as students believing adults in their school care about them as
individuals (Blum et al., 2004; Catalano et al., 2004). Adult support is a major focus of the
relationship domain as adults can provide scaffolding and create an environment in which
students believe the school is invested in their education.
Given that a school's primary function is teaching and providing skills and scaffolding for
youth, the teaching and learning domain is one of the most important concepts and is inherent in
the model (Thapa et al., 2013). Collaborative learning and mutual trust in the school environment
can lead to positive school climate (Kerr et al., 2004). Within this domain, items are focused on
academics including recognition, academic norms, satisfaction classes and quality academic
instruction (Zullig et al., 2010).
The school facilities domain includes conditions of the physical building, resources and
supplies of a school (Zullig et al., 2010). The physical size of a school has been established as
related to school connectedness and safety and in turn can influence academic performance
performance and engagement. The student learning environment also influences students’
perceptions of school and a well-maintained environment with appropriate supplies can largely
influence how youth view their school. However, because schools are located in neighborhoods,
often the physical composition of the school may reflect the neighborhood and community
surrounding it and can reinforce neighborhood issues (Leventhal & Brooks-Gunn, 2004).
The final domain of school connectedness as defined by Zullig and colleagues focuses on
overall feelings about school, feelings of value and attachment to school (Zullig et al., 2010). In
comparison, Thapa and colleagues (2013) defined the fifth domain as school improvement
processes which include the implementation of programs within schools. The school
improvement process domain is based on ecological systems theory. Using schools in Chicago,
Bryk, Sebring, Allensworth, Luppescu, and Easton (2010) found that multiple ecological systems
interact to support school improvement efforts, such as strong relationships between parents,
community and school. Throughout the multiple domains defined, parental involvement is not
included as its own domain though research has suggested that parental involvement can
positively impact student outcomes (Zullig et al., 2010). Most research however includes
parental involvement as a separate measure from school climate when it could fit within the
model of school climate itself. Based on an ecological model, it is important that parental
involvement be considered as a part of school climate which attempts to provide overlap of the
different systems. Research from the School Survey on Crime and Safety found that parental
involvement and school climate both reduce the levels of violence in schools. When considering
just schools who utilize a parental involvement program, the effects are greater (Lesneskie &
Block, 2017). Further, when schools are the unit of study rather than individuals, researchers
outcomes (Brookmeyer et al., 2006). Thus, a case could be made that the final domain of school
climate could be defined as parental involvement.
The current study first investigated if school climate follows the 5-factor model outlined
by Zullig and colleagues (2010) and if those constructs created a unified measure of school
climate. This model was chosen as it provides a theoretical basis which can be paired with the
current accountability system used in the State where the population is located. This model
tested first if the five domains are found and if they loaded onto a higher-order factor of school
climate making school climate both multidimensional and one unified construct. Because school
climate is a broadly defined term that can incorporate multiple individuals, levels and processes
within a school it may be beneficial to think of school climate as separate domains operating at
the school-level. Given that school climate research largely emerged from organizational
sciences, studies have measured school climate using aggregated reports of individual
perceptions to create a school-level view of climate (Koth, Bradshaw, & Leaf, 2008) and at the
individual level (Brookmeyer et al., 2006). When considering school climate a characteristic of
the school and utilizing school-level analyses, it provides an indicator of organizational health
(Koth, Bradshaw & Leaf, 2008). In comparison, when using individual level data, it provides an
indicator of students’ perceptions of the organization (Brookmeyer et al., 2006). By thinking of
school climate as multiple domains it becomes possible to understand if some domains influence
students more than others and how the domains load onto one large factor of school climate.
Further, it has been suggested that sustained positive school climate over time will
increase youth’s engagement with school and will lead to more positive outcomes as children
because researchers have continually stressed the need for understanding sustained school
climate over time but have not tested how consistent it is over time.
1.3 Developmental Perspective
When considering the different parts of youths' lives, school environments have the
potential to affect development in a variety of ways. Schools can play a significant role in youth
becoming competent adults and largely influence every aspect of development including social,
emotional and cognitive intelligence because schools are one of the primary sources where youth
learn social scaffolding as well as core competencies. Therefore, schools offer a place for youth
to develop and gain the skills necessary to prosper.
The elementary school-level has been found specifically to influence later development
(Silva et al., 2015). Academically effective preschool followed by an effective elementary school
increases positive youth development by providing youth with essential skills. At the primary
school-level, the quality of teaching influences children's social and intellectual development.
This effect is -greater for youth eligible for free and reduced meals (Silva et al., 2015). Further,
longitudinal studies have found that programs and positive interactions during the elementary
school years will reduce problems in middle school and that there are multidimensional benefits
for fifth graders through eighteen years old (Hawkins et al., 1999). During the elementary school
years, children learn behaviors from socializing with family, adults, and peers. However, as
youth age, the influence of peers increases over that of parents or teachers (Catalano et al., 2002).
If the individuals a child feels bonded to display pro-social norms then the child may avoid
problem behaviors and have positive development (Catalano et al., 2002).
As students move from elementary to middle school, large changes can be seen in their
did not change across elementary school years but did decrease once they transitioned to middle
school. This trend was also seen for achievement values and competence beliefs. The transition
from elementary to middle school requires youth to change their orientation regarding rules and
procedures, and a strong foundation of competence and confidence in elementary school will
provide an easier transition for students into the turbulent time of middle school (Akos, 2002).
To this end, the elementary school years may be particularly important to provide the foundation
for which positive youth development can continue.
Research on resilience has suggested that for one to be resilient, one must have positive
outcomes following risk (Masten, 2014). A major area of focus in resilience research is on
competence cascades. According to competence cascades, when youth are competent in one
area, they tend to be competent in other areas, and this will continue over time (Heckman, 2006).
However, this connection is not automatic and often requires support from others. Thus, if
schools help youth develop competence in social, emotional and cognitive intelligence, youth
will likely gain competence in other aspects of life over time with continued support (Masten &
Cicchetti, 2010).
Positive school climate could provide a different lens to understand resilience in schools
because school climate may buffer the effects of risk for students. Positive school climate for
elementary students has proven to lead to positive outcomes for youth both academically and
socially. Further, positive school climate in elementary school has also been shown to increase
positive outcomes during middle school. Battistich, Schaps and Wilson (2004) found that when
rural, white youth experienced a positive climate in elementary school, they showed higher
academic performance in middle school. These results confirm that positive school climate
decline. This reduction in student perceptions of school climate has been associated with
increases in behavioral problems (Wang & Dishion, 2012).
When analyzing the benefits of positive school climate for at-risk youth, prior research
has mostly focused on both elementary school and middle school students. However, no research
to date has focused on sustained school climate as a protective factor for at-risk elementary
school students. During elementary school, students are gaining skills that are critical for
competence across the lifespan. Thus, the current study aims to provide a clearer understanding
of how sustained school climate can protect school-age youth from cumulative, predictive risk
2. THE CURRENT STUDY
In the protective model of resilience, resources and assets act as moderators of the effects
of individual and environmental risk on individual outcomes (Fergus & Zimmerman, 2005). An
ecological model of positive development is often used to understand the relationships between
individual risk and school protective factors on academic outcomes (Constantine, Benard, &
Diaz, 1999; Gilligan, 2000; Shumow, Vandell, & Posner, 1999). Theoretically, school climate as
a resource fits within the protective model of resilience as a buffer of risk on reduced academic
achievement, but empirically it has not been studied within this model. When considering school
climate as a measurement of the school environment, research has found that school climate
buffered the relationship between individual poverty and negative behavior in a primarily white
sample of middle and high school students (Hopson & Lee, 2011). However, they did not find
that school climate buffered the relationship between individual poverty and grades due to the
majority of the sample having high grades regardless of risk.
Thus, where there was negative outcomes, school climate did protect youth, however
when achievement was already high, there wasn’t anything to protect youth from. Research on
school climate has suggested that positive climate is an integral protective factor for youth that
provides a measure of the school organization (Griffith, 1999; Hopson & Lee, 2011). When
focusing on elementary students, school climate has been found to provide social order and
positive action leading to increased academic performance and satisfaction (Griffith, 1999).
Sustained school climate is an important factor in positive youth development (National
School Climate Council, 2007; Tharpa et al., 2013). Sustained school climate has been found to
lead to positive youth development and the skills necessary for students to lead productive and
longitudinal study found that increasing connectedness and climate in elementary school leads to
better adjustment in middle school for fifth graders (Battistich, Schaps, & Wilson, 2004). By
using a longitudinal design, it is possible to assess sustained school climate across years
(Anderson, 1982). Although many studies have suggested a positive relationship between
sustained school climate and positive outcomes, there have not been any longitudinal studies that
examine how school climate as a school characteristic changes over time. The dearth becomes
larger when considering elementary school climate, specifically.
The goal of this dissertation is to assess the effects of sustained school climate as an
organizational resource for the effects of individual and school-level risk on individual academic
achievement over time. The study uses the protective model of resilience and incorporates the
multidimensionality of school climate to understand how school-level climate can protect
students from individual and school-level risk on reduced academic achievement in elementary
school. When considering both the resilience and the school climate literature, it becomes
apparent that for youth placed at risk, sustained school climate may protect youth from the
effects of risk on reduced academic achievement (Battistich, Schaps, & Wilson, 2014; Hopson &
Lee, 2011). When youth are placed at risk, to overcome negative outcomes, youth will need
support from the institutions and organizations around them. Because sustained school climate
provides a measurement of the organizational environment, it makes sense that a positive climate
would reduce negative outcomes for youth.
2.1 Research Questions
To fully understand how school climate is protective for youth and how school climate
may vary across time three main research questions are addressed:
Studies of school climate have defined school climate as multiple domains which feed
into the larger construct of school climate. Thus, the first step of analyses was to conduct
confirmatory factor analysis to assess if school climate was best defined in the current study as
one factor or multiple domains by respondent. The second step in the analyses was to test a
higher-order factor structure where the best fitting model domains were then loaded onto a
higher-order factor of climate. In order to assess the domains, the items were loaded onto three
domains for students and five domains for parents and personnel. The three domains for students
are expected to be safety, teaching & learning and relationships. The five factors for parents and
personnel are expected to be teaching & learning, safety, relationships, physical environment and
parental involvement or parental connectedness. The domains hypothesized were based on the
domains previously found by Zullig and colleagues (2010). However, the student survey
included fewer domains because there were fewer items which could not be loaded onto the
parental involvement or physical environment domains. The survey also focused on parental
involvement for personnel and parents rather than school connectedness, so parental involvement
will be used as a measure of parental connectedness to the school. Testing for the higher-order
factor helped clarify if items load onto domains that fit into a unified construct of school climate
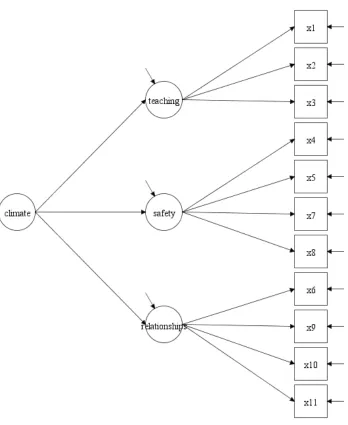
based on the fit of the model in comparison to the lower order model. Three models were tested
and assessed for fit. The first model tested included 3 factors for students and 5 factors for
personnel and parents. All of these factors were expected to load onto a higher order factor of
school climate. The final models run were exploratory in nature to test if other factor models
were a better fit. Once all models have been run they were compared using fit indices and item
standardized factor loadings. Results of the models were used to inform subsequent analyses
Studies have suggested that sustained school climate is beneficial for youth, but few have
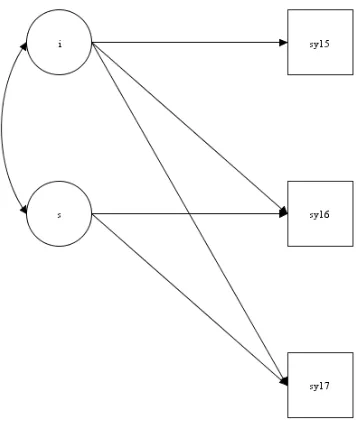
studied it longitudinally (Cohen, Pickeral, & McCloskey, 2009). Growth curve analysis will be
used to assess if there is systematic linear change over time for aggregated school climate as
reported by students, parents and personnel. This model will assess if schools can be
characterized by how their climate is changing over time.In order to conduct linear growth curve
analyses, composite scores of school climate will be created based on the prior models. Linear
growth curve analysis tests how climate changes over time and if the change is systematic. The
results of the growth curve analysis will inform how climate is included in research question 2.
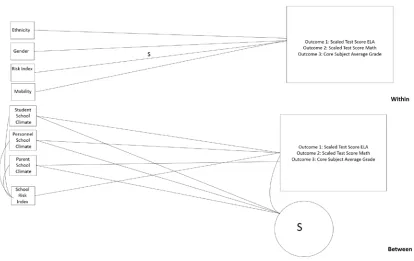
Research Question 2: Does school-level climate act as a protective factor in the relationship
between individual risk and academic achievement for elementary students?
The current study hypothesizes that positive school climate will act as a protective factor
on the effects of individual and school-level risk indexes on academic achievement. The model
adds to the literature because no studies have looked at school climate as a moderator of risk in
elementary students’ achievement. The model will assess a multi-level, longitudinal protective
model of resilience by including an individual level risk index, school-level risk index and
school climate. The method in which school climate is assessed will be based on the results from
the first research question. By including individual level risk and individual outcomes with
school-level protective factors it becomes possible to understand how the multiple levels can
interact to protect youth.
To assess research question two, four different models were assessed. The first two
models assessed the compensatory model of resilience in which the direct relationship of risk and
climate on academic achievement. The second two models will assess the protective models of
achievement. It is hypothesized that perceptions of school climate by parent, personnel and
student will protect youth from individual risk on academic achievement over time both directly
and by buffering the relationship between risk and lowered achievement.
3. METHODOLOGY
3.1 Sample
The sample consisted of 3,031 2nd grade students during the 2014 school year enrolled in
52 elementary schools in one urban school district that were followed to 2017. For risk variables,
the data were collected from the students 2nd grade year (2014), the outcome variables are from
students 5th grade year (2017) and the control variables of previous test scores and grades are
from the students 3rd grade year (2015) due to it being the first year students are assessed on the
state exam. In 2014, the total number of students enrolled in the school district was 50,131. Table
1 shows the demographic information for the sample during 2014. The current study conducted
secondary data analyses of anonymous survey data and de-identified data from the school
district.
The student level data were requested and de-identified from the school district. Survey
data were collected anonymously and provided for three years. The school climate variables
were derived from the state's survey which was designed to gather information on school climate
and safety from teachers, parents, and students. Participants completed the state’s online survey
anonymously, and a passive consent process was utilized. Thus, perception of school climate was
aggregated to the school-level from anonymous respondent data.
Table 1. Demographics of Sample in 2014
Demographics Count of Students Enrolled Percent of Students Enrolled
Total Sample 3,031
Gender
Male 1,573 51.9% Ethnicity
Black 2,120 69.9%
All Other Races 911 30.1%
3.2 Measures
Student-Level Variables. Student Level RiskIndex was created from information
from students’ 2nd grade enrollment in 2014 to account for the snowball effects of risk (Sameroff,
2006). The variables used to create the index were housed by the school district’s student
information system. The Student Risk Index ranged from zero to five and variables will be
dummy-coded as zero or one. The Student Risk Index includes free and reduced lunch status,
homelessness status, frequency of behavior incidents, suspension days and attendance rate.
Although this exact risk index has not previously been used, similar indexes which utilize status
and behavioral risk have been used (Finn, 1993; McCann & Austin, 1988). The items included
in the risk index were guided by theory in composite risk and by what the school district was
using to define students at risk of failure. Free and reduced lunch status (FRL) was included as
a measure of poverty for students. The variable was coded as not eligible (0) or eligible (1) for
free and reduced lunch. To be eligible for free or reduced lunch families must be under a
particular income level per household size, for example an income level of $26,000 for a house
of four, or already receiving supplemental nutrition assistance program benefits (USDA, 2016).
Homelessness status was also included as a measure of poverty and coded as a homeless student
(1) or non-homeless student (0). Students are marked as homeless if they have been identified as
living in a shelter, hospital or foster home. Frequency of behavior incidents during the school
year was included as a continuous variable and defined as a count of behavior incidents which
incident is any incident which required intervention from a teacher or staff member. The school
district provides a handbook of actions which are considered behavioral events to all parents,
staff, and students. The frequency of behavior incidents was coded having any behavior incidents
(1) or having no behavior incidents (0). Suspension rate was included to examine the length of
suspensions in comparison to membership days resulting in a measure of days suspended per
school year. The suspension rate was coded as previously suspended (1) or never suspended (0).
The suspension rate included both in school and out of school suspension but did not include
expulsion or alternative school placement. Although similar to the frequency of behavior
incidents, the suspension rate is calculated differently as an individual could be involved in a
behavior incident and not receive a resolution of suspension. Attendance Rate was included in
which the number of days' present was divided by school membership days. The number of days
present included partial days. If a student received out of school suspension, it was also counted
against them in the attendance rate. The membership days per school year for each student totals
to 180 days and includes active school days. The attendance rate was coded as low or high
attendance based on 10% absence. If a student had an attendance rate greater than 90% they were
coded as high attendance (0). If a student had an attendance rate less than or equal to 90% they
were coded as low attendance (1).
Ethnicity was included as a covariate and coded as Black (1) and all other races (0)
based on the demographic information of the sample being primarily Black. Gender
(female/male) was also included as a covariate. Mobility was included as a covariate if an
individual moved schools at any point during the 2014 through 2017 school years. These
covariates were included to assess if achievement levels differed between races, gender or
School-Level Variables. A School Risk Index were created from aggregates of
student-level data housed in the school district’s student information system from the 2014 school year.
The risk index was created based on previous research suggesting the variables individually lead
schools to be defined as having risk however the current risk index had not been used. This index
ranges from zero to five and was defined by prior research on school risk. Free and Reduced
Lunch Eligible Percent was aggregated to the percent of students’ eligible for free and reduced
lunch. Using the National Center of Educational Statistics definition of risk, schools with 75% or
greater FRL were coded as high FRL (1) and those under 75% were coded as low FRL (0).
Number of Homeless Students was aggregated to the distinct count of enrolled students who
were homeless. The average was used as a cut off to create low (0) and high (1) homelessness.
The Number of Violent Incidents was included as a measure of dangerous behavior. According
to the Unsafe School Choice Option, schools are considered unsafe if there is more than one
violent incident in a school year. Violent incidents include robbery, battery, kidnapping, rape and
manslaughter. The number of violent incidents were coded as one or more violent incident (1) or
no violent incidents (0). Suspension Rate was included as a measure of out of school and in
school suspensions by enrollment. The suspension rate was calculated by the number of
suspension days total by school divided by total enrollment days. The mean was used to create a
variable of high or low suspensions. Thus, schools were coded as high suspensions (1) if they are
greater than or equal to .25 and low suspensions if they are less than .25. Attendance Rate by
school was included and defined as the percent of students missing greater than 10% of the
school year as low attendance (1) and the percent of students missing less than 10% of the school
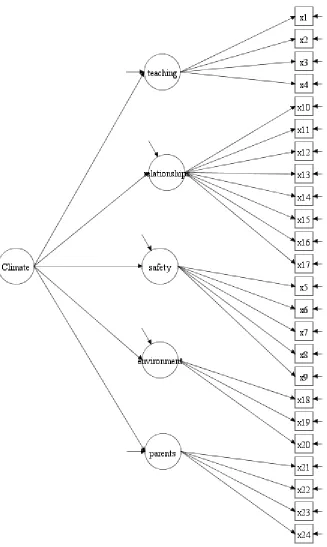
School-Level Climate. The protective factor in the study was the school-level variable of
school climate. School climate was measured by parent, teacher, and student surveys across three
years.The State collected the survey information and then distributed results to school districts.
The survey is given yearly from October to March by school administrators on school computers
and is anonymous. The school climate survey was developed by the state in conjunction with
researchers to assess positive climate schools for accountability. The domains included in the
survey were defined by the state and were aligned to the domains defined by Zullig and
colleagues (2010). The elementary student school survey consists of eleven items; the teacher
survey consists of thirty-one items, and the parent survey consists of twenty-four items. The
student survey can be broken into the domains of teaching & learning, relationships, and safety.
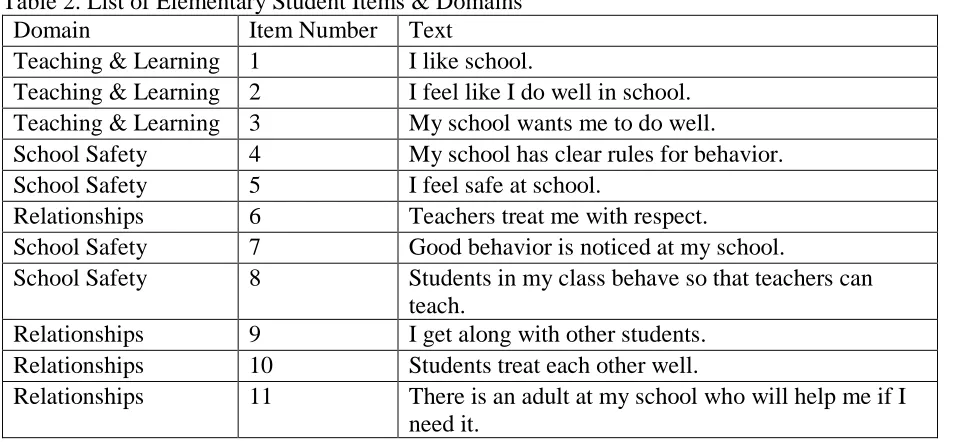
[image:40.612.71.552.382.603.2]The list of which items group into each domains can be found in Table 2.
Table 2. List of Elementary Student Items & Domains
Domain Item Number Text
Teaching & Learning 1 I like school.
Teaching & Learning 2 I feel like I do well in school. Teaching & Learning 3 My school wants me to do well.
School Safety 4 My school has clear rules for behavior.
School Safety 5 I feel safe at school.
Relationships 6 Teachers treat me with respect.
School Safety 7 Good behavior is noticed at my school.
School Safety 8 Students in my class behave so that teachers can
teach.
Relationships 9 I get along with other students.
Relationships 10 Students treat each other well.
Relationships 11 There is an adult at my school who will help me if I
need it.
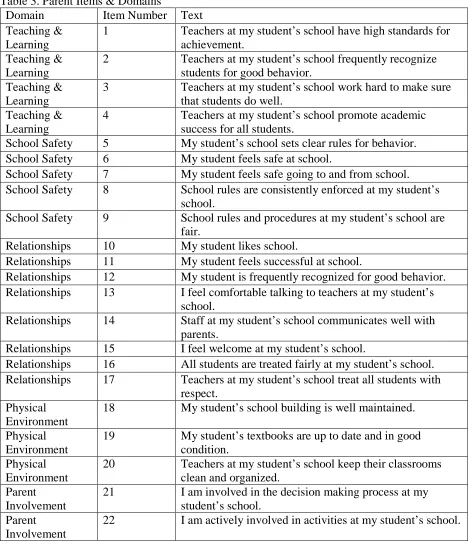
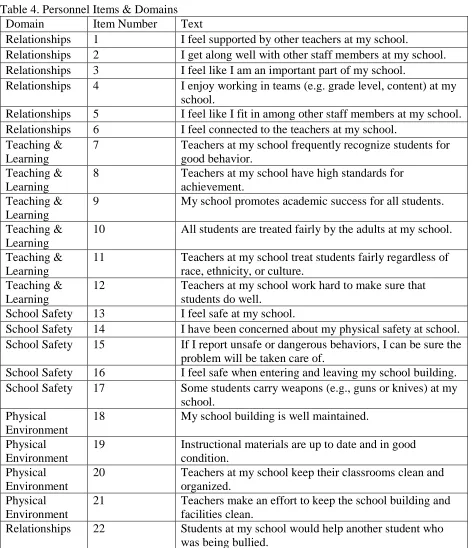
The parent and personnel surveys include similar questions. The parent and teacher
surveys can be broken into the domains of relationships, safety, teaching and learning, physical
parent survey can be found in Table 3 and the list of which items load onto which domains for
the personnel survey can be found in Table 4. Survey questions are also located in the
[image:41.612.72.547.161.705.2]appendices.
Table 3. Parent Items & Domains
Domain Item Number Text
Teaching & Learning
1 Teachers at my student’s school have high standards for achievement.
Teaching & Learning
2 Teachers at my student’s school frequently recognize students for good behavior.
Teaching & Learning
3 Teachers at my student’s school work hard to make sure that students do well.
Teaching & Learning
4 Teachers at my student’s school promote academic
success for all students.
School Safety 5 My student’s school sets clear rules for behavior.
School Safety 6 My student feels safe at school.
School Safety 7 My student feels safe going to and from school. School Safety 8 School rules are consistently enforced at my student’s
school.
School Safety 9 School rules and procedures at my student’s school are fair.
Relationships 10 My student likes school.
Relationships 11 My student feels successful at school.
Relationships 12 My student is frequently recognized for good behavior. Relationships 13 I feel comfortable talking to teachers at my student’s
school.
Relationships 14 Staff at my student’s school communicates well with parents.
Relationships 15 I feel welcome at my student’s school.
Relationships 16 All students are treated fairly at my student’s school. Relationships 17 Teachers at my student’s school treat all students with
respect. Physical
Environment
18 My student’s school building is well maintained.
Physical Environment
19 My student’s textbooks are up to date and in good condition.
Physical Environment
20 Teachers at my student’s school keep their classrooms clean and organized.
Parent Involvement
21 I am involved in the decision making process at my student’s school.
Parent Involvement