JOURNAL OFCLINICALMICROBIOLOGY, July 2003, p. 2900–2907 Vol. 41, No. 7 0095-1137/03/$08.00⫹0 DOI: 10.1128/JCM.41.7.2900–2907.2003
Copyright © 2003, American Society for Microbiology. All Rights Reserved.
Sources and Magnitude of Intralaboratory Variability in a
Sequence-Based Genotypic Assay for Human
Immunodeficiency Virus Type 1
Drug Resistance
R. A. Galli, B. Sattha, B. Wynhoven, M. V. O’Shaughnessy, and P. R. Harrigan*
BC Centre for Excellence in HIV/AIDS, Vancouver, British Columbia, Canada V6Z 1Y6Received 25 September 2002/Returned for modification 4 March 2003/Accepted 28 March 2003
We assessed the intralaboratory reproducibility of a system for sequencing human immunodeficiency virus type 1 (HIV-1) protease (PR) and reverse transcriptase (RT) by using replicate subanalyses of 46 plasma samples collected from HIV-1-infected, antiretroviral-experienced patients in order to determine the relative contributions of the different procedural steps to final sequence variability. Complete sequence concordance between duplicates of each sample was 99.4%. Complete and partial mismatches occurred scattered throughout the PR-RT genome segment at >300 positions. Approximately 75% of the discordances involved mixtures, some of which appeared at key resistance sites. Most differences were the result of the first-round RT-PCR proce-dure. Inter-rater concordance for sequence analysis and assembly was >99.9%. There was no observed correlation between the number or frequency of mismatches and plasma viral loads. A separate longitudinal analysis of a single routine control sample sequenced 103 times over 9 months consistently gave highly reproducible sequences (median percentage of nucleotide discordances, 0.04%; range, 0 to 0.2%). Finally, sequence data from 168 sequential samples collected from 22 patients with long-term, predominantly wild type HIV showed that intrapatient nucleotide concordance with individual index sequences ranged from 96.5 to 100%. Together, these results confirm that sequence-based genotyping can be a precise and reliable tool for monitoring HIV drug resistance, and they suggest that efforts to reduce variability should focus on the first RT-PCR step. Consequently, the data suggest that the composition of external quality assessment panels should be based on clinical HIV isolates rather than DNA clones.
Human immunodeficiency virus type 1 (HIV-1) mutations associated with resistance to currently available antiretroviral drugs occur predominantly in the reverse transcriptase (RT) and protease (PR) regions of the viral genome. Drug-resistant variants are considered one of the most important contributors to antiretroviral drug failure, particularly in treatment-experi-enced patients. Consequently, commercially available as well as “in-house” molecular sequencing methods have been devel-oped to determine the presence of drug-resistant HIV in blood samples from individual patients. Numerous retrospective and prospective clinical trials (1, 3, 5, 8, 12, 22, 23) have evaluated the potential clinical utility of resistance testing, and in recent years, expert panels have recommended its use to help guide the management of antiretroviral therapy in certain clinical situations (2, 13).
Despite these advances, there are currently no specific stan-dards for either genotypic or phenotypic testing for HIV drug resistance. Consequently, aspects such as technical laboratory expertise, assay performance characteristics and quality con-trol, diversity of patient populations, and drug resistance in-terpretation algorithms may produce variability of resistance testing results. Previous studies (16, 17) have shown a high degree of interlaboratory differences in results of sequence-based resistance testing methods mainly through the use of
predefined mixtures of HIV DNA clones. Other studies have shown that interlaboratory concordance can be quite high (19, 20), particularly when laboratories with high levels of sequenc-ing experience are ussequenc-ing similar methods. Studies comparsequenc-ing different commercial and in-house sequencing methods for resistance testing in clinical samples have found that concor-dance across methods at key mutation sites can range from 80 to 99% (6, 7, 9). Since genotypic tests are relatively complex to perform, careful attention to performance consistency and quality control are necessary to ensure reliable results (6, 7, 9, 16, 17). Routine use of quality measures to assess PCR con-tamination, instrument performance, and raw sequence data can minimize methodological variability (10).
With the increasing use of resistance testing in clinical prac-tice, the reproducibility of detection of drug resistance muta-tions is critical for accurate assessment of antiretroviral drug resistance in the individual patient. In the present study, we determined the intralaboratory reproducibility and inter-rater concordance of an in-house sequencing method for HIV drug resistance testing with plasma samples obtained from antiret-roviral-experienced HIV patients. Furthermore, we attempted to identify the methodological source of the greatest variation in sequencing results. The consistency of the whole genotyping process was also assessed by using multiple replicates of a single positive control. Finally, as a function of the reproduc-ibility of the in-house resistance testing algorithm, we assessed the long-term genetic stability of virus populations in sequen-tial plasma samples collected from a cohort of 22 HIV patients with detectable levels of predominantly wild type virus.
* Corresponding author. Mailing address: BC Centre for Excellence in HIV/AIDS, 613-1081 Burrard St., Vancouver, British Columbia, Canada V6Z 1Y6. Phone: (604) 806-8281. Fax: (604) 806-8464. E-mail: [email protected].
2900
on May 15, 2020 by guest
http://jcm.asm.org/
MATERIALS AND METHODS
Patients and samples.A panel of 46 cryopreserved HIV-positive plasma samples from 39 individuals, selected as a representative cohort of antiretroviral-experienced patients residing in British Columbia (n⫽29 patients) and the rest of Canada (n⫽10) for whom consecutive requests for routine drug resistance testing had been made, were tested. Plasma viral load data (Roche Amplicor HIV-1 Monitor, version 1.5) were available only for patients from British Co-lumbia (range, 1.5⫻103
to 1.0⫻106
HIV RNA copies/ml).
Additionally, sequence data determined by four different staff members from 103 replicates of a single plasma draw, used as a positive control over 9 months, were analyzed for variability.
To assess the biological stability of HIV sequence in plasma samples collected longitudinally, 168 PR and RT sequences were obtained from 22 patients en-rolled in the British Columbia HIV Drug Treatment Program. These patients each provided a minimum of four sequential samples over an analysis period ranging from 6 to 55 months. All samples had detectable plasma viral loads (⬎500 HIV RNA copies/ml) and no detectable key resistance-associated muta-tions throughout the analysis. No attempt was made to control for therapy regimen or adherence.
HIV RNA extraction.RNA was extracted from 220l of single stored aliquots of plasma by using the QIAamp 96 Viral RNA Extraction kit (Qiagen, Valencia, Calif.) on a Qiagen BioRobot 9600 according to the manufacturer’s instructions. For the purposes of this study, only a single RNA extract for each sample was used for replicate amplification. The potential impact of plasma HIV-1 RNA extraction on reproducibility, particularly in samples with low plasma HIV-1 RNA levels, was therefore not assessed. At plasma viral load levels of 100 to 1,000 HIV RNA copies/ml, the average amplification and sequencing success rate of our assay is 80%. At levels above 1,000 copies/ml, the success rate is
⬎95%. In our study, the lowest plasma viral load of any sample was 1,500 copies/ml.
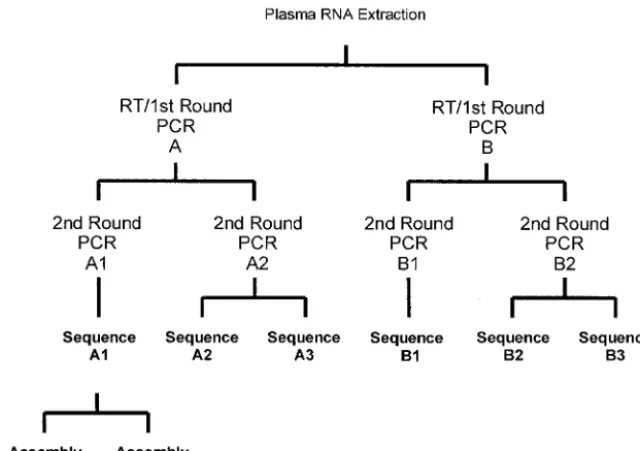
RT-PCR.PR and RT cDNAs were generated from RNA extracts with Expand Reverse Transcriptase (Expand High Fidelity PCR system; Roche Diagnostics GmbH, Mannheim, Germany) on GeneAmp PCR system 9600 and 9700 ther-mocyclers. First-round RT-PCR yielded a 2.2-kb product of the HIV-1 polymer-ase gene encompassing the entire PR region and most of the RT coding regions. This first-round product was then amplified with nested PCR primers in a second round to obtain the1.8-kb PCR products used in the study. The replicate testing algorithm used for the 46 cross-sectional samples is shown in Fig. 1. RT-PCR and first-round PCR were performed in duplicate (identified as A and B). Nested PCR was then performed in duplicate (identified as A1, A2, B1, and B2) from each first-round RT-PCR. The yield and purity of the PCR products were evaluated by agarose gel electrophoresis standardized to a DNA ladder with
known molecular sizes. Similar extraction, PCR, and sequencing procedures were used for the 103 replicate control and 168 longitudinal samples.
Automated sequencing.Direct population-based dideoxynucleotide cycle se-quencing was performed on unpurified second-round PCR products (A1 and B1) and also in duplicate on samples A2 and B2 as indicated (Fig. 1) by using a BigDye Terminator cycle sequencing ready reaction kit with AmpliTaq DNA polymerase FS (Applied Biosystems Inc. [ABI], Foster City, Calif.). The products were subsequently purified by sodium acetate-ethanol precipitation. The purified sequencing products were denatured in formamide prior to being loaded on an ABI Prism 3700 capillary DNA sequencer to create bidirectional overlapping sequences. Electropherograms were created with DNA sequencing analysis soft-ware (version 3.6; ABI), and the sequences were assembled with Sequencher software (version 3.1; Genecodes, Ann Arbor, Mich.). Automatic flagging of heterozygous positions (positions with peaks indicative of at least two bases) was set for minor peaks that were equivalent to 40% of the major peak. The elec-tropherograms were examined manually to confirm the sequence calls made by the software and to determine heterozygous positions with minor peaks that were
⬍40% of the major peak. Forward and reverse sequences were available for all areas evaluated, and no calls were made for sequence data from only one strand.
Sequence data analysis.In the cross-sectional study, final sequences for all replicate samples were compared to each other for complete and partial nucle-otide discordances. Overall amino acid differences resulting from nuclenucle-otide discordance between the replicates and variance at key resistance mutation sites were also assessed to determine the source of greatest variability. Nucleotide mismatches were analyzed for statistical significance according to distribution and frequency patterns, as well as for trends in nucleotide bases in 5⬘and 3⬘ directions from the mismatches. To assess inter-rater concordance, sequences from all A1 samples (Fig. 1) were reanalyzed using normal procedures by a different technical staff member of the same laboratory. Neighbor-joining trees were created by phylogeny using Clustal X, version 1.8 (21), to detect potential contamination with other samples.
For the longitudinal samples, intrapatient HIV sequence variability was as-sessed by comparing full and partial nucleotide changes in sequential samples with the index sequence determined from the first sample for each patient. For control sample replicates, sequences determined and analyzed over a 9-month period were compared to the initial sequence of the sample.
Definitions.A partial nucleotide discordance was considered to be present when one sequence position had a nucleotide mixture and its replicate had one of the mixture’s components. For example, one sequence had an R (the Inter-national Union of Biochemistry and Molecular Biology code for A plus G), and its replicate had either an A or a G. A complete nucleotide discordance was considered to be present when a sequence and its replicate had different
nonam-FIG. 1. Replicate testing algorithm. This algorithm depicts the replicate testing of RNA extracts from the 46 HIV-positive cross-sectional samples.
on May 15, 2020 by guest
http://jcm.asm.org/
[image:2.603.137.457.71.296.2]biguous nucleotides at the same position. For example, one sequence had a C and its replicate had a T. Mutations were defined as amino acid differences between a patient sequence and the HIV-1 HXB2R sequence (accession no. AF033819; Los Alamos National Laboratory, Los Alamos, N.Mex.). Mutations were considered to be present if they were detected as part of a mixture (together with a wild-type allele) or in pure form. The following codons were considered “key” drug resistance-associated sites in genotypic comparisons: PR codons 30, 32, 48, 50, 82, 84, and 90; RT codons 41, 62, 65, 67, 69, 70, 74, 75, 77, 103, 106, 108, 115, 116, 151, 181, 184, 188, 190, 210, 215, 219, and 236 (11).
RESULTS
Sample characteristics: cross-sectional study.A total of 276
replicate sequences were analyzed (46⫻6). Neighbor-joining
trees of all 46 samples from the two main arms of PCR (A1 and B1 [Fig. 1]) based on the pairwise uncorrected distances be-tween the sequences confirmed the absence of cross-contami-nation or sample mix-up. The paired sequences obtained for each isolate were more closely related to one another than to the sequences of any other isolate (data not shown). Moreover, as expected, samples from the same patients clustered together (data not shown). Plasma viral load levels available for 35
samples ranged from 1.5 ⫻ 103to 1.0 ⫻ 106 copies per ml.
Forty-five of the 46 sequences were identified as subtype B, while one was identified as a circulating recombinant form (CRF02_AG prototype; Los Alamos National Laboratory).
Nucleotide differences.A total of 68,862 nucleotides (1,497
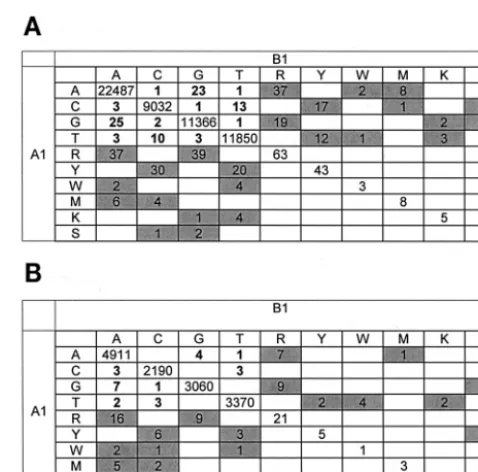
bases each from 46 sequences) were analyzed from indepen-dent RT-PCR amplifications A1 and B1 (Table 1 and Fig. 2). Four hundred forty nucleic acid discordances were identified between first-round PCR products A1 and B1 (99.4% concor-dance). The mismatches were scattered throughout the
ge-nome at ⬎300 different positions. Only two nucleotide
posi-tions (PR codon 79 and RT codon 271) had as many as four mismatches in the 46 samples. Neither of these codons is known to be associated with drug resistance. Concordance increased to 99.8% by using the same first-round PCR prod-ucts but different second-round PCR prodprod-ucts (A1 versus A2 and B1 versus B2) and to 99.9% by comparing the same first-and second-round PCR products (A2 versus A3 first-and B2 versus B3). The total number of nucleotide differences after second-round PCR (arm A, 127; arm B, 120) was significantly lower
than that after first-round PCR (440 differences) (P⬍0.001).
Seventy-five percent of the nucleotide differences between arms A and B of the PCR were partial differences resulting
from different calling of mixtures of bases at a single position (such as a call of A for one sequence and R for another; see “Definitions” above). More ambiguous base calls were ob-served in A1 sequences (from arm A) than in B1 sequences (from arm B) for both RT and PR (Fig. 2), despite the fact that these were duplicates. For the same first- and second- round PCR replicates, partial discordances accounted for 96.7% (arm A) and 98% (arm B) of the total nucleotide differences. Mul-tiple mismatches at drug resistance-associated codons oc-curred at only three PR codons and one RT codon,
[image:3.603.42.544.80.183.2]respec-FIG. 2. Nucleotide sequence concordances and discordances. The matrices show the numbers of nucleotide sequence concordances and discordances between the two main arms (A1 and B1) for RT (A) and PR (B). Numbers of complete matches are shown along the diagonal. Numbers of complete discordances are boldfaced, and numbers of partial discordances are shaded. Blank cells indicate zero. Interna-tional Union of Biochemistry and Molecular Biology ambiguity codes are as follows: R, A plus G; Y, C plus T; W, A plus T; M, A plus C; K, G plus T; S, G plus C. Data for sequence calls B, H, V, D, or N are not shown.
TABLE 1. Reproducibility of sequencing of replicate PCR products from single RNA extracts from 46 samples
Sequence comparison of PCR productsa
Nucleic acid resultsb Amino acid resultsb
Concordance
(%)c Total no. of discordances
No. (%) of partial discordances
Concordance
(%)d Total no. of discordances
No. (%) of partial discordances
A1 vs B1 99.4 440 330 (75) 99.3 170 130 (76.4)
A1 vs A2 99.8 127 125 (98.4) 99.8 51 50 (98)
B1 vs B2 99.8 120 118 (98.3) 99.8 46 43 (93.5)
A2 vs A3 99.9 92 89 (96.7) 99.8 45 39 (86.7)
B2 vs B3 99.9 100 98 (98) 99.8 56 56 (100)
a
Identified according to Fig. 1. The total numbers of nucleotides and amino acids analyzed in each arm (A1, A2, A3, B1, B2, and B3) were 68,862 and 22,954, respectively.
b
Partial and complete discordances are defined in Materials and Methods. c
Inter-rater concordance,⬎99.9%. d
Inter-rater concordance, 99.9%.
2902 GALLI ET AL. J. CLIN. MICROBIOL.
on May 15, 2020 by guest
http://jcm.asm.org/
[image:3.603.302.541.397.633.2]FIG. 3. Relative frequency of sequence base mismatches and distribution of flanking nucleotides in 46 cross-sectional samples. (A) Distribution of complete and partial base pair mismatches expressed as percentages of the total mismatches within the cohort (n⫽440). Nucleotide base pair mismatches A-G, A-R, and G-R showed significantly higher prevalences in the 46 samples than other mismatches (P⬍0.001). (B) Relative proportion of bases immediately preceding the mismatches in the 5⬘direction compared to the overall proportion of these bases within the cohort. N, ambiguous nucleotides.P⬍0.001 for A;P⫽0.05 for C;P⬍0.001 for G;P⫽0.27 for T. (C) Proportion of bases preceding the mismatches in the 3⬘direction compared to the overall proportion of these bases within the cohort.P⫽0.01 for A;P⫽0.02 for C;P⫽0.04 for G;P⫽0.002 for T.
2903
on May 15, 2020 by guest
tively. A-to-G, A-R, and G-R mismatches were significantly
more common than other mismatched base pairs (P⬍0.001)
(Fig. 3A). More than half (52%) of all mismatches involved A or G (or R, a mixture of A and G). We compared the propor-tion of bases immediately preceding the mismatches in both
the 5⬘and 3⬘directions to the overall proportion of the
respec-tive bases within the 46 cohort samples. The proportion of A 5⬘
to the mismatch was significantly higher than the total
preva-lence of A in the samples (P⬍0.001) (Fig. 3B). The
propor-tions of T (P⫽0.002) and C (P⫽ 0.02) 3⬘ to the mismatch
were significantly higher than the respective proportions within the cohort samples (Fig. 3C).
Amino acid differences.A total of 22,954 amino acids (499
codons [99in PR and 400 in RT] for 46 sequences) were in-ferred (Table 1). Amino acid concordances were 99.3 and 99.8% after first-round (A1 versus B1) and second-round (A1 versus A2; B1 versus B2) PCRs, respectively. This translated into a total of 170 amino acid differences observed after
first-round PCR and 51 (arm A) and 46 (arm B) differences
ob-served after second-round PCR (P⬍0.001). Within each arm
(A2 versus A3 and B2 versus B3), the concordance was 99.8%. Overall, 76.4% of amino acid discordances were partial discor-dances, while for replicates of the same first- and second-round PCRs, 86.7% (arm A) and 100% (arm B) of amino acid dis-cordances were partial disdis-cordances.
Inter-rater concordance. The inter-rater concordance for
replicates of the 46 samples was 99.9% or greater for nucleo-tides as well as amino acids (Table 1). Additionally, a routine control sample was extracted and subjected to RT-PCR and nested PCR followed by sequencing for a total of 103 replicates over 9 months. The sequences were analyzed independently by four different, highly experienced staff members during this period. This process consistently gave highly reproducible se-quences throughout the testing period (median, 0.04% nucle-otide discordances; range, 0 to 0.2%).
Identification of resistance mutations and impact on
resis-tance calls. A total of 265 drug resistance mutations were
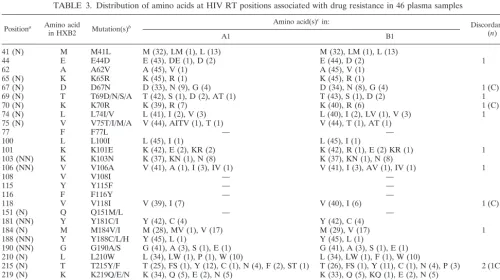
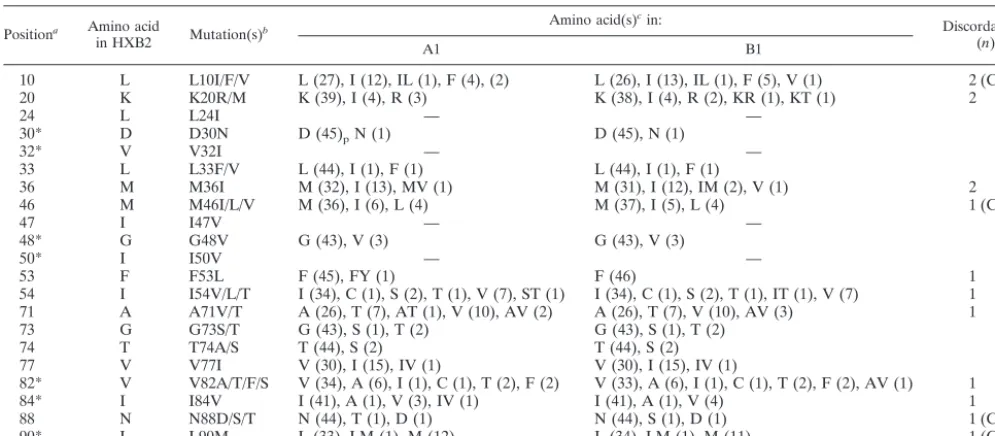
[image:5.603.42.283.91.163.2]identified in the 46 isolates (Table 2); of these, 242 (91.3%) were complete matches. The distributions of amino acids at PR and RT codons associated with drug resistance are shown in Tables 3 and 4, respectively. Of the complete mismatches at RT codons, three were located at key RT resistance mutation sites (D67, K70, and T215) and one was located at V118 (a mutation associated with resistance in some genetic back-grounds [15]) (Table 3). There was only one complete mis-match at a key PR resistance codon (L90), although other
TABLE 2. Number and characteristics of drug resistance mutations observed in 46 plasma samples
Region
No. of drug resistance mutations
No. (%) of complete
matches
No. (%) of complete mismatches
No. (%) of partial mismatches
PR 132 120 5 7
RT 133 122 4 7
[image:5.603.43.544.412.692.2]Total 265 242 (91.3%) 9 (3.4%) 14 (5.3%)
TABLE 3. Distribution of amino acids at HIV RT positions associated with drug resistance in 46 plasma samples
Positiona Amino acid
in HXB2 Mutation(s)
b Amino acid(s)
cin:
Discordancesd (n)
A1 B1
41 (N) M M41L M (32), LM (1), L (13) M (32), LM (1), L (13)
44 E E44D E (43), DE (1), D (2) E (44), D (2) 1
62 A A62V A (45), V (1) A (45), V (1)
65 (N) K K65R K (45), R (1) K (45), R (1)
67 (N) D D67N D (33), N (9), G (4) D (34), N (8), G (4) 1 (C)
69 (N) T T69D/N/S/A T (42), S (1), D (2), AT (1) T (43), S (1), D (2) 1
70 (N) K K70R K (39), R (7) K (40), R (6) 1 (C)
74 (N) L L74I/V L (41), I (2), V (3) L (40), I (2), LV (1), V (3) 1
75 (N) V V75T/I/M/A V (44), AITV (1), T (1) V (44), T (1), AT (1)
77 F F77L — —
100 L L100I L (45), I (1) L (45), I (1)
101 K K101E K (42), E (2), KR (2) K (42), R (1), E (2) KR (1) 1
103 (NN) K K103N K (37), KN (1), N (8) K (37), KN (1), N (8)
106 (NN) V V106A V (41), A (1), I (3), IV (1) V (41), I (3), AV (1), IV (1) 1
108 V V108I — —
115 Y Y115F — —
116 F F116Y — —
118 V V118I V (39), I (7) V (40), I (6) 1 (C)
151 (N) Q Q151M/L — —
181 (NN) Y Y181C/I Y (42), C (4) Y (42), C (4)
184 (N) M M184V/I M (28), MV (1), V (17) M (29), V (17) 1
188 (NN) Y Y188C/L/H Y (45), L (1) Y (45), L (1)
190 (NN) G G190A/S G (41), A (3), S (1), E (1) G (41), A (3), S (1), E (1)
210 (N) L L210W L (34), LW (1), P (1), W (10) L (34), LW (1), F (1), W (10)
215 (N) T T215Y/F T (25), FS (1), Y (12), C (1), N (4), F (2), ST (1) T (26), FS (1), Y (11), C (1), N (4), P (3) 2 (1C) 219 (N) K K219Q/E/N K (34), Q (5), E (2), N (5) K (33), Q (5), KQ (1), E (2), N (5)
225 P P225H — —
236 (NN) P P236L — —
a
N, key or secondary nucleoside analogue-associated RT inhibitor mutation; NN, key nonnucleoside RT inhibitor mutation. b
T69D/N/S/A stands for T69D, T69N, T69S, or T69A. c
—, complete match with HXB2. Numbers in parentheses represent the numbers of samples for the observed amino acid or mixture. d
C, complete discordance.
2904 GALLI ET AL. J. CLIN. MICROBIOL.
on May 15, 2020 by guest
http://jcm.asm.org/
mismatches were observed at the secondary PR resistance codons M46 and N88 and at codon L10 (Table 4). There were no complete mismatches at any key codons associated with resistance to nonnucleoside reverse transcriptase inhibitors (data not shown). Partial mismatches that could affect resis-tance calls occurred once at PR position 82 and once at RT positions 44, 69, 74, 184, and 219.
Intrapatient sequence variability. In order to assess the
longitudinal biological stability of HIV PR and RT se-quences, 168 sequences from 22 patients were analyzed (range, 4 to 18 sequences per patient). The mean duration of the follow-up analysis period for each patient was 29 months (range, 6 to 55 months). The overall full and partial intrapatient nucleotide discordances ranged from 0 to 3.5% (median, 1.1%) when sequential HIV PR or RT sequences were compared to the initial sequence for each patient. By definition, there were no mutations detected at key resis-tance-associated sites in any sequence, but a total of 389 mutations (231 in PR and 158 in RT) were identified at
secondary or accessory sites. No sample had⬎4 mutations
at these sites. The mutations tended to remain constant in sequential samples from the same patient.
Plasma viral load. There was no obvious correlation
be-tween plasma viral load and the number of nucleotide, amino acid, or drug resistance mutation discordances in replicate sequences. At plasma viral loads below 4 log units (10,000 HIV
RNA copies/ml) (n⫽9), the mean number of full and partial
nucleotide discordances between duplicates was 5 (range, 0 to 11); at plasma viral loads between 10,000 and 100,000
HIV RNA copies/ml (n⫽10), the mean was 14 discordances
(range, 0 to 22); and at plasma viral loads of ⬎100,000
cop-ies/ml (n⫽16), the mean was 7 (range, 0 to 19).
DISCUSSION
To maximize the clinical utility of resistance testing results, it is important that the precision and accuracy of the assays re-main sustainable at a high level. Several previous studies have pointed out possible sources of error or variations through interlaboratory comparisons using clinical plasma isolates and/ or plasma spiked with isolates from mixtures of plasmid clones (6, 16, 17, 19). The intralaboratory reproducibility of HIV-1 PR and RT sequencing has been demonstrated to be quite high in one study (20), but few published studies have attempted to establish which procedural steps in the genotyping process are the greatest contributors to variability.
In this study, the overall nucleotide concordance for the 276 replicate sequences from 46 cross-sectional clinical samples
was⬎99%. Since not all nucleotide differences code for amino
acid changes, we also demonstrated an amino acid
concor-dance of⬎99% for the same study samples. Of note,
signifi-cantly more nucleotide and amino acid differences occurred as a result of the first-round RT-PCR than during the
second-round nested PCR (P ⬍ 0.001), indicating that most
[image:6.603.43.541.81.299.2]discor-dances are likely to result from initial RT-PCR sampling of the predominant HIV-1 plasma population rather than from tech-nical variation (21) or operator performance (17). Despite the high concordance between sequence replicates, a total of 14 partial and 9 complete nucleotide mismatches occurred in the 265 total key and secondary resistance mutations observed in the study population. A portion of these mismatches would affect resistance interpretations, indicating that inaccuracies affecting resistance calls can occur at low prevalence even in highly controlled assay situations. Due to the relatively small numbers of cases with low viral loads, any impact of plasma
TABLE 4. Distribution of amino acids at HIV PR positions associated with drug resistance
Positiona Amino acid
in HXB2 Mutation(s)
b Amino acid(s)
c
in: Discordancesd
(n)
A1 B1
10 L L10I/F/V L (27), I (12), IL (1), F (4), (2) L (26), I (13), IL (1), F (5), V (1) 2 (C)
20 K K20R/M K (39), I (4), R (3) K (38), I (4), R (2), KR (1), KT (1) 2
24 L L24I — —
30* D D30N D (45)pN (1) D (45), N (1)
32* V V32I — —
33 L L33F/V L (44), I (1), F (1) L (44), I (1), F (1)
36 M M36I M (32), I (13), MV (1) M (31), I (12), IM (2), V (1) 2
46 M M46I/L/V M (36), I (6), L (4) M (37), I (5), L (4) 1 (C)
47 I I47V — —
48* G G48V G (43), V (3) G (43), V (3)
50* I I50V — —
53 F F53L F (45), FY (1) F (46) 1
54 I I54V/L/T I (34), C (1), S (2), T (1), V (7), ST (1) I (34), C (1), S (2), T (1), IT (1), V (7) 1
71 A A71V/T A (26), T (7), AT (1), V (10), AV (2) A (26), T (7), V (10), AV (3) 1
73 G G73S/T G (43), S (1), T (2) G (43), S (1), T (2)
74 T T74A/S T (44), S (2) T (44), S (2)
77 V V77I V (30), I (15), IV (1) V (30), I (15), IV (1)
82* V V82A/T/F/S V (34), A (6), I (1), C (1), T (2), F (2) V (33), A (6), I (1), C (1), T (2), F (2), AV (1) 1
84* I I84V I (41), A (1), V (3), IV (1) I (41), A (1), V (4) 1
88 N N88D/S/T N (44), T (1), D (1) N (44), S (1), D (1) 1 (C)
90* L L90M L (33), LM (1), M (12) L (34), LM (1), M (11) 1 (C)
a
*, key protease resistance mutation. b
L10I/F/V stands for L10I, L10F, or L10V. c
—, complete match with HXB2. Numbers in parentheses represent the numbers of samples for the observed amino acid or mixture. d
C, complete discordance.
on May 15, 2020 by guest
http://jcm.asm.org/
viral load would have been difficult to detect in these experi-ments.
More than half of all mismatches involved nucleotide A or G, with significant prevalences of A-to-G, A-to-R (a mixture of A and G), and G-to-R mismatches relative to other
combina-tions (P⬍0.001). Furthermore, mismatches were context
pendent—depending on flanking bases—but not location de-pendent, since nucleotide discrepancies occurred scattered throughout the genome. These data indicate a systematic ra-ther than a random contribution to the variability of the se-quences obtained.
As reported by others (19, 20), most nucleotide and amino acid discordances were the results of mixtures. The reduced ability to detect minor variants either by genotyping or by phenotyping methods should be a recognized limitation of clinical antiretroviral drug resistance testing (4, 14). If this is accepted, along with the relatively low prevalence of mixtures in clinical samples, the use of predefined mixtures of HIV DNA clones in external quality assessment (EQA) panels to assess variability (16, 17) may not be appropriate. The use of DNA clones in EQA panels would not allow assessment of the contribution of the extraction or the reverse transcription step to sequence variability. As concluded by this study, the reverse transcription step is potentially a source of significant variabil-ity, and the extraction step may also contribute to failure in some cases. Since DNA clones would not be directly amplified through RT-PCR, their use in quality assessment panels may not provide true performance assessment of all steps in an RT-PCR-containing assay. Until the reliability of resistance testing assays for detection of minority species in plasma is improved, consistency and reproducibility remain primary tar-gets for control of day-to-day assay performance. Clinical trials (1, 5, 8, 18) have illustrated that genotyping can be a good prognostic marker when performed longitudinally. A key lab-oratory contribution to this prognostic capability is to demon-strate that minimal intrapatient sequence variation is achiev-able in sequential samples tested over time in the absence of significant viral evolution. In our study of 168 sequences from 22 antiretroviral-experienced patients with predominantly wild type HIV in plasma, sequence concordance with the initial sample for each patient remained high (96.5 to 100%) for the entire sampling period (ranging from 6 to 55 months). Al-though patients with no mutations at key resistance-associated sites were selected for this cohort, mutations at other sites were consistently detected in sequential samples from the same pa-tient. These results suggest that the inherent biological vari-ability of HIV-1 sequences is relatively small.
Interoperator variability was minimal in this study, which may be expected due to the high level of experience of the laboratory staff. In a direct comparison of 46 sequences ana-lyzed by two different staff members using the same procedure,
nucleotide and amino acid concordances were ⬎99.9%.
Fur-thermore, for 103 replicates of a single clinical plasma sample analyzed by as many as four different laboratory staff members over a 9-month period, concordance with the initial sequence averaged 99.9%, with nucleotide differences ranging from 0 to 3 per 1,497-base sequence. However, this isolate contained few nucleotide mixtures.
In summary, most of the variation observed in replicate cross-sectional or longitudinal samples in this study was likely
due to the first-round RT-PCR, apparently resulting from sys-tematic variations in nucleotide incorporation. Technical assay performance issues did not impact on the observed variance. These results confirm that carefully controlled sequence-based genotyping can be a precise and reliable tool for monitoring HIV drug resistance, and they suggest that efforts to reduce variability should focus on the RT-PCR step of the assay al-gorithm. These efforts could involve, but are not limited to, studies on RT enzyme fidelity, primer sequences, and the num-ber of amplification cycles of RT-PCR.
REFERENCES
1. Baxter, J. D., D. L. Mayers, D. N. Wentworth, J. D. Neaton, M. L. Hoover, M. A. Winters, S. B. Mannheimer, M. A. Thompson, D. I. Abrams, B. J. Brizz, J. P. Ioannidis, T. C. Merigan, et al.2000. A randomized study of antiretroviral management based on plasma genotypic antiretroviral resis-tance testing in patients failing therapy. AIDS14:F83–F93.
2. BHIVA Writing Committee on behalf of the BHIVA Executive Committee.
2001. British HIV Association (BHIVA) guidelines for the treatment of HIV-infected adults with antiretroviral therapy. HIV Med.2:276–313. 3. Call, S. A., M. S. Saag, A. O. Westfall, J. L. Raper, S. V. Pham, J. M. Tolson,
N. S. Hellman, G. A. Cloud, and V. A. Johnson.2001. Phenotypic drug susceptibility testing predicts long-term virologic suppression better than treatment history in patients with human immunodeficiency virus infection. J. Infect. Dis.183:401–408.
4. D’Aquila, Richard T.2000. Limits of resistance testing. Antivir. Ther.5:71– 76.
5. Deeks, S. G., N. S. Hellmann, R. M. Grant, N. T. Parkin, C. J. Petropoulos, M. Becker, W. Symonds, M. Chesney, and P. A. Volberding.1999. Novel four-drug salvage treatment regimens after failure of a human immunode-ficiency virus type 1 protease inhibitor-containing regimen: antiviral activity and correlation of baseline phenotypic drug susceptibility with virologic outcome. J. Infect. Dis.179:1375–1381.
6. Demeter, L. M., R. D’Aquila, O. Weislow, E. Lorenzo, A. Erice, J. Fitzgibbon, R. Shafer, D. Richman, T. M. Howard, Y. Zhao, E. Fisher, D. Huang, D. Mayers, S. Sylvester, M. Arens, K. Sannerud, S. Rasheed, V. Johnson, D. Kuritzkes, P. Reichelderfer, A. Japour, et al.1998. Interlaboratory concor-dance of DNA sequence analysis to detect reverse transcriptase mutations in HIV-1 proviral DNA. J. Virol. Methods75:93–104.
7. Dunne, A. L., F. M. Mitchell, S. K. Coberly, N. S. Hellmann, J. Hoy, A. Mijch, C. J. Petropoulos, J. Mills, and S. M. Crowe.2001. Comparison of genotyping and phenotyping methods for determining susceptibility of HIV-1 to antiretroviral drugs. AIDS15:1471–1475.
8. Durant, J., P. Clevenbergh, P. Halfon, P. Delgiudice, S. Porsin, P. Simonet, N. Montagne, C. A. Boucher, J. M. Schapiro, and P. Dellamonica.1999. Drug-resistance genotyping in HIV-1 therapy: the VIRADAPT randomised controlled trial. Lancet353:2195–2199.
9. Erali, M., S. Page, L. G. Reimer, and D. R. Hillyard.2001. Human immu-nodeficiency virus type 1 drug resistance testing: a comparison of three sequence-based methods. J. Clin. Microbiol.39:2157–2165.
10. Galli, R., B. Wynhoven, and R. Harrigan.2002. Quality management of sequence-based methods for measuring HIV-1 drug resistance. Am. Clin. Lab.21:13–15.
11. Hammond, J., C. Calef, B. Larder, R. F. Schinazi, and J. Mellors.1998. Mutations in retroviral genes associated with drug resistance. InB. T. Korber, C. Kuiken, B. Foley, B. Hahn, F. McCutchan, J. Mellors, and J. Sodrowski (ed.), Human retroviruses and AIDS: a compilation and analysis of nucleic and amino acid sequences. Theoretical Biology and Biophysics, Los Alamos National Laboratory, Los Alamos, N.Mex.
12. Harrigan, P. R., K. Hertogs, W. Verbiest, R. Pauwels, B. Larder, S. Kemp, S. Bloor, B. Yip, R. Hogg, C. Alexander, and J. S. Montaner.1999. Baseline HIV drug resistance profile predicts response to ritonavir-saquinavir pro-tease inhibitor therapy in a community setting. AIDS13:1863–1871. 13. Hirsch, M. S., F. Brun-Vezinet, R. T. D’Aquila, S. M. Hammer, V. Johnson,
D. Kuritzkes, C. Loveday, J. W. Mellors, B. Clotet, B. Conway, L. M. Deme-ter, S. Vella, D. M. Jacobsen, and D. D. Richman.2000. Antiretroviral drug resistance testing in adult HIV-1 infection: recommendations of an Interna-tional AIDS Society-USA Panel. JAMA283:2417–2426.
14. Richman, D. D.2000. Principles of HIV resistance testing and overview of assay performance characteristics. Antivir. Ther.5:27–31.
15. Romano, L., G. Venturi, S. Bloor, R. Harrigan, B. A. Larder, J. C. Major, and M. Zazzi.2002. Broad nucleoside-analogue resistance implications for human immunodeficiency virus type 1 reverse-transcriptase mutations at codons 44 and 118. J. Infect. Dis.185:898–904.
16. Schuurman, R., D. Brambilla, T. de Groot, D. Huang, S. Land, J. Bremer, I. Benders, and C. A. Boucher.2002. Underestimation of HIV type 1 drug resistance mutations: results from the ENVA-2 genotyping proficiency pro-gram. AIDS Res. Hum. Retrovir.18:243–248.
2906 GALLI ET AL. J. CLIN. MICROBIOL.
on May 15, 2020 by guest
http://jcm.asm.org/
17. Schuurman, R., L. Demeter, P. Reichelderfer, J. Tijnagel, T. de Groot, and C. Boucher.1999. Worldwide evaluation of DNA sequencing approaches for identification of drug resistance mutations in the human immunodeficiency virus type 1 reverse transcriptase. J. Clin. Microbiol.37:2291–2296. 18. Servais, Jean, Jean-Marc Plesseria, Christine Lambert, Elodie Fontaine,
Isabelle Robert, Vic Arendt, Therese Staub, Francois Schneider, Robert Hemmer, and Jean-Claude Schmit.2002. Genotypic correlates of resistance to HIV-1 protease inhibitors on longitudinal data: the role of secondary mutations. Antivir. Ther.6:239–248.
19. Shafer, R. W., A. Warford, M. A. Winters, and M. J. Gonzales.2000. Re-producibility of human immunodeficiency virus type 1 (HIV-1) protease and reverse transcriptase sequencing of plasma samples from heavily treated HIV-1-infected individuals. J. Virol. Methods86:143–153.
20. Shafer, R. W., K. Hertogs, A. R. Zolopa, A. Warford, S. Bloor, B. J. Betts, T. C. Merigan, R. Harrigan, and B. A. Larder.2001. High degree of
inter-laboratory reproducibility of human immunodeficiency virus type 1 protease and reverse transcriptase sequencing of plasma samples from heavily treated patients. J. Clin. Microbiol.39:1522–1529.
21. Thompson, J. D., T. J. Gibson, F. Plewniak, F. Jeanmougin, and D. G. Higgins.1997. The ClustalX windows interface: flexible strategies for mul-tiple sequence alignment aided by quality analysis tools. Nucleic Acids Res.
24:4876–4882.
22. Tural, C., L. Ruiz, C. Holtzer, J. Schapiro, P. Viciana, J. Gonzalez, P. Domingo, C. Boucher, C. Rey-Joly, and B. Clotet.2002. Clinical utility of HIV-1 genotyping and expert advice: the Havana trial. AIDS16:209–218. 23. Zolopa, A. R., R. W. Shafer, A. Warford, J. G. Montoya, P. Hsu, D.
Katzen-stein, T. C. Merigan, and B. Efron.1999. HIV-1 genotypic resistance pat-terns predict response to saquinavir-ritonavir therapy in patients in whom previous protease inhibitor therapy had failed. Ann. Intern. Med.131:813– 821.