Pulse Shape Discrimination Techniques based on
Cross-correlation and Principal Component Analysis
H. Saleh
NCRRT, EAEA Nasr City, Cairo
Egypt
A. Yahya
Electrical Engineering Department, Al Azhar, University,
Nasr City, Cairo, Egypt
M. Sayed
NCRRT, EAEA Nasr City, Cairo
Egypt
M. Ashour
NCRRT, EAEA Nasr City, Cairo
Egypt
ABSTRACT
Two Pulse Shape Discrimination (PSD) techniques are proposed based on Cross Correlation (CC) and Principal Component Analysis (PCA). In CC-based PSD, two schemes are proposed to discriminate between different decay scintillation pulses. The first CC-based scheme is applied to digitized scintillation pulses in time-domain with different numbers of samples ranging from the last two samples up to the full length. The second CC-based scheme is applied to frequency components of the scintillation pulses, where pulses are transformed using one of the following transforms; Discrete Sine Transform (DST), Discrete Cosine Transforms (DCT), Discrete Wavelet Transforms (DWT), and Fast Fourier Transform (FFT). On the other hand, in PCA-based PSD technique, two schemes are applied to the digitized pulses in time domain and the transformed pulses coefficients in the frequency domain, respectively, as in the previous sequence.
General Terms
Scintillation Detectors, Positron Emission Topography, Algorithms.
Keywords
Cross Correlation, DCT, PCA, Pulse Shape Discrimination, DOI, DST, FFT, Wavelet
1.
INTRODUCTION
The pulse shape discrimination (PSD) techniques are performed using the feature of the dependence of the signal on the particle characteristics, such as charge, energy, and mass. This process has been applied to signals coming either from a single detector or from a composite one (as the phoswich scintillators used in this research work). The composed detector is a stack of two different scintillation materials and may be optically coupled to a single Photomultiplier Tube (PMT) where each scintillator mainly responds to one radiation type. When a particle strikes the detector, the PMT generates a voltage pulse, and the amplitude of this pulse depends on type of the detector material. For accurate detection and practical identification, the pulses can be processed in DSP units [1].
The problem of discrimination pulses is common in many scientific applications and technologies such as, fission fragment angular distribution, crystal identification, particle identification, nuclear and electron recoils, and identification of shielded neutron sources. In fission fragment angular distribution measurements, the PSD methods are used to
separate the fission fragments and projectile-like fragments in heavy ion-induced reactions [2]. As well as, the crystal identification has been used for identify the layer of inter-action in multi layer detectors [3]. For resolution improvement or parallax mitigation with phoswich detectors, auto-regressive exogenous variable algorithms were applied to identify the crystal types. In addition, different types of particles such as the integrated scintillation waveforms obtained under alpha or beta irradiation can be distinguished using a discrimination method as in [4]. Due to electron events, the light from the scintillation detectors is emitted over a longer period than that of nuclear recoil events. Therefore, the ratio of early to total light emitted from the scintillation detectors emission in a single scintillation event can be used to nuclear and electron recoils [5]. Moreover, another application using PSD is identification of shielded neutron sources; this application was based on the acquisition of neutron and gamma-ray pulses by using a scintillation detector and a fast waveform digitizer. The PSD method based on standard charge integration was used to discriminate gamma-rays from neutrons. The scintillation pulses due to neutron are then analyzed to generate a pulse height distribution [6].
PSD can be classified as a time domain PSD and frequency domain PSD. Time domain can be categorized as analog and digital while frequency domain can be performed using different transforms like, Discrete Sine Transform (DST), Discrete Cosine Transforms (DCT), Discrete Wavelet Transforms (DWT), and Fast Fourier Transform (FFT). In time domain category, analog PSD methods such as zero crossing or charge comparison methods, study the ratio between the amplitude of the slow and fast components of the light emitted in the scintillation detector [11], [12]. In Digital PSD techniques, the incoming pulses coming from the scintillation detector are digitized and can be recorded into individual pulses waveforms [13]. Digital PSD techniques for neutron and gamma ray separation present a high reliability and flexibility over analog PSD. The most important difference between analog PSD and digital PSD processing is that with the digital discrimination after signal conditioning, where the amplified pulse is digitized and all operations of discrimination are carried out in digital processing tools like digital filters. Digital PSD techniques for neutron and gamma ray separation were proposed in [14], [15]. The DSP system offers important advantages over the analog system in the areas of accuracy, efficiency, and cost by eliminating necessitate for extra electronic modules [16].
Frequency domain PSD are obtained by transform the digitized scintillation pulses using any frequency transform; so the scintillation pulses, which are correlated, are converted into a set of values of uncorrelated variables called coefficients, then one or more of these coefficients have been used for discrimination. Different transforms such as discrete sin transform (DST) and discrete cosine transform (DCT) are used to transform the scintillation pulses into frequency coefficients [17] on which a PSD technique is preformed. As well as, FFT and DWT were used in PSD techniques by transform the scintillation pulses then discriminate between the frequency coefficients [18].
The CC algorithm is a sliding dot product or sliding inner product. The CC has been applied in different applications such as, a template matching, and elimination algorithms for correlation-based match measures as in [19], and action recognition. It also has applications in searching a known feature, electron tomography averaging, pattern recognition [20]. Furthermore, it applied in single particle analysis, and neurophysiology. The auto correlation has been improved for obtain accurate detection like the cubic higher-order local auto-correlations [21]
.
PCA algorithm is an identification technique by use an orthogonal transformation to convert a set scintillation pulses, which are correlated pulse into a set of values of uncorrelated variables called principal components. PCA is one of the most known global pattern recognition algorithm [22], [23]. The main idea of this algorithm is to decorrelate pulses in order to highlight differences between them by finding the eigenvectors of the covariance matrix of pulses. When the PCA is complete, the resulting principal components will display different degrees of correlation with the observed variables, but are completely uncorrelated with one another. PCA operation explain the internal structure of the data in a way which best explains the variance in the data.
In [24], PCA has been used in time domain only using full pulse length. On the other hand, a PSD technique based on Cross-correlation (CC) are proposed in [25] to highlight the difference between scintillation pulses by transform the
interpolated pulses using wavelet transform then applying the CC analysis.
In the proposed techniques, the CC is used to measure a similarity of two waveforms as a function of a time lag applied to one of them. Discrimination is performed based on matching of an unknown pulse against a library of known pluses. Two PSD schemes use the CC-based similarity measure. In first scheme, two types of pulses (unknown pulse and known pluses) of the scintillation detectors are in time domain. Second scheme is based on transforming two types of pulses using one of the following transforms; DST, DCT, FFT, and DWT, then performing the matching process with respect to transformation coefficients to measure the CC-based similarity.
In this research work, CC-based and PCA-based PSD techniques are proposed, which are applied in time domain and frequency domain using different lengths of the scintillation pulses. The proposed PCA-based technique performs PCA is performed using different lengths of the digitized pulses in time domain. In the frequency domain scheme of PCA-based technique, the scintillation pulses are transformed using one of the mentioned transformers then the PCA coefficients are used for discrimination.
Similarly, the proposed CC-based technique is performed directly on the digitized scintillation pulses with different lengths in time domain. On the other hand, the frequency domain CC-based technique is applied to the transformed scintillation pulses using one of the mentioned transforms then CC algorithm are applied to perform the discrimination. In this paper, pulses of LSO and LuYAP are used, the number of total pulses are 10000. The covering time window is 400 ns, where each pulse is represented by 16 samples. The sampled pulses were transferred to the host computer. These pulses were recorded by means of an acquisition board described in [25].
This paper is organized as follows: firstly, CC-based PSD algorithm description is presented in section 2. Secondly, PCA-based PSD algorithm is described in section 3. The results and discussion of the proposed algorithm is demonstrated in section 4. Finally, section 5 concludes this paper.
2.
CC-BASED PSD TECHNIQUE
The proposed technique is based on cross-correlation as a crystal identification sorter. This method can achieve a successful discrimination rate of scintillation pulses of LSO and LuYAP phoswich crystals. The cross-correlation function of two time series X, and Y, is defined as:
CXY(m)= N−m−1n=0 X(m + n) ∗ Y∗(n) (1)
Where N is a number of samples in time series X, Y* is the reciprocal of Y series, and the output vector CXY(m) is
represented by m=1, 2... 2N-1. Discrimination is performed using two steps, training step and testing step. Two groups of known pulses from LSO and LuYAP pulses are used to perform training step. A set of LSO pulses is acquired then the mean of these pulses (TPLSO) is computed. The cross
correlation vectors is computed between TPLSO and every
pulse of this set. The other correlation vectors are computed between TPLSO and every pulse of the known set of LuYAP
and C2 respectively. Threshold value between the two
histograms of middle value vectors C1, and C2 is computed
with respect to the following equation:
Threshold=f1μ1σ2+f2μ2σ1
f2σ1+f1σ2 (2)
where f2= 2
1+ σ 1σ 2 , and f1= 2 − f2
Where μ1 is the mean of C1 and μ2 is the mean of C2. The
standard deviation of C1 and C2 are σ1 and σ2 respectively.
After perform the training step the threshold value is obtained. Then the cross correlation between unknown pulse and the training pulse TP of LSO is calculated. Then the middle term in cross correlation vector is compared with the threshold value to find the type of pulse. The preceding mode is performed using LSO pulses as a type identifier. The other mode is performed using LuYAP pulses.
The percentage is calculated using the following equation
percentage = NLSO NAll −LSO+
NLuYAP
NAll −LP X 100%
(3)
On the other hand, the above technique is repeated for the transformed pulse using different transforms DST, DCT, FFT, and DWT and the results between two manners are compared.
3.
PCA-BASED PSD TECHNIQUE
The main idea of PCA technique is to de-correlate pulses in order to highlight differences by finding the eigenvectors of the covariance matrix of LSO and LuYAP pulses. The first step is to train the PCA using the training set; the mean pulse µL of the training set of the scintillation pulses is computed
using equation (4).
𝜇𝐿=𝑁1 𝑁𝑛=1𝑇𝐿 (4)
Where (n) is the pulse index, (N) is the number of pulses, and
𝑇
𝐿 is the scintillation pulses then each training pulse is mean-subtracted by equation (5)𝑀𝑠= 𝑇𝐿− 𝜇𝐿, 𝑛 = 1,2, .. (5)
The covariance matrix (cov) of the mean-subtracted training pulses is computed using equation (6):
𝑐𝑜𝑣 = 𝑁𝑛=1𝑀𝑠(𝑀𝑠)𝑇 (6)
After that the eigenvectors (cov) and the eigenvalues (λ) of (cov) are considered using equation (7).
𝑐𝑜𝑣 . 𝜚 = 𝜚𝑥𝜆 (7) By solving equation (7), the eigenvectors and eigenvalues of each training pulse are considered. A higher eigenvalues captures a higher variance, consequently more information of each pulse consequently; eigenvalues are sorted in decreasing order. Then, we compute the total energy of the eigenvalues to keep about 98% from the total energy. Equation (8) explains how each mean-subtracted pulse of the training set of LSO and LuAYP pulses are projected onto the new space eigenvectors (ϱ) to get weigthted vector (H).
𝐻 = 𝜚𝑇. 𝑀
𝑠 (8) Then, the Euclidean Distance (ED) is computed between the projected tested pulse and each weighted vector of the training set according to equation (11). The minimum Euclidian distance is computed, the index (I) of Minimum Euclidean Distance (MED) represents the type of pulse.
ED = Nn=1HT(n) − H(n) (9)
As in cross-correlation technique, the preceding calculations are performed to the transformed pulses using DST, DCT, FFT, and DWT.
4.
RESULTS AND DISCUSSIONS
4.1
CC-based technique
Cross-Correlation of the digitized scintillation pulses and transformed pulses are proposed. In addition, the tested pulses will be use with different lengths (16, 12, 8, 4, and 2 samples from last samples of scintillation pulses). The centered value of the CC vector is taken only so it has the largest value and can be use in discrimination.
4.1.1
Digitized pulses
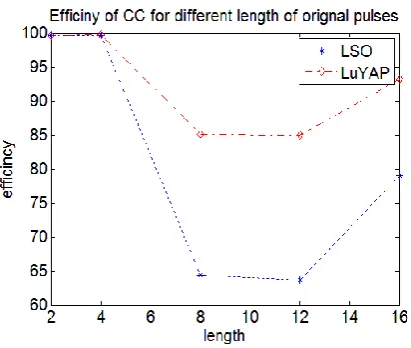
Figure (1) shows the efficiency of CC-based technique by applying the CC technique to training sets of LSO or LuYAP pulses to acquire the threshold value. Then the cross correlation vector of unknown pulse with training set of LSO or LuYAP is computed and compared with the threshold value to perform the discrimination.
Figure 1: efficiency of CC for different length of digitized pulses
From figure (1), the best efficiency for discrimination is presented for four and two samples length of the unknown pulse so it can be used for discrimination between the scintillation pulses whoever the training pulses is LSO or LuYAP. Therefore, two samples are the best choice for discrimination which discrimination efficiency is 99.53%.
4.1.2
Transformed Pulses
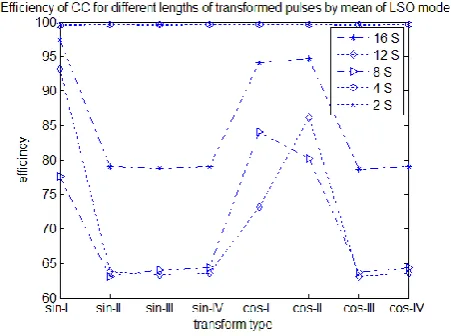
[image:3.595.318.524.317.491.2]Figure 2: efficiency of CC for different lengths of transformed pulses using LSO
Figure 3: efficiency of CC for different lengths of transformed pulses using LuYAP
Figures 2 and 3 represent an important conclusion, that the tail of pulse contains most of discriminations features, so the tail can be taken only to perform discrimination, which reduce the processing time. The best efficiency of CC for different length of transformed pulses using of LSO or LuYAP training set is 99.54% presented using two samples. At the present others transform are used in discrimination FFT, and DWT.
Figure 4: Efficiency of CC technique for different lengths of transformed pulses using FFT and DWT
Figure (4) gives different efficiency for discrimination using DWT and FFT. The efficiency for two and four samples are 99.53%, and 99.65% respectively using DWT and FFT. Discrimination using wavelet transforms is performed using Daubechies. Although FFT transform has, a complex computation DWT transform gives results equal to them with real computation. Finally, from the previous figure as the number of samples decrease the efficiency increase, thus the efficiency is inversely proportions to the number of samples in the transformed pulse.
4.2
PCA-based technique
The training pulses of scintillation detector are projected using eigenvectors to get the weighted vectors (H), each of the tested pulses is projected onto the new space using eigenvectors (ϱ). The first principal component has as high a variance, and each subsequent component in turn has the highest variance possible under the constraint that it be uncorrelated with the previous components. As is the previous technique PCA technique is performed using two method, the first method is depend on the digitized scintillation pulses and the second method is depend on the transformed pulses using different technique, the DST, DCT, FFT, and DWT transforms.
4.2.1
Digitized pulses
Figure (5) shows the efficiency of PCA-based technique by take the training set consist of a percentage of LSO and LuYAP equal to 5% for each type. Different lengths of tested pulse are used for discrimination.
Figure 5: Efficiency of PCA technique for different length of digitized pulses
From figure (5), the efficiency of all lengths is nearly equal except the efficiency of two samples the efficiency is 79.23%. Four samples efficiency is 99.41%. This length gives an excellent efficiency and performed using a few calculations as a result from it has a smallest length.
4.2.2
Transformed Pulses
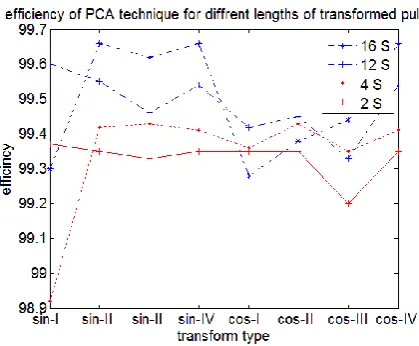
[image:4.595.54.282.74.459.2] [image:4.595.319.532.396.573.2]Figure 6: efficiency of PCA technique for different lengths of transformed pulses
Figure (6) gives an important note; the full-length pulse is the best length for perform discrimination with discrimination efficiency up to 99.66% using Sine-II type of transform. Earlier from the different lengths of CC-based technique only two samples is suggested for discrimination but in PCA-based technique the full-length samples of scintillation pulses are recommended for discrimination. Figure (7) shows the PCA-based technique using FFT and DWT.
Figure 7: Efficiency of PCA technique for different lengths of transformed pulses using FFT and DWT
Figure (7) also gives efficiency almost equal to transformed pulses using DST/DCT transforms. The best; DST/DCT is more efficient than FFT so it eliminates the complex computations of FFT. In addition, the preceding figure gives an excellent efficiency for DWT which efficiency is 99.55% by using 8 samples from the tail of pulse so the 8 sample is used for performing the efficiency during calculations is used.
5.
CONCLUSION
The present work proposed two techniques for discrimination CC-based PSD and PCA-based PSD, and shows how these techniques can be used for discrimination whoever using the digitized pulses or the transformed pulses. The pulses are transformed to a new space to de-correlate pulses in order to highlight differences between them. The dependence of discrimination on the number of sample used in PSD is
discussed. Two schemes of discrimination are used for every technique, time domain scheme, and frequency domain scheme.
The comparative through two schemes of the CC-based PSD and PCA based PSD turned out that, the best efficiency of CC is 99.67%, when only four sample of the digitized pulse mode are used and 99.66% is the best efficiency for PCA technique using the DST transform of the full pulse length. When two samples of the scintillation pulses are used for discrimination the best efficiency of CC is 99.53% using digitized pulses mode, and PCA is 99.35% using transformed pulses using DST transform. Hence, CC is more efficient than PCA due to the good efficincy for discrimination using small length of digitized pulse.
The efficiency of discrimination can be enhanced by transform the scintillation pulses as in CC-based PSD the efficiency of full length is 84.84% and efficiency of transformed pulses using DST is 97.26%. In addition the efficiency is inversely proportions to the number of samples in the CC technique for the transformed pulses, thus the tail of pulse contains the main features of discriminations. While in PCA technique, the full pulse efficiency is larger than a segment of pulse.
Hence, CC is more efficient than PCA for discrimination when segmant of pulse is uasd for discrimination which, it reduce the processing time CC algorithm can be used for only two-layer detector while PCA can be used for discrimination in multilayer detector.
6.
REFERENCES
[1] L. Bardelli, M. Bini, G. Poggi, and N. Taccetti “Application of digital sampling techniques to particle identification in scintillation detectors” Nuclear Instruments and Methods in Physics Research” 491(A): 244–257,2002.
[2] B. Nayak, E. Mirgule And R. Choudhury, “Application of pulse shape discrimination in Si detector for fission fragment angular distribution measurements” Journal of physics Indian Academy of Sciences, pages., 65(6):1053-1059,2005.
[3] H. Semmaou et al “Crystal Identification Based on Recursive-Least-Squares and Least-Mean-Squares Auto-Regressive Models for Small Animal Pet “,IEEE Transactions on Nuclear Science, pages:, 55 (5): 2450 – 2454, 2008.
[4] G. Ranucci, R. Dossi,P. Inzani,G. Korga, P. Lombardi, P. Meroni, and M. Monzani, “A sampling board optimized for pulse shape discrimination in liquid scintillator applications” IEEE Transactions on Nuclear Science, 51 (4): Issue: 1784-1790, 2004.
[5] k. Ueshima, Scintillation-only Based Pulse Shape Discrimination for Nuclear and Electron Recoils In Liquid Xenon, Nuclear Instruments and Methods in Physics Research Section A, 659(1):161-168, 2011. [6] M. Flaska, S. Pozzi “Identification of shielded neutron
sources with the liquid scintillator BC-501A using a digital pulseshape discrimination method”, 577(3), 654-663, 2007
[image:5.595.57.272.384.553.2][8] C. Lee and G. Cho, “DOI resolution measurement and error analysis with LYSO and APDs”, Nuclear Instruments and Methods in Physics Research Section, 591(1): 84-87, 2008.
[9] E. Delfino,S. Majewski,R. Raylman and A. Stolin, “Towards 1mm PET resolution using DOI modules based on dual-sided SiPM readout”, Towards 1mm PET resolution using DOI modules based on dual-sided SiPM readout “Nuclear Science Symposium Conference Record (NSS/MIC), IEEE, ISSN : 1082-3654,: 3442 – 3449, 2010.
[10]A. Braem et al, “Novel design of a parallax free Compton enhanced PET scanner ” Nuclear Instruments and Methods in Physics Research Section A: Accelerators, Spectrometers, Detectors and Associated Equipment, 525(1-2): 268-274, 2004.
[11]R. Aryaeinejad, j. Hartwell, and D. Spencer, “Comparison between digital and analog pulse shape discrimination techniques for neutron and gamma ray separation”, Nuclear Science Symposium Conference Record IEEE,ISSN :1082-3654(1): 500 – 504, 2005. [12]J. Adams et al, “The JET neutron emission profile
monitor,” Nuclear Instruments and Methods in Physics Research Section. A 329(1): 277-290, 1993.
[13]L. Szentmiklósi, T. Belgya, Zs. Révay, and G. L. Molnár, "Digital Signal Processing in Prompt-Gamma Activation Analysis", Journal of Radioanalytical and Nuclear Chemistry, 264(1): 229-234, 2005.
[14]S. Jastaniah and P. Sellin, “Digital techniques for n/γ pulse shape discrimination and capture-gated neutron spectroscopy using liquid scintillators”. Nuclear Instruments and Methods in Physics Research A 517(1): 202–210, 2004 .
[15]Y. Kaschucka and B. Espositob, “Neutron/ γ -ray digital pulse shape discrimination with organic scintillators”. Nuclear Instruments and Methods in Physics Research A 551(2):420-428,2005.
[16]S. Yousefi “Digital Pulse Shape Discrimination in Triple-Layer Phoswich Detectors Using Fuzzy Logic”, IEEE Transactions on Nuclear Science, 55(5): 2739- 2748, 2008.
[17]H. Saleh, A. yahya, M. Ashour and M. Sayed “DST and DCT-based depth of interaction (DOI) determining techniques for LSO and LuYAP scintillation detectors in PET”. International Journal of Computer Applications, 28(7): 41-45, 2011.
[18]A. Arafa, H. Saleh, M. Ashour, A. Salem, “FFT- and dwt-based FPGA realization of pulse shape discrimination in pet system”. Fourth IEEE International Conference on Design &Technology of Integrated Systemsin Nanoscale Era, DTIS09, 6-7 APRIL 2009. [19]Mahmood and S. Khan “Exploiting Transitivity of
Correlation for Fast Template Matching”, IEEE Transactions on Image Processing, pp:, 19(8): 2190 – 2200,2010.
[20]A. Amar and S. Mian “Correlation based speech-video synchronization”, Pattern Recognition Letters,32 :780– 786, 2011.
[21]T. Matsukawa and T. Kurita, “Action Recognition Using Three-Way Cross-Correlations Feature of Local Moton Attributes” , 2010 20th International Conference on Pattern Recognition (ICPR), 1731 – 1734, 2010. [22]C. Ren and D. Dai, “Incremental learning of bidirectional
principal components for face recognition ”. Pattern Recognition, 43(1): 318-330, 2010.
[23]D. Zhang, Z. Zhou and S. Chen “Diagonal principal component analysis for face recognition”. Pattern Recognition, 39(1): 140-142, 2006.
[24]H. Saleh, A. yahya, M. Ashour1and M. Sayed, “Depth of Interaction Determination Technique Based on Principal Component Analysis”,10th International Conference of Nuclear Science and Applications, accepted for applications (4-8 Feb 2012).
[25]H. Semmaoui, R. Lecomte and R. Fontaine “A Cross-Correlation Method for Crystal Identification in APD-Based Phoswich Detectors Used In Small Animal PET Scanner”. Nuclear Instruments and Methods in Physics Research 597(2): 238–241, 2008.