Performance Evaluation of a LAN under Different
Ethernet Wiring Standards with Different Frame Size
Mohammad Wazid
Student, M. Tech Computer Network Engg. 1st Year
Graphic Era University Dehradun, India
Roshan Singh Sachan
Student, M. Tech Computer Network Engg. 1st Year
Graphic Era University Dehradun, India
R.H. Goudar
Associate Professor Department of CSE Graphic Era University
Dehradun, India
ABSTRACT
In this paper we simulate an office LAN using IT Guru Opnet 9.1 and then we calculate the performance of this network under 10BaseT and 100BaseT Ethernet wiring standards with different frame size and finally we compare the results i.e. which standard perform better for which frame size. We find that numbers of collision counts at hubs are always more in 10BaseT, because of the nature of this standard. Hubs are always more utilized in 10BaseT, because of more retransmission attempts due to high number collisions under 10BaseT. Initially when frame size is 1500 Bytes, we find that 100BaseT standard is performing well because the switch filters more traffic. We again reduce the frame size to 1024 Bytes in this case performances are equivalent. When we further reduce frame size to 512 Bytes we get a shocking result because 10BaseT standard performs well and the switch filters more traffic. Then we come to point that if we have a low traffic LAN and we fix frame size to 512 Bytes then we have to use 10BaseT Ethernet wiring standard in the implementation of LAN because it will give us good performance as compares to 100BaseT. To our best knowledge this is the first paper that calculates the performance of a LAN under these assumptions.
General Terms
Guided Media, Unguided Media, Collision count, Utilization, Traffic Received and Traffic Forwarded.
Keywords
10BaseT, 100BaseT, LAN and WAN.
1. INTRODUCTION
A local area network (LAN) is a collection of different computers that interconnects computers in a limited area such as a company, college, laboratory, office building etc. Usually a LAN has higher data transfer rates, smaller geographic coverage and lack of a need for leased telecommunication lines as compare to a WAN. In the creation of a LAN we use different types of hardware such as repeaters, switches, hub, connectors and different cables. The aim of this work is to measure the performance of network in different Ethernet wiring (i.e. 10BaseT/100BaseT) environments. Simulations are done using IT Guru Opnet.
Very few people have done such analysis on the frame sizes for different Ethernet standards. We want to find out a optimum frame size on which a Ethernet standard will work well.
For this work we create an office LAN with sixteen nodes, hubs, switch under 10BaseT (for senario1) and 100BaseT (scenario2) Ethernet wiring standards. Then we calculate the
received, traffic forwarded for hubs and traffic received, traffic forwarded for switch using different frame size. A brief introduction about some related terms-
1.1 Networking Media
There are two types of media used in the creation of a network. One is guided media and another is unguided media.
1.1.1 Guided Media
Different cables are used in Guided Transmission Media. They guide the data signals along a specific path. The data signals are bound by the "cabling" system. This kind of Media is also known as Bound Media.
1.1.2 Unguided Media
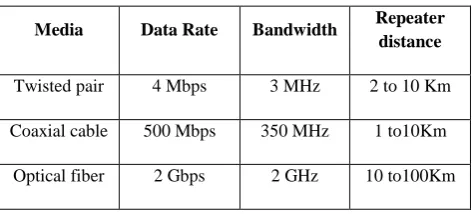
[image:1.595.311.548.486.593.2]In Unguided Transmission Media data signals travel in the vacuum, there is nothing to guide them along a specific path. In a guided medium signal passes through a physical path (cables), while in an unguided medium signal passes through vacuum. There are three types of guided media twisted pair, coaxial and optical fiber.
Table 1. Comparisons between these cables
Media Data Rate Bandwidth Repeater distance
Twisted pair 4 Mbps 3 MHz 2 to 10 Km
Coaxial cable 500 Mbps 350 MHz 1 to10Km
Optical fiber 2 Gbps 2 GHz 10 to100Km
We use twisted pairs (for the implementation of 10BaseT and 100BaseT standards) cables, so we are also explaining something about these cables.
1.2 Twisted Cables
1.3 10BaseT
10BaseT is an Ethernet wiring standard for LAN (Local Area Network) that runs at 10 Mbps. It uses twisted-pair cables. These cables have a maximum transmission length of 100 meters. They have two copper wires that are wrapped around each other, which reduce electromagnetic interference. Each workstation, containing a 10baseT network card connects to a 10baseT hub.
1.4 100BaseT
[image:2.595.318.548.70.245.2]100BaseT is an Ethernet wiring standard for LAN that supports data transfer rates up to 100Mbps over unshielded twisted pair copper wire cable. 100BaseT Ethernet wiring standard is the most commonly used LAN standard because of its high speed, robustness and low cost. It is also adaptable to new technologies. 100BaseT is based on 10BaseT Ethernet standard, which supports transfer rates of 10Mbps. It is also called as fast Ethernet because it is ten time faster than 10BaseT.
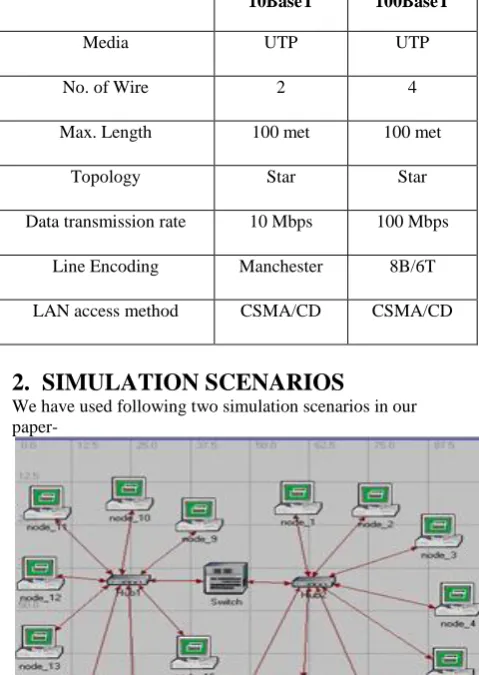
Table 2. Comparisons between 10BaseT & 100BaseT Ethernet wiring Standards
10BaseT 100BaseT
Media UTP UTP
No. of Wire 2 4
Max. Length 100 met 100 met
Topology Star Star
Data transmission rate 10 Mbps 100 Mbps
Line Encoding Manchester 8B/6T
LAN access method CSMA/CD CSMA/CD
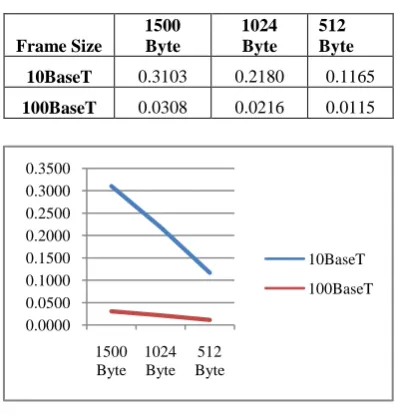
2. SIMULATION SCENARIOS
We have used following two simulation scenarios in our
[image:2.595.48.288.327.665.2]paper-Fig 2: Office network under 10BaseT
Fig 3: Office network under 100BaseT
In the figure 2 we use two hubs and a switch to connect 16 nodes. We use 10BaseT Ethernet wiring standard to simulate this network.
In the figure 3 we use two hubs and a switch to connect 16 nodes. We use 100BaseT Ethernet wiring standard to simulate this network.
3. OPNET SIMULATIONS FOR 10BaseT
& 100BaseT
We want to examine LAN’s performance under different Ethernet wiring standards with different frame size using Opnet simulator, the two Ethernet LANs were simulated. Ethernet 10BaseT with 16 nodes connected by two hubs and a switch, other is Ethernet 100BaseT with 16 nodes connected by two hubs and a switch.
3.1 Simulation Environment & Parameters
3.1.1 Common Parameters
Simulator- IT Guru Opnet Version- 9.1
Platform- Windows XP SP3 Network Coverage- 100x100 met No. of nodes- 16 systems
Hub 1- It is an Ethernet hub supporting up to 16 Ethernet connections. All the ports should be operating at the same speed (set based on the connected link). The possible link model choices are 10BaseT, 100BaseT or 1000BaseX. Note that the hub handles deference and collision detection for all the stations connected to it. Packets received by the hub are broadcast to all the stations regardless of the destination address on the packet. There is no queuing of packets in the hub itself as the processing time is considered to be zero. Hub 2- Same as hub 1.
Switch- It represents a switch supporting up to 16 Ethernet interfaces. The switch implements the Spanning Tree algorithm in order to ensure a loop free network topology. Switches communicate with each other by sending Bridge Protocol Data Units (BPDU's). Packets are received and processed by the switch based on the current configuration of the spanning tree.
[image:2.595.55.291.504.719.2]3.1.2 Parameters for nodes
Traffic Generation Parameters Start Time (Sec) - constant (5.0) ON State Time (Sec) - exponential (100) OFF State Time (Sec) - constant (10) Packet Generation Arguments
Inter arrival Time (Sec) - exponential (0.02) Packet Size (bytes) - uniform (46, 1500) for case1 Packet Size (bytes) - uniform (46, 1024) for case 2 Packet Size (bytes) - uniform (46, 512) for case 3 Segmentation Size (bytes) - No segmentation Running Time Parameters
Duration-2 Minutes Speed- 128
Value per statistics-100 Update Interval-100000 Events
3.2 Simulation Results
In simulation we take following statistics for different components which are there performance parameters- For Hub 1- Number of Collision Counts (should be less), Utilization (should be less depends upon collisions), Traffic Received (bps), Traffic Forwarded (bps), Filtered Traffic (bps) (should have high positive value).
For Hub 2 - Same as hub 1.
Switch- Traffic Received (bps), Traffic Forwarded (bps), Filtered Traffic (bps) (should have high positive value).
For a good performance of a standard (i.e. 100BaseT or 10BaseT) this filtered traffic should have high positive value.
[image:3.595.329.528.86.294.2]3.3 Comparisons of performance under
different Ethernet wiring standards with
different frame size
Table 3: Number of Collision Counts at Hub1 (Avg.)
Frame Size
1500 Byte
1024 Byte
512 Byte
10BaseT 152.66 72.97 20.54
100BaseT 1.81 1.23 0.68
Fig 4: Graphs for number of collision counts at Hub1
These graphs show collision count at hub1 under 10BaseT and 100BaseT for 1500, 1024, 512 Bytes of frame sizes.
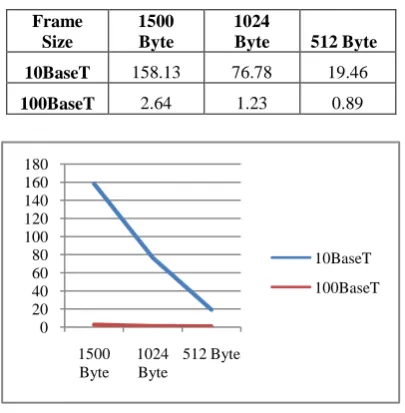
Table 4: Utilization of Hub1 (Avg.)
Frame Size
1500 Byte
1024 Byte
512 Byte
10BaseT 0.3103 0.2180 0.1165
100BaseT 0.0308 0.0216 0.0115
Fig 5: Graphs for Utilization of Hub1
[image:3.595.322.533.382.577.2]These graphs show utilization of hub1 under 10BaseT and 100BaseT for 1500, 1024, 512 Bytes of frame sizes.
Table 5: Traffic Received (kbps) at Hub1 (Avg.)
Frame Size
1500 Byte
1024 Byte
512 Byte
10BaseT 3100.94 2178.96 1165.10
100BaseT 3078.80 2160.89 1152.23
Fig 6: Graphs for Traffic Received (kbps) at Hub1
These graphs show traffic received at hub1 under 10BaseT and 100BaseT for 1500, 1024, 512 Bytes of frame sizes. We can see that at some points both curves overlap to each other it means traffic received at hub1 is approximately same at these points.
Table 6: Traffic Forwarded (kbps) by Hub1 (Avg.)
Frame Size
1500 Byte
1024 Byte
512 Byte
10BaseT 3100.94 2178.96 1165.10
0 50 100 150 200
1500 Byte
1024 Byte
512 Byte
10BaseT
100BaseT
0.0000 0.0500 0.1000 0.1500 0.2000 0.2500 0.3000 0.3500
1500 Byte
1024 Byte
512 Byte
10BaseT 100BaseT
0.00 500.00 1000.00 1500.00 2000.00 2500.00 3000.00 3500.00
1500 Byte
1024 Byte
512 Byte
[image:3.595.65.270.500.697.2]Fig 7: Graphs for Traffic Forwarded (kbps) by Hub1
[image:4.595.323.536.85.230.2]These graphs show traffic forwarded by hub1 under 10BaseT and 100BaseT for 1500, 1024, 512 Bytes of frame sizes. We can see that at some points both curves overlap to each other it means traffic forwarded by hub1 is approximately same at these points.
Table 7: Number of Collision Counts at Hub2 (Avg.)
Frame Size
1500 Byte
1024
Byte 512 Byte
10BaseT 158.13 76.78 19.46
100BaseT 2.64 1.23 0.89
Fig 8: Graphs for number of collision counts at Hub2
These graphs show collision count at hub2 under 10BaseT and 100BaseT for 1500, 1024, 512 Bytes of frame sizes.
Table 8: Utilization of Hub2 (Avg.)
Frame Size
1500 Byte
1024
Byte 512 Byte
10BaseT 0.3115 0.2213 0.1172
100BaseT 0.0315 0.0221 0.0114
Fig 9: Graphs for Utilization of Hub2
[image:4.595.327.529.306.519.2]These graphs show utilization of hub2 under 10BaseT and 100BaseT for 1500, 1024, 512 Bytes of frame sizes.
Table 9: Traffic Received (kbps) at Hub2 (Avg.)
Frame Size
1500 Byte
1024
Byte 512 Byte
10BaseT 3112.42 2212.24 1171.74
100BaseT 3151.36 2206.72 1144.63
Fig 10: Graphs for Traffic Received (kbps) at Hub2
These graphs show traffic received at hub2 under 10BaseT and 100BaseT for 1500, 1024, 512 Bytes of frame sizes. We can see that at some points both curves overlap to each other it means traffic received at hub2 is approximately same at these points.
Table 10: Traffic Forwarded (kbps) by Hub2 (Avg.)
Frame Size
1500 Byte
1024
Byte 512 Byte
10BaseT 3112.42 2212.24 1171.74
100BaseT 3151.36 2206.72 1144.63
0.00 500.00 1000.00 1500.00 2000.00 2500.00 3000.00 3500.00
1500 Byte
1024 Byte
512 Byte
10BaseT 100BaseT
0 20 40 60 80 100 120 140 160 180
1500 Byte
1024 Byte
512 Byte
10BaseT 100BaseT
0 0.05 0.1 0.15 0.2 0.25 0.3 0.35
1500 Byte
1024 Byte
512 Byte
10BaseT
100BaseT
0 500 1000 1500 2000 2500 3000 3500
1500 Byte
1024 Byte
512 Byte
[image:4.595.66.269.344.551.2]Fig 11: Graphs for Traffic Forwarded (kbps) by Hub2
[image:5.595.315.544.85.233.2]These graphs show traffic forwarded by hub2 under 10BaseT and 100BaseT for 1500, 1024, 512 Bytes of frame sizes. We can see that at some points both curves overlap to each other it means traffic forwarded by hub2 is approximately same at these points.
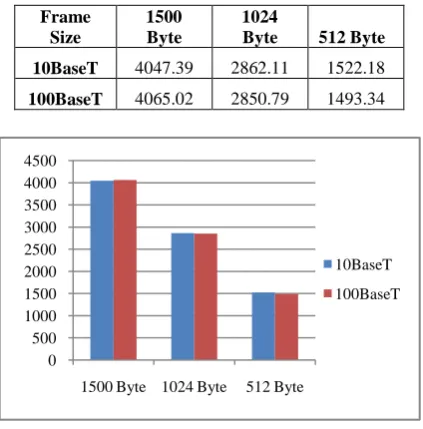
Table 11: Traffic Received (kbps) at Switch (Avg.)
Frame Size
1500 Byte
1024
Byte 512 Byte
10BaseT 4047.39 2862.11 1522.18
100BaseT 4065.02 2850.79 1493.34
Fig 12: Graphs for Traffic Received (kbps) at Switch
These graphs show traffic received at switch under 10BaseT and 100BaseT for 1500, 1024, 512 Bytes of frame sizes.
Table 12: Traffic Forwarded (kbps) by Switch (Avg.)
Frame Size
1500 Byte
1024
Byte 512 Byte
10BaseT 2165.96 1529.08 814.65
100BaseT 2165.13 1516.81 803.53
Fig 13: Graphs for Traffic Forwarded (kbps) by Switch
[image:5.595.313.555.323.554.2]These graphs show traffic forwarded by switch under 10BaseT and 100BaseT for 1500, 1024, 512 Bytes of frame sizes.
Table 13: Filtered Traffic (kbps) by Switch (Avg.)
Frame Size
1500 Byte
1024 Byte
512 Byte
10BaseT 1881.43 1333.03 707.53
100BaseT 1899.89 1333.98 689.81
Fig 14: Graphs for Filtered Traffic (kbps) by Switch
These graphs show filtered traffic by switch under 10BaseT and 100BaseT for 1500, 1024, 512 Bytes of frame sizes. We can see that initially filter traffic is more in case of 100BaseT for 1500 Bytes of frame size, for 1024 Bytes it is approximately same. For 512 Bytes of frame size the switch under 10BaseT has filtered more traffic than 100BaseT, it means the performance of 10BaseT standard is become good here, this is the main outcome of our work.
4. CONCLUSION
The performance of a LAN under different Ethernet wiring standards having different frame size are compared and some of the observations from the experiment are:
0 500 1000 1500 2000 2500 3000 3500
1500 Byte1024 Byte 512 Byte
10BaseT 100BaseT
0 500 1000 1500 2000 2500 3000 3500 4000 4500
1500 Byte 1024 Byte 512 Byte
10BaseT
100BaseT
0 500 1000 1500 2000 2500
1500 Byte 1024 Byte 512 Byte
10BaseT 100BaseT
0 500 1000 1500 2000
1500 Byte
1024 Byte
512 Byte
10BaseT
[image:5.595.62.274.352.567.2]a) The numbers of collision count in 10BaseT are always more than 100BaseT for all frame sizes, because of the nature of this standard (10BaseT).
b) The hubs are more utilized in case of 10BaseT for all frame sizes, because of more retransmission attempts due high number of collisions in 10BaseT.
c) The performance of switch is good for 100BaseT wiring standard, when frame size is 1500 Bytes because it filters more traffic. When frame size is 1024 Bytes, filtered traffic is approximately same for both 10BaseT and 100BaseT standards. When frame size is further reduces to 512 Bytes, we get a shocking result the performance of 10BaseT becomes good because it filters more traffic than 100BaseT. So final conclusion is that if we have a LAN in which high traffic is not required and we fix maximum frame size to 512 Bytes, 10BaseT will give us good result and performs better as compare to 100BaseT Ethernet wiring standard as we find out in our simulations (refer Table 13).
There is also a drawback related to 512 Bytes of frame size, if we fix frame size to 512 bytes in a LAN, then that LAN will not able to transfer more traffic per seconds (traffic receiving & forwarding is less), we cannot use this in heavy traffic LANs (refer Table 11 and 12).
5. FUTURE WORK
This paper can be further extended to calculate the performance of LAN under other different standards i.e. 1000BaseT with more frame sizes because when we change the Ethernet standard and frame size the results are different in those scenarios.
6. ACKNOWLEDGEMENTS
We are very thankful to our faculty members, and colleagues they guide us how to publish a paper. Without their valuable guidance this task was not possible.
7. REFERENCES
[1] Ikram Ud Din, Saeed Mahfooz, Muhammad Adnan, “Performance Evaluation of Different Ethernet LANs Connected by Switches and Hubs”, European Journal of Scientific Research ISSN 1450-216X Vol.37 No.3 (2009), pp.461-470.
[2] Mohd Nazri Ismail and A.M. Zin. "A Simulation Model Design and Evaluation for Aggregate Traffic Over Local Area Networks", International Journal of Advanced Computer Engineering IJACE 2009.
[3] Mohd Ismail Nazri and A.M. Zin. "Measurement and Characterization of Network Traffic Utilization between Real Network and Simulation Modeling in Heterogeneous Environment", IJCSN International Journal of Computer Science and Network Security, 2008. Vol. 8(3).
[4] Farkas J., Antal C., Westberg L. and Paradesi A., “Fast Failure Handling in Ethernet Networks”, IEEE International Conference on Communication (ICC) 15 June 2006.
[5] Saeed A. Bawazir and S.H. Al-Sharaeh. "Performance of Infrastructure Mode Wireless LAN Access Network
Based on OPNETTM Simulator", Saudi Technical Conference and Exhibition 2006.
[6] S. Kabir, S. Khatun, M. K. Abdullah, M.A. Mahdi and S. B. A. Anas, “Throughput Analysis of an Enhanced CSMA/CD Based Single Channel Fast Ethernet Optical LAN”, International Conference on Advance Communication Technology (ICACT) 2005.
[7] R. M. Daud, H. M. Elsayed and H. H.. Amer, “Performance of Fast and Gigabit Ethernet in Networked Control System”, 46th IEEE International Midwest Symposium on Circuit and System 2003.
[8] Xinjie Chang, “Network simulations with OPNET”, IEEE Conference Publications of Simulation Conference Proceedings, 1999 Winter.
[9] John F. Schoch and Jon A. Hupp. “Measured performance of an Ethernet Local Network”,Communications of the ACM 23(12):711-721, December, 1980.
[10]Alteon Networks, “Extended Frame Sizes for Next Generation Ethernets”, A White Paper.
[11] B. A. Forouzan, “Data Communication & Networking” 4th Edition 2006: Tata McGraw Hill.
[12] William Stallings, “Data and Computer Communications” 8th Edition 2006: Pearson Education. [13] Martin J. Duggan and Maurilio P. Gorito, “CCIE Routing
and Switching Practice Labs” 1st Edition 2004: Cisco Press.
[14] Daniel Minoli, Peter Johnson and Emma Minoli, “Ethernet-based Metro Area Networks”, 1st
Edition 2002: McGraw-Hill.
[15] Othma Kyas, “Network Troubleshooting”, Agilent Technology, Jan. 2002
[16] Todd Lammle, “Cisco Certified Network Associate Study Guide” 2nd Edition 2000: SYBEX , Inc., Alameda, CA.
[17] Charles Spurgeon and Chuck Toporek, “Ethernet: The Definitive Guide”, 1st Edition 2000: O’Reilly & Associates
[18] www.opnet.com
[19] 100Base-T Definition. http://www.linfo.org / 100baset. html
[20] Laboratory Assignment - Network Simulation using OPNET. Available at < www.staff.city.ac.uk /~veselin/ Opnet /EPM775_lab.pdf >
[21] Lab 0 Getting Started with OPNET IT Guru Academic Edition. Available at <www.cec.shfc.edu.cn/ download /20091118200338 _933117101942.pdf >