http://dx.doi.org/10.4236/cus.2014.23017
Future Growth Trend & Potential
Residential Area Identification of a City:
A Case Study of Chittagong
Panini Amin Chowdhury
Department of Urban & Regional Planning, Chittagong University of Engineering & Technology, Chittagong, Bangladesh
Email: [email protected]
Received 20 June 2014; revised 18 July 2014; accepted 14 August 2014
Copyright © 2014 by author and Scientific Research Publishing Inc.
This work is licensed under the Creative Commons Attribution International License (CC BY).
http://creativecommons.org/licenses/by/4.0/
Abstract
Urban expansion has become a popular word nowadays. For sustainable development strategy and efficient city management, the growth pattern analysis of the city is a pre requisite. Urban ex-pansion is a dynamic process and is a difficult task to create a uniform growth pattern model. At the same time for developing new strategies it is necessary to sort out the present land use state and also figure out some locations for future expansion. But for this a huge scale of data is re-quired with efficient maintenance system. Chittagong, the port city of Bangladesh has vast oppor-tunity to become tycoon in the tourism and industrial sector of South Asia. But it is a pity that it doesn’t have any growth pattern analysis for future development. The aim of this paper is to de-velop a map referring to the growth pattern and direction of the city according to the growth pole and growth centers of the city and create a map containing the existing land use of the city. Identi-fication of some locations for future residential area development by secondary source data is also a goal of this paper. For developing an overall sustainable city development policy these data are must for the efficiency and functionality of those policies.
Keywords
Growth Centers, Growth Pole, Growth Trend, Land Use, Future Residential Area Identification
1. Introduction
popula-tion of over 4.5 million, making it the second largest city in the country (DPZ, 2007). The city started its journey in an organic manner and later it was divided into 12 DPZ (detailed planning Zone) for future development. To-day, Chittagong is one of the fastest growing cities in the world. As a major commercial and industrial center, the city also has a globally competitive special economic zone. With the Port of Chittagong being expanded and developed, regional neighbors of Bangladesh have eyed Chittagong as a future regional transit hub. The port city is seen as crucial to the economic development of landlocked southern Asia including Northeast India, Bhutan, Nepal and parts of Southern China and Burma. Chittagong has been contributing to the national economy since the independence of the country in 1971 (DPZ, 2007). The major economic establishments/resources are (1) Chittagong port; (2) Lots of garments industries; (3) Huge numbers of medium and heavy industries (industrial belt at Fouzdarhat, Baizid Bostami, Kalurghat Industrial and Patenga Industrial Area); (4) Natural beauties such as the Patenga Sea Beach, Batali Hill, Foy’s Lake, Karnaphuly river bank, court building, and circuit house etc. (DPZ, 2007). The city is playing a significant role in the development of tourism industry in Bangladesh and the total sub-continent region. Chittagong is a land on huge Natural Beauty; here there are natural gifts like Hilly region, the Bay of Bengal and the Karnaphully River. These beautiful natural features can be potentially devel-oped with modern Tourist Facilities, which can attract local as well as foreign tourists in the city and surround-ing areas. This would obviously enhance the tourism industry along with small and medium size industrial ac-tivities in the whole region, where huge employment opportunities could be generated at the same time.
2. Study Area Profile
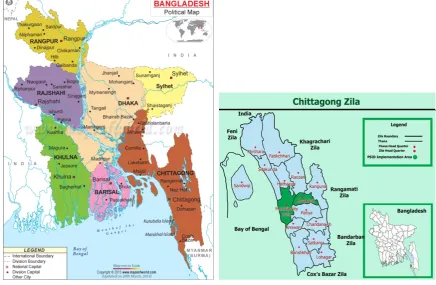
Chittagong is the main seaport and the second largest city of Bangladesh. It is located on the North bank of the Karnaphuli River, along the coast of the Bay of Bengal, in South-East Bangladesh. Bay of Bengal is in the West side, Cox’s bazar is in the South side, Chittagong hill tracts area is in the East and Feni river is located at the North side of Chittagong city (Figure 1). It has an estimated population of 4.5 million in an area of about 184 sq. km [1].
3. Methodology
[image:2.595.93.530.423.708.2]For this paper mainly the secondary source data has been used for calculation. These data were collected from
Chittagong City Corporation, Chittagong development authority, Local government Engineering Department etc. According to the data the growth of the city is analyzed. For this at first the growth pole and growth centers of the city are figured out, then by analyzing their future potential and present state a map is prepared showing the overall growth of the city. In the same way according to the secondary source data a map is prepared containing the present land use condition of this locality. For map preparation Arc GIS 9.3 and Corel Draw X5 software’s were used.
4. Analysis
According to the analysis it is found that the city mainly expands towards the Dhaka region. The pattern can be developed in 2 direction based on the artery national highway of Chittagong. One direction can be to the comilla region through Salimpur, Barihari, Kumira and Sitakunda. And another growth can be through Fatikchari, Kan-channagar and Dharmapur. In future, Dhaka and Chittagong may merge together and there is that opportunity also. In the internal development the city is mainly based on 5 industrial areas.
They are:
Kalurghtat Export Zone.
Nasirabad Solosahar Export Zone.
Fouzdarhat Industrial Zone.
Export Processing Zone.
Patenga Industrial Area (Land Use Report, 2005).
At first to analyze the overall development the growth center of this district needs to be figured out. For this, the following map is considered as a standard.
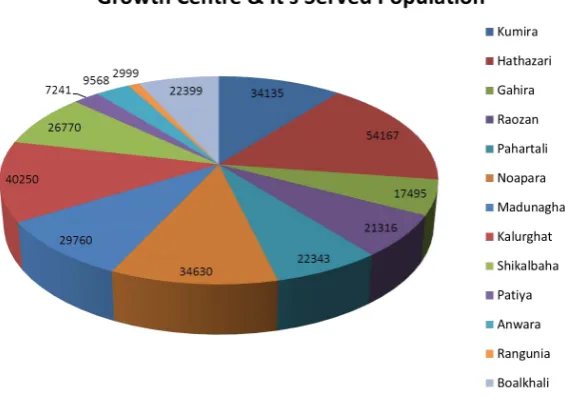
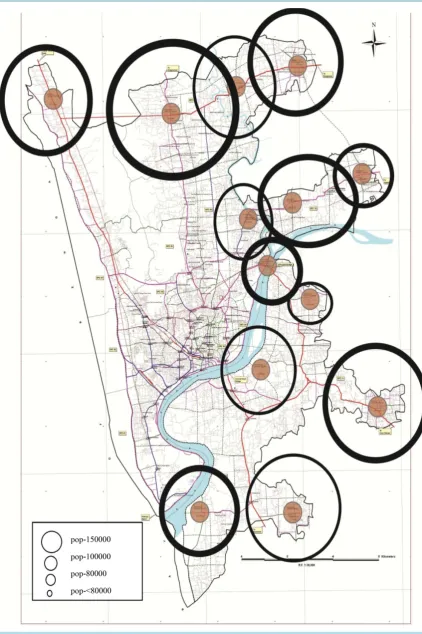
For this at first a chart showing the growth centers of Chittagong with population is given in Figure 2. From the graph it is shown that the most populated growth center of Chittagong is Hathazari and the least is Rangunia. The reason of Hathazari for being so populated is Chittagong University and its adjacent economic activities. A map with area of influence is givenin Figure 3.
From the growth center the overall growth pole of the division is then sorted out which is shown in Figure 4. The growth pole of Chittagong comprises of the growth centers and the major roads.
Hathazari is the largest (population more than 50 thousand) & Rangunia is the smallest (population about 30 thousand) on the basis of population (Land Report, 2010).
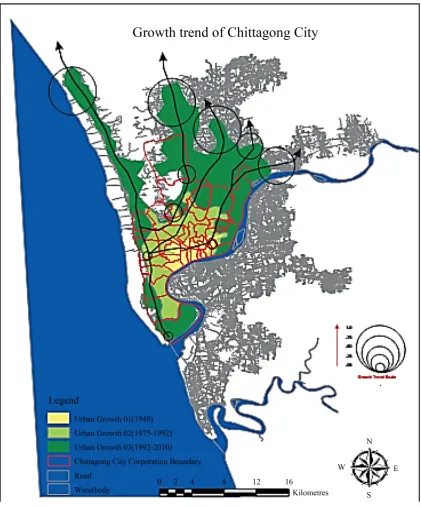
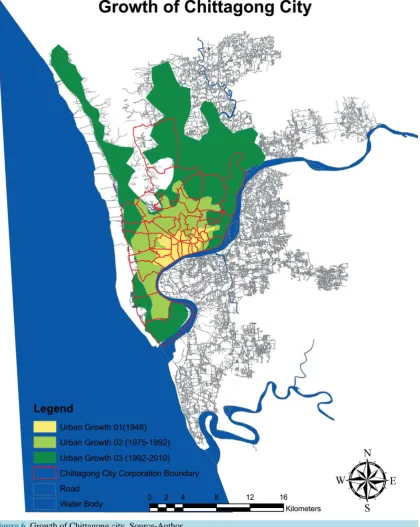
[image:3.595.167.450.506.706.2]From the growth pole the overall growth trend of the city is set up (Figure 5, Figure 6). From the map it is quite evident that the overall development of this division is mainly on the North West and on the North East direction. The North East direction is blocked by Khagrachari hilly area. So the overall possibility of the future growth of this city is North West region which actually heads towards the direction of Dhaka.
Figure 4. Growth pole of the growth centers of Chittagong city. Source-Author.
during the 1975 to till now [1]. Few growths were also observed at the South side of the Karnafully River. But then the development turned to the North West direction. The main factor behind this is the economic develop-ment of Comilla, Feni, Fouzdarhat region and the big industries setting up there (Land Report, 2010).
Land Use of Chittagong City
Another important thing which is very much interrelated to the growth of the city is the land use of this city. For this the population growth rate of the city is needed to know.
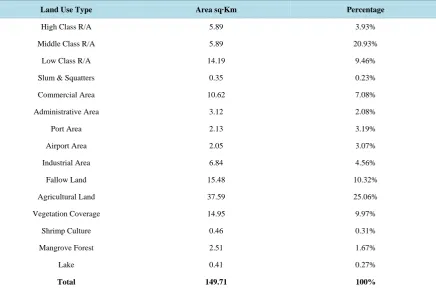
[image:6.595.103.525.196.704.2]Now a land use percentage of the overall city is given in Table 1, Figure 7.
Figure 6. Growth of Chittagong city. Source-Author.
From the chart it is quite evident that agriculture, lower class residential and vegetation is the top three priori-ties among the overall land use of this city.
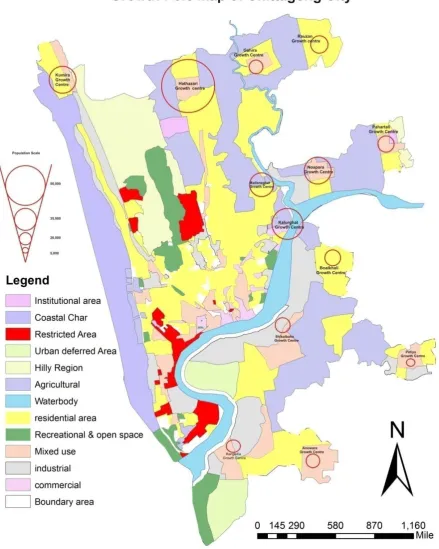
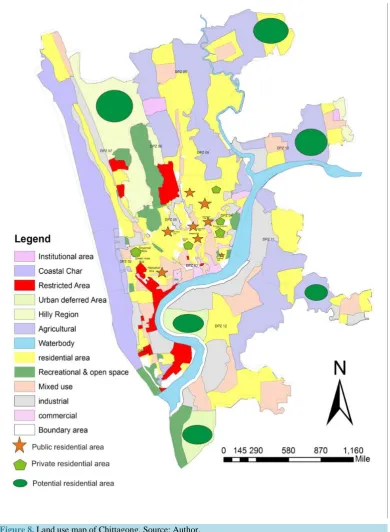
Here a map containing the overall land use and also with identification of potential residential areas which are indicated on the Detailed planning zone guidelines of CDA (Chittagong Development Authority) is given in Figure 8.
[image:7.595.107.528.94.622.2]Table 1. Land use percentage.
Land Use Type Area sq∙Km Percentage
High Class R/A 5.89 3.93%
Middle Class R/A 5.89 20.93%
Low Class R/A 14.19 9.46%
Slum & Squatters 0.35 0.23%
Commercial Area 10.62 7.08%
Administrative Area 3.12 2.08%
Port Area 2.13 3.19%
Airport Area 2.05 3.07%
Industrial Area 6.84 4.56%
Fallow Land 15.48 10.32%
Agricultural Land 37.59 25.06%
Vegetation Coverage 14.95 9.97%
Shrimp Culture 0.46 0.31%
Mangrove Forest 2.51 1.67%
Lake 0.41 0.27%
Total 149.71 100%
Source: Chittagong City Corporation (CCC), 2005.
Figure 7. Population growth of the city from 1961-2001. Source: DPZ, CDA.
of the city. Again it is found that the North East and South East direction of the city is bounded by the Bay of Bengal. No potential residential area is found in the south west direction. So if these potential areas are built up, not any alternative is left than to move to the North West direction for future residential developments. So from the land use it is again proved that the overall future growth pattern of this city will be in the North West direc-tion.
5. Findings
1. The overall development of Chittagong city is in the North West direction.
2. Among the growth centers Hathazari is the most influential in respect of economic activities and popula-tion.
3. Still agriculture is the prime user of land of this region.
1961364,205 1974 1981 1991 2001
889,760
1,391,877
2,348,428
3,202,710
1 2 3 4 5
[image:8.595.174.459.423.570.2]Figure 8. Land use map of Chittagong. Source: Author.
4. DPZ 02, 03, 04 & 05 contain some public & private residential area which are located in the center of the city. 5. DPZ 7, 10, 11, 12 can be considered most influential for future development especially for residential perspective. Among them DPZ-7 is the most promising for long term service.
6. Conclusion
encourage converging to the center city. As a result this type of converging development takes place. Again for the sustainable development it is really necessary to identify some locations for future development of the city. This paper aims to fulfill these needs and as a successful outcome some potential areas for developments and the overall growth pattern of the city is found. For developing policy this paper will help for future planning strate-gy.
Acknowledgements
For this paper at first I want to thank Almighty Allah, the most gracious and merciful for helping me to complete this paper. I want to thank my classmates especially mostakim Ali sony and seniors who help me to collect these data and also permit me to use it on my research purpose. I want to specially thank Debashis roy sir, Bayes Ahmed sir, Ali Ashraf sir and mostly my family members for their continuous support and inspiration.
References
BSS (2010). Annual Land Report.
CDA (2007). Detailed Planning Zone (DPZ) Report.