QoS aware Routing Scheme for AODV Protocol based
on Traffic Priority in Wireless Sensor Networks
Sunil Kumar Kaushik
11
Department of Computer Sc. & Engg. , HCTM Technical
Campus, Kaithal -136027, Haryana, India
Ruchi Aggarwal
22
Department of Computer Sc. & Engg. , HCTM Technical
Campus, Kaithal -136027,
Haryana, India
Gurmeet Singh Attari
33
Department of Information Tech., MMEC, Mullana -133203,
ABSTRACT
The most predicament issue that happens in WSN is Congestion. Congestion causes packet loss, which in turn reduces throughput and energy efficiency. Therefore congestion in WSN’s needs to be controlled for high energy-efficiency, to prolong system lifetime, improve fairness, and improve quality of service (QoS) in terms of throughput (or link utilization) and packet loss ratio along with the packet delay. The main focus of this paper is to provide modification in an existing system working with DSR (Dynamic Source Routing).This paper proposes modifications in the protocol of the existing system as AODV (Ad-Hoc on Demand Distance Vector). Proposed protocol provides an efficient way to overcome congestion in wireless cluster sensor network. Proposed algorithm provides priority both on data and location.
General Terms
QoS, Algorithms, Congestion
Keywords
Wireless sensor networks (WSN), Priority, and Ad-Hoc on Demand Distance Vector (AODV)
1.
INTRODUCTION
We A Wireless Sensor Network (WSN) [1] consists of spatially distributed autonomous sensors to cooperatively monitor physical or environmental conditions, such as temperature, sound, vibration, pressure, motion or pollutants. The development of wireless sensor networks were motivated by military applications such as battlefield surveillance and is now used in many industrial and civilian application areas, including industrial process monitoring and control, machine health monitoring, environment & habitat monitoring, healthcare applications, home automation, and traffic control. In surveillance applications, sensors are deployed in a certain field to detect and report events like presence, movement, or intrusion in the monitored area. As shown in fig. 1 Data collected by sensors are transmitted to a special node equipped with higher energy and processing capabilities called “processing node” (PN) or “sink”. The PN collects, filters, and compiles data sent by sensors in order to extract useful information.Due to recent technological advances, the manufacturing of small and low cost sensors became technically and economically feasible. The sensing electronics measure ambient conditions related to the environment surrounding the sensor and transform them into an electric signal. Processing such a signal reveals some properties about objects located and/or events happening in the vicinity of the sensor.
A large number of these disposable sensors can be networked in many applications that require unattended operations. A Wireless Sensor Network (WSN) contains hundreds or thousands of these sensor nodes. These sensors have the ability to communicate either among each other or directly to an external base-station (BS). Sensor nodes can be used to collect information from the environment, locally process this data and transmit the sensed data back to the user. Basically, each sensor node comprises sensing, processing, transmission, mobilize, position finding system, and power units. These nodes collect and transmit the information. Under light load the data traffic in the network is light. When an event has been detected, the load becomes heavy and the data traffic increases. This might lead to congestion.
Figure 1: Sensor Network Architecture
when a node wants to send something to a destination it sets the whole route for that packet, indicating the addresses of the terminals it has to pass through. In this sense all packets have a DSR header included, and it is needed that all nodes within the Ad-Hoc network know the whole network topology.On the other hand, AODV is a rigid protocol. It does not perform source routing at all; when a terminal wants to send something to a destination, it checks its routing table, looking for the next hop towards that destination, and sends the packet to it, and so on. In this sense, data packets "travel" through the Ad-Hoc network without any AODV specific information
.
In this paper, an algorithm Priority Based Traffic Load Reduction Algorithm (PBTR) is proposed. Proposed algorithm provides an efficient way to overcome congestion in wireless cluster sensor network. It provides priority both on data and location. We propose a data delivery protocol along high congested areas. We divide the network into various clusters and every cluster has a cluster head which receive data from all its neighbor sensor nodes and transmit it to sink. Our Approach is divided into two phases. In the first phase we provide priority on data. If a sensor node has some data to forward it will check congestion on the network. If network is congested then sender will check which type of data is it? If it is critical task then it will forward that data through some dedicated path. If it is routine data or information message then information message will be given higher priority. In the second phase of our approach we provide location based priority. Sometimes it becomes necessary to send data to some regions prior to other regions. In this phase we provide priority on clusters. If a cluster has higher priority than other, then it will receive data prior to others. The rest of the paper is organized as follows. In Section 2, a related work is discussed. In section 3, Priority Based Traffic Load Reduction Algorithm is proposed and described. In section 4, Simulation results are presented. Section 5 concludes the paper with conclusion.2.
RELATED WORK
All WSNs is rapidly changing the way by which data are captured, processed and disseminated for a variety of potential applications for home, hospitals, factory shop floors, road traffic, battlefields, and so on. As with any other new technological development, there exist many research issues and technical challenges relating to sensor nodes, networks and applications which are as follows.Li Qun Zhuang et al. provided various issues in data management in wireless sensor network. It provided various issues including node deployment and dynamics of sensor network and gives an efficient way to deal with those issues [1]. D.Baghyalakshmi et al. worked on low latency and energy efficient routing protocols for wireless sensor networks. They proposed a hierarchical routing model in which wireless sensor network is divided into various levels (clusters) including simple nodes , first level clustered head and second level clustered head. Here data sensed by sensor nodes is first transmitted to their cluster heads cluster head then send this data to it upper level and this process continues until data is reached to sink or destination node [2].Feng Wang et al. proposed a better approach for data collection in WSN. It is based on clustering and aggregating approach. In this cluster head collects data from sensor nodes and perform aggregating of data based on average, max and min approach. This approach minimizes data to be transmitted and hence result in saving energy [3]. Xiaoxia Ren et al. also provided QoS issues in wireless sensor network. Data sensing and reporting in WSNs is dependent on the application and the time criticality of the data reporting.
They proposed three approaches in data reporting to sink .These are continuous, event driven and query based. In event driven data reporting model sensor node will send data to sink whenever an event is detected by sensor node. In continuous approach sensor node will transmit data to sink continuously after a foxed period of time. In query based approach sink will send a query to sensor. After receiving query sensor will give response to sink [4]. Rajashree.V.Biradar et al. proposed various types of routing protocols used by sensor network [5].Rob Hoes et al. proposed a method for managing quality of service in wireless sensor network when sink is mobile. In most of applications sink is mobile for example in disaster management system. Usually when sink moves, tree likely breaks and needs to be fixed. In this paper they described an algorithm for tree reconstruction that is able to trade the cost of reconfiguration in terms of time and energy, for the quality of the new tree measured by the average path length. The algorithm selectively reconfigures a local area around the sink of which the size can be adjusted, while guaranteeing that a correctly rebuilt tree results [6]. R. Then Malar proposed congestion control protocol based on priority approach. This protocol is known as priority based congestion control protocol (PCCP). PCCP employs packet-based computation to optimize congestion control for a WSN. It measures the congestion degree as the ratio of packet inter-arrival time and packet service time. In PCCP node priority index is used to reflect the importance of each sensor node based on congestion degree and node priority index. PCCP achieves efficient. Congestion control and flexible weighted fairness for both single-path and multi-path routing [7]. Edward Casey and Gabriel-Mire Muntean proposed a priority based adaptive scheme for wireless multimedia delivery. In wireless multimedia streaming, there is a need to allow for client prioritization in order to enable provision of end user perceived quality in direct relationship with client device importance [8]. Priority based work also carried out authors in [9, 11, 12] also. We also propose an algorithm that is Priority Based Traffic Load Reduction Algorithm (PBTR). Proposed algorithm provides an efficient way to overcome congestion in wireless cluster sensor network to improve the QoS.
3.
THE PROPOSED MODEL
Detailed designing of routing algorithm is described in this section. The protocol consists of two phases- priority decision phase and route selection phase. Explanation of PBTR is based upon these phases. The description of the same is as follows:
3.1
Priority decision phase
If a sensor node has some data to forward it will check congestion on the network. If network is congested then sender will check which type of data is it? If it is critical task then it will forward that data through some dedicated path. If it is routine data or information message then information message will be given higher priority.
3.2
Route selection phase
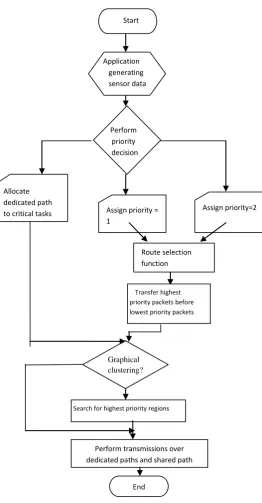
Figure 2: Flow Chart of Proposed Algorithm
3.3
Proposed Algorithm
1) Start the sensor node to generate data. 2) Perform priority decision:
If data is Critical Task, allocate dedicated path to the critical task and go to step 5.
If data is Routine Data, assign 1st priority and go to step 3.
If data is Information Message, assign 2nd priority and go to step3.
3) Select the route using route selection function.
4) Transfer highest priority data before the lowest priority data.
5) Check the geographical clustering:
If geographical clustering is done go to step6.
If there is no geographical clustering, search for the highest priority regions and go to step 6.
6) Perform transmission over dedicated and shared paths 7) End.
4.
SIMULATION AND ANALYSIS
[image:3.595.28.291.74.578.2]We use Ns2 (Network simulator) [10] to implement our protocol. AODV is used for our new approach. Simulations were conducted in the topography area of 670 m x 670 m and the number of nodes used is 50. The traffic type is CBR (constant bit rate). The BS is fixed and located at the center of the network. Radio Propagation Model is Two-Ray ground Model. MAC Type is 802.11.Mac Layer. Antenna Type is Omni directional.
Table 1 Simulation Scenario
Parameter Value
Number of Nodes 50
Topography Dimension 670 m x 670 m
Traffic Type CBR
Radio Propagation Model Two-Ray Ground Model
MAC Type 802.11.Mac Layer
Packet Size 512 bytes
Mobility Model Random Way Point
Antenna Type Omni directional
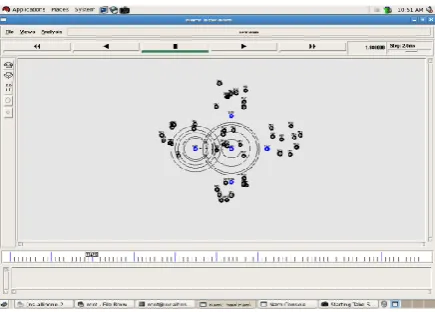
We discuss simulation scenario in table 1. Used by priority based approach and simple cluster network without priority based approach. We create a simple wireless cluster sensor network of 50 nodes. Network is divided into 5 clusters of 10 nodes each. Each cluster has cluster head. Blue nodes in the network represent cluster heads. If a node in one cluster wants to communicate with a node in another cluster; it can communicate only through cluster head. We simulate simple wireless cluster sensor network in ns2.34. Simulation scenario used for simple wireless cluster sensor network is shown in table 1. Now the data transmission in simple wireless sensor networks does not provide any priority on data. As shown in figure 3, Data transmission in simple wireless cluster network without priority leads to congestion. For the simulation of proposed algorithm we use same scenario as used for the simulation of simple wireless cluster sensor network. Simulation scenario used for proposed algorithm is shown in table1. We assume that cluster with nodes in blue color wants to send data to clusters with green, yellow, red and black color
Start
Application generating
sensor data
Perform priority
decision
Allocate dedicated path
to critical tasks Assign priority =
1
Assign priority=2
Route selection function
Transfer highest priority packets before lowest priority packets
Graphical clustering?
Clustering ?
Search for highest priority regions
Perform transmissions over dedicated paths and shared path
[image:3.595.342.529.274.553.2]as shown in figure 4. Cluster head in sender cluster will check priority of receiving clusters. Cluster with higher priority will receive data prior to other clusters. We assume that cluster with nodes in blue color wants to send data to clusters with green, yellow, red and black color.
[image:4.595.316.557.77.241.2]
Figure 3: Data Transmission in Simple Wireless Cluster Network
Cluster head in sender cluster will check priority of receiving clusters. Cluster with higher priority will receive data prior to other clusters. Cluster with Red color has highest priority. Cluster with Black color has 2nd highest priority. Cluster with Green color has 3rd highest priority and cluster with yellow color has lowest priority.
.
[image:4.595.56.274.131.287.2]
Figure 4: Data Transmission for Proposed algorithm
5.
Result and Discussion
Performance of PBTR is evaluated with the help of AODV. Performance Evaluation Matrices for Proposed Algorithm is given below.
5.1
Throughput
Throughput can be defined as number of packets sends in 1 second by the system. Figure 5 below shows rate of sending packets and Figure 6 shows the rate of received packets.
Figure 5: Rate of sending packets
The figure says that the sending rate of the system is either constant or at the peak level between the simulation time 60-70.
Figure 6: Rate of Received packets
As far as the efficiency concerned, the receiving rate of the packets are either at higher levels or at peak between the simulations time 60-130.
5.2
Jitter
Jitter is a variation in packet transit delay caused by queuing, contention and serialization effects on the path through the network. Basically it is an unwanted situation. Figure 7 shows the jitter of sent packets and Figure 8 shows the jitter of the received packets.
[image:4.595.55.279.406.569.2] [image:4.595.316.549.607.726.2]Figure 7 shows that sequencing of all packets is of much importance. Jitter is a big issue that must be resolved. As the time increases packet sending time ratio becomes negligible.
Figure 8: Jitter of received packets
Figure 8 shows that as the number of packet increases and also the simulation time, the ratio to receive the packets becomes strong.
5.3 Number of Packets
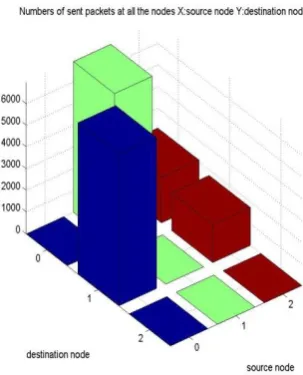
Figure 9 below represents number of all sent packets by all the 50 nodes in the network. Figure 10 shows all the packets received by the network.
[image:5.595.58.293.144.328.2]In Figure 9 and 10, X is the source node and Y is the destination node. The ratio of sending and receiving packets are almost equal. It shows the effect of AODV protocol which ensures the efficiency.
Figure 9: Number of sent packets at all nodes
Figure 10: Number of received packets by all nodes
6.
Comparison of Performance Evaluation
Matrices for Proposed Algorithm and
Simple Wireless Cluster Sensor Network
6.1
Packet Rate
Figure 11 below shows comparison of packet rate for proposed algorithm and simple wireless cluster sensor network. Red curve indicates packet rate for proposed algorithm and green curve indicates packet rate for simple wireless cluster sensor network. From this figure it is clear that packet rate for proposed algorithm is greater than packet rate for simple wireless cluster sensor network, so wireless cluster sensor network using priority based approach is more efficient than simple wireless cluster sensor network.
6.2
End-to End Delay
[image:5.595.96.248.531.719.2]Figure 12 shows comparison of end to end delay for proposed algorithm and simple wireless cluster sensor network. Green line represents end to end delay for proposed algorithm and red line represents end to end delay for simple wireless cluster sensor network. Our proposed algorithm has low end to end delay as compared to simple wireless cluster sensor network, so our proposed algorithm is more efficient than simple wireless cluster sensor network.
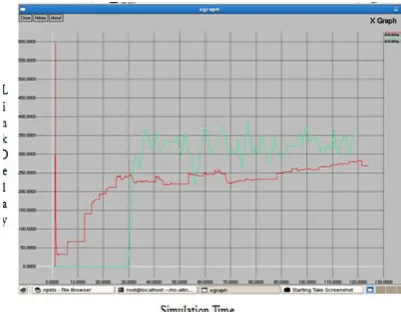
[image:5.595.319.537.547.712.2]Figure 12: Comparison of link delay for proposed algorithm and simple wireless cluster network
6.3 Link Delay
Figure 13 below represents comparison of link delay for proposed algorithm with simple wireless cluster sensor network. Red curve represents proposed algorithm and green curve represents simple wireless cluster sensor network. Initially our approach has higher delay but once packets start transmitting over network, link delay reduces. From this figure it is clear that our approach has low link delay as compared to link delay for simple wireless cluster sensor network, so proposed algorithm is more efficient than simple wireless cluster sensor network.
6.4
Throughput
Figure 14 represents comparison of throughput for proposed algorithm and simple wireless cluster sensor. Green curve representsproposed algorithm and red curve simple wireless cluster sensor network. From this graph it is clear that throughput of proposed algorithm is more as compared to throughput of simple wireless cluster sensor network, so proposed algorithm is more efficient.
Figure 13: Comparison of Link Delay for Proposed algorithm with Simple Wireless Cluster Sensor Network
Figure 14: Comparison of Throughput for Proposed algorithm and Simple Wireless Cluster Sensor Network
7. CONCLUSION
[image:6.595.335.557.72.251.2] [image:6.595.74.275.531.687.2]8. REFERNCES
[1] Li Qun Zhuang, Jing Bing Zhang, Dan Hong Zhang and Yi Zhi Zhao “Data Management for Wireless Sensor Networks: Research Issues and Challenges” International Conference on Control and Automation (ICCA2005), Budapest, Hungary, June 27-29, 2005.
[2] D.Baghyalakshmi, Jemimah Ebenezer, S.A.V. Satyamurty “Low latency and energy efficient routing protocols for wireless sensor networks” IEEE Second International Conference on Computer and Network Technology, IEEE, pp 1-6,2-4 Jan 2010.
[3] Feng Wang and Jiangchuan Liu “Networked Wireless Sensor data collection: aggregation approach” Computer Standards & Interfaces 28, Science Direct, 2010.
[4] Xiaoxia Ren, Zhigang Yang, Yong Chuan, ChongQing “ Research on The Key Issue in wireless Sensor Network”, pp- 423, vol. 7, IEEE 2007.
[5] Rajashree. V.Biradar, V.C .Patil, S. R. Sawant, R. R. Mudholkar “Classification and comparison of routing protocols in wireless sensor networks” Special Issue on Ubiquitous Computing Security Systems. UbiCC Journal, vol.4, 2009.
[6] Rob Hoes, Twan Basten, Wai-Leong Yeow4, Chen-Khong Tham, Marc Geilen2, and Hank Corporaal “QoS Management for Wireless Sensor Networks with a Mobile Sink”, LNCS 5432, pp 53-68, Springer-Verlag, Berlin, Heidelberg, EWSN 2009.G. 2003. An extensive empirical study of feature selection metrics for text classification. J. Mach. Learn. Res. 3 (Mar. 2003), 1289-1305.
[7] R.Then Malar “Congestion Control in Wireless Sensor Networks Based Multi-Path Routing In Priority Rate Adjustment Technique” International Journal of Advanced Engineering & Applications, Jan. 2010.
[8] Edward Casey and gabriel-miro muntean “A priority-based adaptive scheme for wireless multimedia delivery”, 7th International Symposium on Parallel Architectures, Algorithm and Networks, IEEE 2004.
[9] Shensheng Tang and Wei Li “A Channel Allocation Model with Preemptive Priority for Integrated Voice/Data Mobile Networks” First International Conference on Quality of Service in Heterogeneous Wired/Wireless Networks (QSHINE’04) IEEE 2004.
[10]The ns Manual and Documentation Available: http://www.isi.edu/nsnam/ns/
[11]Yingqi Xu_, Wang-Chien Lee, Jianliang Xu “PSGR: Priority-based Stateless Geo-Routing in Wireless Sensor Networks “in National Science Foundation grant, Jan 2009.