Testing and Estimation i n Unstable Dynamic
Models: A Case Study*
M . J . H A R R I S O N Trinity College Dublin
D . B O N D
Ulster Business School
Abstract: T h i s paper discusses testing for parameter instability and estimation of time-varying parameters i n the context of the Efigle-Granger (1987) procedure. I t reviews several develop ments in testing, in particular the new test by B a i , L u m s d a i n e and Stock (1991) for use i n vector autoregression a n d error-correction models; it gives a n account of the K a l m a n filter estimation technique; a n d it examines a variety of methodological matters. To illustrate the methods and issues r a i s e d , a n example concerning the estimation of regional exployment multipliers for Northern I r e l a n d is presented. T h e paper concludes w i t h some r e m a r k s and recommendations for applied work i n economics.
I I N T R O D U C T I O N
D
u r i n g t h e past few years t h e r e has been a g r o w i n g l i t e r a t u r e on u n i t roots, cointegration a n d error-correction models. M o s t economists are w e l l aware of the m a i n developments i n these areas a n d o f t h e i r i m p l i c a t i o n s for a p p l i e d w o r k . I n p a r t i c u l a r , i t is k n o w n t h a t observations on m a n y macroeconomic v a r i a b l e s appear to behave l i k e difference-stationary t i m e series, r a t h e r t h a n stationary or trend-stationary series;1 t h a t i t is i m p o r t a n t to test for t h e presence of u n i t roots, because i f t h e y r e m a i n undetected thePaper presented at the Sixth A n n u a l Conference of the I r i s h Economic Association.
* T h e authors are grateful to Professor J o h n Spencer for h i s comments on the paper and to D r Patrick Waldron for his assistance with the T E X mathematical typesetting system for a previous version.
use o f s t a n d a r d a s y m p t o t i c d i s t r i b u t i o n t h e o r y w h e n m o d e l l i n g m a y be i n v a l i d a n d t h u s give r i s e to spurious inferences;2 a n d t h a t i f t w o or more v a r i a b l e s are cointegrated, i t m a y be feasible t o model t h e m u s i n g s t a n d a r d techniques i n such a w a y t h a t b o t h s h o r t - r u n dynamics, as c a p t u r e d b y t h e differences o f t h e v a r i a b l e s , a n d l o n g - r u n e q u i l i b r i u m tendencies, as sug gested b y economic t h e o r y a n d represented b y mechanisms i n v o l v i n g t h e levels o f t h e v a r i a b l e s , are i n c o r p o r a t e d .3 However, few m a y y e t be aware t h a t t h e w a y these f i n d i n g s are v i e w e d i s already b e g i n n i n g to change as a r e s u l t o f recent e m p i r i c a l a n d theoretical research on the detection a n d d a t i n g of changes i n such t h i n g s as t h e t r e n d a n d d r i f t p a r a m e t e r s o f economic series.
F o r e x a m p l e , C h r i s t i a n o (1988), Banerjee et al. (1989) a n d Z i v o t a n d A n d r e w s (1989) present evidence of shifts i n the mean g r o w t h rates of a large p r o p o r t i o n o f aggregate economic t i m e series, i n c l u d i n g some E u r o p e a n series. P e r r o n (1989) a n d Rappoport a n d R e i c h l i n (1989), u s i n g t h e assump t i o n o f k n o w n b r e a k dates, suggest t h a t U S o u t p u t is b e t t e r t h o u g h t o f as b e i n g s t a t i o n a r y a r o u n d a b r o k e n t r e n d t h a n as b e i n g i n t e g r a t e d of order one. M o r e r e c e n t l y , P e r r o n a n d Vogelsang (1991) show t h a t w h i l e t h e s t a n d a r d D i c k e y - F u l l e r test indicates u n i t roots i n the r e a l exchange rates between the U S a n d U K , a n d between t h e U S a n d F i n l a n d , these series are s t a t i o n a r y i f a change i n t h e i r means is allowed for; a n d t h u s they r e h a b i l i t a t e the purchas i n g power p a r i t y hypothesis for these t w o pairs of countries. B a i et al. (1991) argue t h a t i f variables are cointegrated, or i f the restrictions suggested b y a v a r i e t y of economic theories are imposed, t h e n i n s t a b i l i t y i n one series m a y be i n h e r i t e d b y o t h e r series a n d i t m a y be possible to i d e n t i f y b r e a k s u s i n g m u l t i v a r i a t e techniques, where none is a p p a r e n t u s i n g u n i v a r i a t e analyses on t h e i n d i v i d u a l series. U t i l i s i n g the r e a l business cycle theory of K i n g et al. (1988) a n d post-war data for the U S , they go on to demonstrate some evidence of a common slow d o w n i n r e a l o u t p u t per capita, consumption a n d invest m e n t ; t h e y also p r o v i d e evidence for s i g n i f i c a n t a n d more or less s i m u l
-2. Recent surveys on testing for unit roots include Dickey, B e l l and Miller (1986) and Diebold and Nerlove (1990). T h e spurious nature of the results from regressions involving non-stationary variables w a s suggested by the work of Y u l e (1926) a n d further investigated by G r a n g e r a n d Newbold (1974). I t w a s not u n t i l the papers by Phillips (1986) and P a r k and P h i l l i p s (1988 and 1989), however, that the appropriate asymptotic distribution theory began to be developed for the case of u n i t roots.
taneous breaks i n the o u t p u t series of a n u m b e r of EC countries.
Perhaps these new f i n d i n g s , a n d the increasing concern about the issue of i n s t a b i l i t y i n u n i t root econometrics, are n o t altogether s u r p r i s i n g given the vicissitudes i n economic, p o l i t i c a l a n d social conditions a n d the l o n g t r a d i t i o n of concern for parameter i n s t a b i l i t y i n classical regression analysis. However, they w o u l d appear to have p o t e n t i a l l y significant consequences b o t h for the general approach to dynamic m o d e l l i n g , a n d for the e x i s t i n g applied research o u t p u t i n t h i s field, a feature of w h i c h has been the u n d e r l y i n g assumption of stable u n i v a r i a t e t i m e series representations of variables a n d stable struc t u r a l relationships amongst variables. T h e w i d e l y used two-step procedure of Engle a n d Granger (1987), w h i c h takes s t a b i l i t y for g r a n t e d i n t e s t i n g for u n i t roots a n d e s t i m a t i n g c o i n t e g r a t i n g regressions, is a good example, not w i t h s t a n d i n g t h e emphasis o f some p r a c t i t i o n e r s on post-sample s t a b i l i t y t e s t i n g of t h e derived error-correction model. U n f o r t u n a t e l y , as P e r r o n (1990) has shown, s t r u c t u r a l shifts i n the m e a n levels of s t a t i o n a r y t i m e series bias the u s u a l tests for a u n i t root t o w a r d s non-rejection; a n d as t h e w o r k o f B a i et al. (1991) indicates, i n s t a b i l i t y m a y pervade t h e v a r i a b l e s t h a t t y p i c a l l y enter c o i n t e g r a t i n g r e l a t i o n s h i p s . There seems l i t t l e doubt, therefore, t h a t i n s t a b i l i t y w i l l be a subject of considerable i m p o r t a n c e i n f u t u r e d y n a m i c m o d e l l i n g a n d t i m e series research.
T h i s paper focusses on t e s t i n g for s t a b i l i t y a n d e s t i m a t i o n of t i m e - v a r y i n g p a r a m e t e r s i n the context of the Engle-Granger (1987) procedure. The a i m is to show h o w a t t e n t i o n to the p o s s i b i l i t y of i n s t a b i l i t y m a y lead to r a d i c a l l y different conclusions f r o m those w h i c h w o u l d r e s u l t f r o m the a p p l i c a t i o n of t h e s t a n d a r d methodology. The approach is to u t i l i s e a n u m b e r of f o r m a l a n d i n f o r m a l t e s t i n g a n d e s t i m a t i o n procedures w i t h i n an i l l u s t r a t i v e case study, the s t u d y chosen b e i n g t h a t of B o n d (1990) on r e g i o n a l e m p l o y m e n t m u l t i pliers for N o r t h e r n I r e l a n d . T h o u g h essentially i n t e n d e d to raise questions of g e n e r a l m e t h o d o l o g i c a l relevance, t h e r e s u l t s o b t a i n e d m a y be o f some i n t e r e s t i n themselves.
I I T E S T S F O R I N S T A B I L I T Y
There is a w i d e v a r i e t y of procedures available for t e s t i n g for i n s t a b i l i t y i n econometric models. M o s t of t h e m were developed for use i n the static general l i n e a r m o d e l w i t h s t a t i o n a r y variables, t h o u g h m a n y of these are a p p r o x i m a t e l y ( a s y m p t o t i c a l l y ) v a l i d i n d y n a m i c l i n e a r models i n v o l v i n g lagged dependent v a r i a b l e s . T h e techniques developed recently t e n d to be of more general a p p l i c a b i l i t y , b u t few have been developed specifically for use i n t h e presence o f non-stationary variables.
T h e f i r s t , large group includes the log l i k e l i h o o d r a t i o procedure suggested b y Q u a n d t (1960); t h e Chow (1960) t e s t a n d i t s generalisation based on t h e use o f several m o v i n g regressions, w h i c h B r o w n et al. (1975) refer to as the homogeneity test; t h e F a r l e y - H i n i c h (1970) t e s t a n d t h e s i m i l a r procedure based on t i m e - t r e n d i n g regressions o u t l i n e d i n B r o w n et al. (1975); t h e tech niques based on the use of c u m u l a t i v e sums (cusums) and cusums of squares of a set of recursive residuals proposed b y B r o w n et al. (1975), a n d the least squares v a r i a n t o f t h e c u s u m o f squares t e s t developed b y M c C a b e a n d H a r r i s o n (1980); t h e t e s t s a g a i n s t s t a t i o n a r y A R ( 1 ) a n d r a n d o m w a l k b e h a v i o u r o f coefficients, such as those of L a M o t t e a n d M c W h o r t e r (1978), T a n a k a (1983), N i c h o l l s a n d Pagan (1985) a n d Watson a n d Engle (1985); a n d the p o i n t o p t i m a l tests of K i n g (1987), Shively (1988) and Brooks (1991).
T h e recent group includes the proposals of Z i v o t a n d A n d r e w s (1990), B a i et al. (1991), A n d r e w s a n d Ploberger (1991), a n d a n o t e w o r t h y test for use i n models w i t h non-stationary regressors by Hansen (1990). Each of these pro cedures i s based on t h e b e h a v i o u r of an i n d i c a t o r d e r i v e d f r o m a c e r t a i n sequence of statistics, i n the t r a d i t i o n of m a n y tests for s t r u c t u r a l change w h e n t h e change p o i n t s are u n k n o w n . T h u s Z i v o t a n d A n d r e w s suggest e x a m i n i n g a m i n i m a l t type s t a t i s t i c ; Hansen proposes a mean Lagrange m u l t i p l i e r statistic; A n d r e w s a n d Ploberger derive a n asymptotically o p t i m a l procedure u s i n g an average exponential W a l d test; a n d B a i et al. use various functions of W a l d F type statistics.
B L S test is b o t h r e l a t i v e l y complex a n d l i t t l e k n o w n . Therefore, there follows a b r i e f o u t l i n e of the B L S procedure.
The BLS Test
L e t yt denote an n x 1 vector of 1(0) t i m e series variables, dt( k ) = l ( k ) , where l ( ' ) is a s t r u c t u r a l b r e a k i n d i c a t o r function w h i c h takes on the value 0 w h e n t < k a n d t h e value 1 w h e n t > k , a n d be a vector of s t a t i o n a r y variables t h a t do n o t depend on the break date k . The system of equations considered is
yt = u + X dt( k ) + E A j y t . j + B X t ^ + U t , j = i
(1)
where yt, \i, X a n d ut are n x l , { A j } are n x n , a n d the roots of ( I - A ( L ) L ) are assumed to be outside the u n i t circle. T h i s m o d e l incorporates a n u m b e r of i n t e r e s t i n g special cases. For example, w i t h yt = A Yt a n d Xt^1 o m i t t e d , i t is a vector autoregressive specification ( V A R ) , applicable w h e n t h e series are i n t e g r a t e d , possibly w i t h a changing d r i f t , b u t n o t cointegrated; w i t h yt = A Yt and Xt_! = y'Y^i, i t is a vector error-correction model ( V E C M ) ; a n d w i t h n = 1, the f a m i l i a r u n i v a r i a t e version of these a l t e r n a t i v e representations emerges.
I n order to cast the sequence of statistics u n d e r p i n n i n g the B L S procedure i n i t s most general f o r m , i t is convenient to w r i t e equation (1) more compactly as
yt = ( I ® Z 't) p + ut > (2)
where Z't = ( l , dt( k ) , y U1 y ' t - p . X ^ ) , p = Vec(D') a n d D = (u, X, Au...,Ap,B), a n d to note t h a t , for a given k, the O L S estimator of P is
P(k) = I ( I ® ZtZ 't)
l_t=i I ( I ® Z
tZ 't) yt.
t=i (3)
N o w the n u l l hypothesis of s t a b i l i t y , i n the sense t h a t there is no break i n the m e a n , is assessed by reference to the sequence of F statistics t e s t i n g X = 0, namely,
F ( k ) = [ s p ( k )
f
( T > - 1
s T_ 1 X ZtZ t S' I t = i J J
S p ( k ) ,
w h e r e S = I®s a n d s = (0, 1, 0,...,0), Qu is the estimated variance-covariance m a t r i x of ut, k * = [ST] where 8 is a " t r i m m i n g " parameter such t h a t 0 < 8 < 1 a n d [•] denotes the integer p a r t . D e n o t i n g the stochastic F statistic process as FT( 8 ) = F([8T]), B L S propose t h r e e t e s t s t a t i s t i c s : t h e m a x i m u m W a l d s t a t i s t i c , the m e a n W a l d s t a t i s t i c a n d the l o g e x p o n e n t i a l W a l d s t a t i s t i c , defined, respectively, as
S u p - W : sup Ft( 5 ) (5)
M e a n - W : j ^ ' F ^ d S (6)
E x p - W : l n { |8 1;8* e x p [ FT( 8 ) ] d 8 } . (7)
U s i n g the k n o w n f o r m of t h e l i m i t i n g d i s t r i b u t i o n of the W a l d F s t a t i s t i c process FT ( 8 ) , B L S derive the l i m i t i n g d i s t r i b u t i o n s of the statistics (5)-(7) b y m e a n s of t h e c o n t i n u o u s m a p p i n g t h e o r e m a n d t a b u l a t e selected c r i t i c a l values. F u l l e r t e c h n i c a l details are g i v e n i n T h e o r e m 1 of B a i et al. ( 1 9 9 1 , pp. 12-13).
A l t h o u g h the C h o w and M H tests are s t r i c t l y v a l i d only i n the case of fixed regressor models, t h e y are a p p r o x i m a t e l y v a l i d i n d y n a m i c models. Some s u p p o r t for t h e use of the cusum of squares test i n d y n a m i c models comes f r o m McCabe (1987), t h o u g h i t s h o u l d be p o i n t e d o u t t h a t Ploberger a n d K r a m e r (1985) have shown t h a t the technique m a y have v e r y l i t t l e power i n c e r t a i n cases. F o r t e s t i n g against i n s t a b i l i t y i n the E C M f o r m u l a t i o n s i n Section I V , therefore, the B L S test w i l l be the essential b e n c h m a r k . I n t h e presence of non-stationary variables, the behaviour of b o t h the Chow a n d M H procedure is u n k n o w n . I n e m p l o y i n g t h e m i n t h e context of c o i n t e g r a t i n g regressions, therefore, i t m u s t be stressed t h a t they are n o t b e i n g used as f o r m a l t e s t i n g procedures, b u t m e r e l y as i n f o r m a l aids to diagnosis. F i n a l l y , t h e t h r e e chosen tests for i n s t a b i l i t y are supplemented i n the case study b y an e x a m i n a t i o n of t h e recursively estimated coefficients of the various models used.
I l l E S T I M A T I N G V A R Y I N G P A R A M E T E R S : T H E K A L M A N F I L T E R
b y Bayesians i n t i m e series analysis, i t has never p l a y e d a c e n t r a l role i n applied economics.4 I t is therefore briefly o u t l i n e d i n t h i s section.
State-space models focus on m unobservable state variables w h i c h change over t i m e , a n d on h o w these variables relate to c e r t a i n other variables w h i c h can be observed. I f xt is the m x 1 vector o f state v a r i a b l e s a n d yt t h e n x 1 vector o f observables a t t i m e t , t h e n the r e l a t i o n s h i p between t h e t w o m a y be w r i t t e n as the measurement equation
yt = Ztxt + Vtu t , t = 1, 2 T , (8)
w h e r e Z,, a n d Vt are fixed matrices o f order n x m a n d n x r, respectively. T h e o b s e r v a t i o n a l disturbance ut is assumed to be i n d e p e n d e n t w i t h zero mean a n d variance-covariance m a t r i x Ht. A l t h o u g h xt is n o t d i r e c t l y observable, i t s evolution is assumed to be governed b y i t s r a n d o m i n i t i a l v a l u e , XQ, together w i t h the variance-covariance m a t r i x of xo, a n d a process defined b y t h e state or t r a n s i t i o n equation
xt = G t x ^ + Rtwt, t = 1,2 T , (9)
w h e r e Gt a n d Rt are fixed matrices of order m x m a n d m x g, respectively, a n d wt is a g x 1 vector o f state disturbances w i t h zero m e a n a n d variance-covariance m a t r i x Qt. T h e disturbances i n b o t h t h e m e a s u r e m e n t a n d t r a n s i t i o n equations are t a k e n to be serially uncorrelated, u n c o r r e l a t e d w i t h each other, a n d uncorrelated w i t h XQ for a l l t i m e periods.
A feature of t h i s m u l t i v a r i a t e state-space f o r m u l a t i o n is t h a t i t subsumes a range of models as special cases a n d t h u s provides g r e a t f l e x i b i l i t y i n t a i l o r i n g models to special circumstances. T h e problems w i t h the approach relate to model i d e n t i f i c a t i o n and to e s t i m a t i n g the state vector xt a n d t h e u n k n o w n parameters Gt, Rt, Ht a n d Qt. Given values for the parameters, recursive esti m a t i o n of xt is possible u s i n g the K a l m a n filter. I n essence, t h i s is a two-stage recursive process t h a t involves p r e d i c t i n g t h e state vector for a g i v e n t i m e p e r i o d , a n d t h e n u p d a t i n g t h i s p r e d i c t i o n b y i n c o r p o r a t i n g n e w i n f o r m a t i o n for t h a t t i m e period v i a the measurement equation.
Suppose t h a t xt - 1 is the o p t i m a l estimator of x , ^ a t t i m e t - 1 , w i t h
xt- i - ^ i ~ W S ( 0 , Pw) , (10)
where W S means i n the wide sense. T h e n the p r e d i c t i o n equations are
* t l t - l = Gtxt_ ! (11)
a n d
P t i t - i = GtP t - i G ; + RtQ t R ' t , t = L 2 , . . . , T , (12)
w h i l e the u p d a t i n g equations are
* t = * t i t - i + P t i t - i Z ' t J t ' l Y t " Z t * t i t - i ) (13)
a n d
Pt = P t i t - i " P t i t - i Z t J t ^ t P t i t - i . t = l , 2 , . . . , T , (14)
where Jt= ZtPt l wZ 't+ VtHtV 't.
T h i s e s t i m a t i o n m e t h o d i s m u c h s i m p l i f i e d i f , as i s often t h e case i n practice, t h e m a t r i c e s Gt, Rt, Ht a n d Qt are t a k e n to be t i m e - i n v a r i a n t . F o r example, i n a case of special interest, t h e measurement equation of t h e state-space model m a y be w r i t t e n as
yt = Ztpt + ut, t = l , 2 , . . . , T , (15)
where Vt = I a n d Ht = H V t ; a n d the t r a n s i t i o n equation may be w r i t t e n as
Pt = GipVi + wb t = l , 2 , . . . , T , (16)
where Rt = I a n d Qt = Q V t . T h i s is clearly t h e m u l t i v a r i a t e regression model w i t h t i m e - v a r y i n g p a r a m e t e r s . I f Gt = I V t a n d Q = 0, t h e classical model emerges w i t h stable parameters over t i m e , a n d the K a l m a n f i l t e r is equiva l e n t to a p p l y i n g recursive OLS to t h e equations. F o r the purposes o f the case s t u d y i n t h e f o l l o w i n g section, the more general t i m e - v a r y i n g p a r a m e t e r s i n t e r p r e t a t i o n i s used, t h o u g h only for t h e single-equation case where n = 1.
T h e one r e m a i n i n g question concerns t h e e s t i m a t i o n o f t h e p a r a m e t e r s r e q u i r e d f o r t h e use o f t h e K a l m a n f i l t e r . Several m a x i m u m l i k e l i h o o d techniques are available, i f i t i s assumed t h a t xo, u i U T a n d w i , . . . , W T are j o i n t l y n o r m a l a n d u n c o r r e l a t e d (vector) v a r i a b l e s . A common l i k e l i h o o d ,
= . . . = Xk, i t is appropriate only i f the parameters are k n o w n t o be stable over t h e f i r s t k t i m e periods, as is assumed w h e n recursive O L S is a p p l i e d to the classical f o r m o f E q u a t i o n (15). A n o t h e r approach is based on the expectation-m a x i expectation-m i s a t i o n ( E M ) a l g o r i t h expectation-m o f D e expectation-m p s t e r et al. (1977) as a d a p t e d to the state-space model b y S h u m w a y a n d Stoffer (1982). T h i s proceeds by succes s i v e l y m a x i m i s i n g t h e c u r r e n t c o n d i t i o n a l e x p e c t a t i o n o f t h e l o g l i k e l i hood f u n c t i o n of the complete unobserved d a t a XQ, U I , . „ , U T , W J wp, g i v e n
y i , y2
y-r-I n Section y-r-I V , t h e q u a s i - c o n d i t i o n a l l i k e l i h o o d is adopted. A s t h e m o d e l t h e r e is a single equation one, a n d as a r a n d o m w a l k f o r m u l a t i o n is used for the t r a n s i t i o n equation ( Gt = I ) , m a x i m i s a t i o n o f t h i s l i k e l i h o o d is equivalent to m i n i m i s i n g
T
I t=i
where a? = Ht + Zt( Pt - 1 + Qt) Z t , r e c a l l i n g the n o t a t i o n of E q u a t i o n s (15) a n d (16) a n d n o t i n g t h a t for n = 1, Ht is a scalar, Zt is 1 x m , a n d b o t h Pt a n d Qt are m x m .
I V CASE S T U D Y
I n t h e paper b y B o n d (1990), t h e concepts of c o i n t e g r a t i o n a n d e r r o r -c o r r e -c t i o n models w e r e used i n t h e e s t i m a t i o n o f r e g i o n a l e m p l o y m e n t m u l t i p l i e r s for N o r t h e r n I r e l a n d from q u a r t e r l y d a t a for the period J u n e 1978 to December 1986. Since p a r a m e t r i c s t a b i l i t y of t h e models employed was assumed t h r o u g h o u t , t h i s w o r k provides a useful basis for the present case s t u d y , t h e f i r s t a i m o f w h i c h is to i l l u s t r a t e t h e use o f t h e t e c h n i q u e s described i n Sections I I a n d I I I . T h e s t a b i l i t y analysis of Bond's f i n d i n g s is extended, however, by means of an a d d i t i o n a l d a t a set for the e a r l i e r period J u n e 1959 to J u n e 1971.
B y w a y of background, the f o l l o w i n g b r i e f sketch of Bond's s t u d y is g i v e n . The e m p l o y m e n t i n the region was s p l i t i n t o t h r e e categories: base or export e m p l o y m e n t (X) w h i c h produces o u t p u t f o i c o n s u m p t i o n o n a w i d e r m a r k e t ; non-base or service employment (S) w h i c h is m a i n l y concerned w i t h servicing the local economy; a n d e m p l o y m e n t i n t h e autonomous sector ( A ) w h i c h is t h e r e to m e e t n a t i o n a l r e q u i r e m e n t s . A l l i n d u s t r i e s a t t h e 1980 t w o - d i g i t s t a n d a r d i n d u s t r i a l classification (SIC) level were allocated to one o f these groups, w i t h some e x p e r i m e n t a t i o n b e i n g c a r r i e d o u t to d e t e r m i n e w h e t h e r construction w o u l d be i n the non-base or autonomous category; details of the
Table 1(a): Allocation ofSICs to Economic Base Categories
Group SICs B a s e 11,12,14
25,26 24 32 33,34 21,22,31, 35-38 43 44,45 46 47 48,49 Autonomous 1,2,3 23 91 92 93 95 97 *** 50 Non-Base 16,17 81,82 83,84,85 61-66 71-77 79 94 96 98 *** 50 Description Coal and Petroleum Products Chemicals and Man-made F i b r e s Mineral Products
Mechanical Engineering
Office Machinery & E l e c t r i c a l Engineering Miscellaneous Engineering
L i n e n & Textiles
Clothing, Footwear, Leather & F u r Timber & F u r n i t u r e
P a p e r etc.
Rubber Products & Other Manufacturing
Agriculture, Forestry & F i s h i n g Mining & Quarrying
Public Administration & Defence Sanitary Services
Education H e a l t h Recreation
Construction (Grouping 1 only) ***
G a s , Electricity &Water B a n k i n g & Insurance Business Services Distribution Transport Communications
Research & Development Other Services
Personnel Services
Construction (Grouping 2 only) ***
Table 1(b): Allocation of 1968 SICs
Group SICs Description B a s e 3 Food, D r i n k and Tobacco
7,8,11 Mechanical, Instrument and E l e c t r i c a l Engineering 10 Ship Building
13 Textiles 15 Clothing and Footwear 5,6,12,14,16-19 Rest of Manufacturing
Autonomous 1 Agriculture, Forestry and F i s h i n g 2 Mining and Quarrying
*** 20 Construction (Grouping 1 only) *** 25 Professional and Scientific
27 Public Administration and Defence
Non-base 21 G a s , Electricity and Water 22 Transport and Communications 23 Distributive Trades
24 Insurance, B a n k i n g and Finance 26 Miscellaneous Services
a l l o c a t i o n s are g i v e n i n T a b l e 1(a). T h e t h r e e d e r i v e d d a t a series, t h e i r differences, as w e l l as t h e t o t a l e m p l o y m e n t series, were subjected to DickeyF u l l e r ( D DickeyF ) , a u g m e n t e d D DickeyF ( A D DickeyF ) a n d c o i n t e g r a t i n g regression D u r b i n -W a t s o n ( C R D -W ) u n i t root tests. T h e results of these tests are g i v e n i n Table 2(a); as can be seen, t h e y suggest t h a t t h e levels series a r e p r o b a b l y i n t e g r a t e d o f order one, 1(1), w h i l e t h e differences are 1(0). Several specifi cations for t h e static c o i n t e g r a t i n g regression of S on X a n d A were estimated, w i t h t h e r e s i d u a l s b e i n g tested for a u n i t root i n each case; d e t a i l s o f the specifications, together w i t h the regression coefficient estimates a n d t h e u n i t r o o t t e s t r e s u l t s are given i n T a b l e 3(a). O v e r a l l f r o m these r e s u l t s i t w o u l d appear t h a t t h e specifications w h i c h exclude t h e seasonal d u m m i e s are m o s t l i k e l y to be cointegrated, C I ( 1,1).
Table 2(a): Tests for Unit Roots in Basic Series
Model Series CRDW DF ADF
Both: Total 0.07 -0.32 -2.49
ATotal 1.13 -4.23 -1.97
Base 0.02 -1.02 -2.30
ABase 1.88 -3.65 -1.65
Grouping 1: Non-base 0.27 -4.21 -2.59
ANon-base 1.88 -5.35 -2.40
Autonomous 0.39 -2.40 -2.16
AAutonomous 0.85 -5.16 -2.41
Grouping 2: Non-base 0.28 -1.49 -2.54
ANon-base 1.61 -4.77 -2.55
Autonomous 0.07 -3.43 -0.63
AAutonomous 1.26 -6.72 -2.00
Table 2(b): Tests for Unit Roots in Logs of Basic Series
Model Series CRDW DF ADF
Both: Base 0.34 -2.06 -3.10
A4B a s e 2.24 -7.94 -3.10
Grouping 1: Non-base 0.61 -3.39 -2.05
A4Non-base 2.72 -9.91 -3.52
Autonomous 0.0^ -1.01 -1.06
A4Autonomous 2.42 -8.63 -2.94
Grouping 2: Non-base 0.32 -2.47 -1.90
A4Non-base 2.50 -8.77 -2.97
Autonomous 0.43 -0.40 -0.00
A4Autonomous n a n a n a
Table 3(a): Cointegrating Regression Results
Equation Specifications
Specification Explanatory Variables
1 Constant, Base Employment Autonomous Employment, Seasonal Dummies
2 Constant, Base Employment, Autonomous Employment
3 Base Employment, Autonomous Employment, Seasonal Dummies
4 Base Employment, Autonomous Employment
Specification Base Autonomous CRDW DF ADF
Grouping 1: 1 -0.16 0.72 0.34 -2.31 -1.50
2 -0.16 0.75 0.52 -2.79 -2.03
3 -0.17 0.87 0.36 -2.18 -1.42
4 -0.17 0.87 0.54 -2.65 -1.96
Grouping 2: 1 0.40 0.87 0.40 -1.90 -2.13
2 0.40 0.90 0.56 -2.41 -2.76
3 0.39 0.82 0.39 -1.91 -2.17
4 0.39 0.83 0.55 -2.45 -2.85
Table 3(b): Basic Levels Results (Constant term included) 1959-1971
Grouping Base Autonomous CRDW DF ADF
1 -0.18 0.07 0.75 -3.60 -1.71
2 -0.30 0.20 0.69 -2.93 -1.03
Table 4(a): Johansen Procedure Results 1978-1986
Hq: Not more than 'n'
Cointegrating Regressions Coefficients
Specification 0 1 2 Non-base Autonomous
Grouping 1 levels -27.4 -10.1 - 0 . 6 0.12 -0.69
logs -26.4 - 8 . 3 - 0 . 6 0.14 - 1 . 0
Grouping 2 levels -61.7 -19.0 - 3 . 3 0.08 1.3
logs -62.0 -20.1 - 3 . 7 0.06 1.2
Table 4(b): Results of Johansen Procedure 1959-1971
Not more than 'n'
Cointegrating Regressions Coefficients
Specification 0 1 2 Non-base Autonomous
Grouping 1 levels -48.1 -26.2 - 9 . 5 -0.27 -0.47
logs -50.2 -28.3 -10.9 -0.59 -0.41
Grouping 2 levels -10.2 -17.0 -1.9 -0.01 - 1 . 2
logs -12.5 -19.1 -3.9 -0.06 -0.62
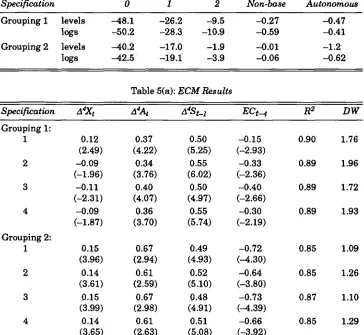
Table 5(a): ECM Results
Specification A4Xt A4At A4St-i ECt-4 R2 DW
Grouping 1:
1 0.12 0.37 0.50 - 0 . 1 5 0.90 1.76
(2.49) (4.22) (5.25) (-2.93)
2 -0.09 0.34 0.55 -0.33 0.89 1.96
(-1.96) (3.76) (6.02) (-2.36)
3 -0.11 0.40 0.50 -0.40 0.89 1.72
(-2.31) (4.07) (4.97) (-2.66)
4 -0.09 0.36 0.55 -0.30 0.89 1.93
(-1.87) (3.70) (5.74) (-2.19)
Grouping 2:
1 0.15 0.67 0.49 -0.72 0.85 1.09
(3.96) (2.94) (4.93) (-4.30)
2 0.14 0.61 0.52 -0.64 0.85 1.26
(3.61) (2.59) (5.10) (-3.80)
3 0.15 0.67 0.48 -0.73 0.87 1.10
(3.99) (2.98) (4.91) M . 3 9 )
4 0.14 0.61 0.51 -0.66 0.85 1.29
[image:13.481.52.418.66.628.2] [image:13.481.53.417.250.585.2]Table 5(b): Preliminary ECM Results 1959-1971
A% R2 DW
1 -O.003 . 0.15 0.22 -0.68 0.32 1.07
(-0.03) (1.68) (1.20) (-4.35)
2 -0.05 0.11 0.45 -0.31 0.35 1.58
(-0.51) (1.06) (3.22) (-2.43)
For t h e purposes o f t h e present study, a l o g a r i t h m i c specification for t h e second i n d u s t r y g r o u p i n g is chosen, namely,
l o g St = ao + ax log X t + a2 log A t + ul t
A4l o g St = bo + b x A M o g X t + b a A M o g A t + b g A M o g S t + b ^ K t - ^ + Uat, (18)
where A4 is t h e four p e r i o d difference (i.e. A4Xt = Xt - X ^ ) and u1 ( t_4) is the error-correction t e r m . T h e estimates of ax a n d a2 f r o m (18) are the estimates of t h e l o n g - r u n elasticities, a n d the estimates of and ba are s h o r t - r u n elas t i c i t i e s . T h e r e s u l t s i n Table 3(a) suggest t h a t t h e l o n g - t e r m m u l t i p l i e r s are l i k e l y t o be about 1.4 for base e m p l o y m e n t and 1.8 for autonomous employ m e n t , respectively, w h i l e those i n Table 5(a) indicate t h a t the corresponding
s h o r t - t e r m m u l t i p l i e r s are a b o u t 1.14 a n d 1.6, respectively. T h e e l a s t i c i t y estimates f r o m (18) are given i n Table 6(a) a n d values for the various regional e m p l o y m e n t m u l t i p l i e r s are easily d e r i v e d f r o m these. T h e i n v e s t i g a t i o n o f s t a b i l i t y commenced b y r e p l i c a t i n g Bond's analysis and r e - e s t i m a t i n g model (18) u s i n g q u a r t e r l y e m p l o y m e n t d a t a for the e a r l i e r p e r i o d m e n t i o n e d a b o v e .5 U n f o r t u n a t e l y , w h i l s t i t is i n t e r n a l l y consistent, t h i s f u r t h e r series is based, n o t on the 1980, b u t on the 1968 SIC. Therefore, w h i l e the allocation of i n d u s t r i e s to t h e base, service a n d autonomous sectors is s i m i l a r to t h a t adopted for t h e 1978-86 sample, u n a v o i d a b l e differences occur due to the different s t r u c t u r e of the 1968 S I C ; details of the allocations i n t h i s case are g i v e n i n T a b l e 1(b). I t follows t h a t t h e r e s u l t s , too, are n o t d i r e c t l y com parable w i t h those for t h e more recent period, so care is needed i n t h e i r i n t e r p r e t a t i o n . These r e s u l t s i n c l u d e t h e v a l u e s of u n i t r o o t t e s t s t a t i s t i c s i n Table 2(b); t h e c o i n t e g r a t i n g regression estimates i n Table 3(b); the values of t h e J o h a n s e n t e s t s t a t i s t i c s i n T a b l e 4(b); t h e p a r a m e t e r e s t i m a t e s for t h e d y n a m i c E C M models i n Table 5(b); a n d the e s t i m a t e d coefficients of model (18) i n Table 6(b).
T h e p r i m e feature of these new results is t h e i r d i s a p p o i n t i n g q u a l i t y com p a r e d w i t h t h e o r i g i n a l ones. T h e r e s u l t s of the u n i t root tests on the basic series a n d t h e i r differences are s i m i l a r , b u t the results for the static
Table 6(a): Coefficient Estimates for Equation (18), 1978-86
Static Equation ag °-l &2 R2 CRDW
-0.14 (-0-19)
0.25 (6.21)
0.87 (3.85)
0.63 0.60
Dynamic Equation bo bi b2 b3 b4 R2 DW
-0.003 (-0.82)
0.12 0.77 (2.46) (2.49)
0.50 -0.64 (4.79) (-3.78)
0.85 1.31
Table 6(b): Coefficient Estimates for Equation (18), 1959-71
Static Equation <*0 ai a2 R2 CRDW
5.80 (7.98)
-0.30 (-2.12))
0.20 (5.02)
0.38 0.69
Dynamic Equation bo bi b2 b3 b4 R2 DW
0.001 (0.12)
-0.05 0.09 (-0.51) (0.38)
0.45 -0.31 (2.92) (-2.36)
0.35 1.56
t-values i n parentheses.
sions indicate poor fits ( R2 values of 0.14 a n d 0.37 for the t w o equations) a n d v e r y different n u m e r i c a l values for the coefficients ( i n c l u d i n g some negative values) a n d t h e i r associated l o n g - r u n m u l t i p l i e r s . T h e Johansen test also sug gests negative coefficients, and the possibility o f t w o c o i n t e g r a t i n g regressions for t h e i n d u s t r y groupings, w h i l e t h e d y n a m i c models have l o w coefficients o f d e t e r m i n a t i o n a n d v e r y few s i g n i f i c a n t t s t a t i s t i c s associated w i t h the p a r a m e t e r estimates.
T h e p r e l i m i n a r y indications were therefore t h a t t h e r e appear to be signifi c a n t differences i n the s t r u c t u r e of t h e models for t h e 1959-1971 a n d 1978-1986 periods, a n d t h a t w i t h i n the f o r m e r p e r i o d t h e d a t a pose p a r t i c u l a r problems for e s t i m a t i o n . On reflection, i t m a y n o t be s u r p r i s i n g t h a t a para-m e t r i c a l l y stable para-model does n o t f i t the data w e l l i n the earlier period; for the 1960s was a period of considerable change, w i t h a s t r o n g regional policy b e i n g p u r s u e d f r o m about 1963 onwards, r e l a x a t i o n of t h e " I m p e r i a l C o n t r i b u t i o n " l e a d i n g to a n i n f l u x of a d d i t i o n a l p u b l i c monies i n t h e p u r s u i t o f propor t i o n a l i t y , a n d the increase i n general p o l i t i c a l i n s t a b i l i t y . T h u s i t was decided to subject t h e t w o sample periods to m o r e f o r m a l checks for s t r u c t u r a l change.
F i g u r e 1: Chow Test 1978-1986
Test statistic
5% critical value
/ / / / / / / / ^ (a) Levels Model 1 step chow
8
6-T 1 1 1 1 1 1 1 1
(c) Levels Model N-step chow
(b) Dynamic Model 1 step chow
i i i r
/ / / / / / / / /
(d) Dynamic Model N-step chow
F i g u r e 2: Chow Test 1959-1972
Test statistic
5% critical value
i ! i ! ! i ! ! i i ! § §
(a) Levels Model 1 step chow
"i i i i—i i l l i i I I )
(b) Dynamic Model 1 step chow
0-j r—i | | J |—| | r—| | |—| U i o N n t m u N a i f t o
-O i m o i o i -O i -O i o i c n o i o i o i ? !
~~(c) Levels Model N-step chow
6
4-2
0 I I I I I I I I I I I I I I
F i g u r e 3: MH CUSUM Test
Test statistic lower bounds upper bounds
(a) 78 - 86 Static Model (b) 59 - 71 Static Model
(c) 78 - 86 Dynamic Model
O ) C n O ) O > 0 ) O > G ) O ) O ) G > O ) O > 0 )
(d) 59-71 Dynamic Model
Figure 4: BLS-F(k) Test
Test statistic critical value
Sup-W: > 11.45 (8.76) Mean-W: 3.69 (2.89) Exp-W: 8.60 (3.50)
(a) 78 • 86 Dynamic Model
"1—I—I i l l f—»
Sup-W: 9.98 (8.76) Mean-W: 2.86' (2.89) Exp-W: 7.17 (3.50)
(' - nol slgnllicanl at 5% level)
a l l three v a r i a n t s (Sup-W, M e a n - W and Exp-W) being used. F i g u r e 4 presents the plots of the sequences of W a l d F statistics for the t w o sample cases, f u l l d e t a i l s o f t h e c o r r e s p o n d i n g range of B L S test statistics a n d the r e q u i r e d c r i t i c a l v a l u e s .6 T h e n o m i n a l 5 per cent significance level was used t h r o u g h out for a l l test procedures. A l t h o u g h the M H test is i n s i g n i f i c a n t for b o t h the static a n d d y n a m i c models u s i n g the 1978-1986 data, a n d the N-step back Chow test for t h e d y n a m i c model u s i n g the same sample, there is i n general very s t r o n g evidence of i n s t a b i l i t y i n b o t h periods. The evidence for the
1959-1971 period seems o v e r w h e l m i n g , w i t h a l l tests i n d i c a t i n g shifts r o u n d about 1964-1965 and/or 1968-1969. T h e w e i g h t of evidence for the 1978-1986 period suggests breaks r o u n d about 1982 and possibly i n 1986.
I n the l i g h t of these f i n d i n g s i t was decided to estimate the static equation i n (18) as a t i m e - v a r y i n g parameters model for each of the t w o periods, u s i n g the K a l m a n f i l t e r as described i n Section I I I . However, the quasi-conditional l i k e l i h o o d (17) w a s m a x i m i s e d u s i n g a g r i d search, r a t h e r t h a n t h e m o r e s t a n d a r d t e c h n i q u e , because t h e s e n s i t i v i t y o f the Johansen test to s l i g h t v a r i a t i o n s i n the s t a r t i n g p o i n t suggested t h a t the f i r s t few periods also need to be m o d e l l e d . U t i l i s i n g t h e O L S estimates of the a p p r o p r i a t e covariance m a t r i c e s f r o m t h e f u l l sample as t h e s t a r t i n g values for Pt and Ht i n each case, a n d the s y m m e t r i c m a t r i x
Qt = Q: 0
0 0.5
0 - 0 . 2 5 0.5
(19)
the search g r i d used the range of s t a r t i n g values ao= 0, a i = 0 to 1.5, a n d a2 = 0 to 1.5. T h e a s s u m p t i o n o f positive elasticities seems q u i t e reasonable, b u t could be r e l a x e d i f r e q u i r e d . T o ease the c o m p u t a t i o n a l b u r d e n , e s t i m a t i o n was only u n d e r t a k e n for Gt = I V t , w h i c h i m p l i e s t h a t t h e a; follow a r a n d o m w a l k .
Tables 7(a) a n d 7(b) a n d Figures 5 and 6 provide the details of the result i n g K a l m a n f i l t e r estimates. T h e m e a n values of a i a n d a2 f °r the 1978-86 sample are 0.22 a n d 0 . 8 1 , respectively, w h i c h are s i m i l a r to t h e v a l u e s obtained i n the o r i g i n a l static regression; the values of the C R D W and t h e D F statistics i n t h i s case are b o t h b e t t e r t h a n i n the static regression, t h o u g h t h a t of the A D F statistic is not. For the 1959-1971 period, the mean values of
a i a n d a2are 0.85 a n d 0.17, respectively, w h i c h are r a d i c a l l y different f r o m
t h e estimates obtained i n t h e static regression. Moreover, t h e r e is noticeably
more v a r i a t i o n i n the estimates o f the t i m e - v a r y i n g p a r a m e t e r s for t h i s period
t h a n t h e r e is i n the t i m e - v a r y i n g estimates for the 1978-1986 period.
Table 7(a): Summary of Varying Parameter Specification (Grouping 2) 1978.2-1986.4
Base Autonomous CRDW DF ADF
mean 0.22 0.81 2.18 - 6 . 3 -2.54 standard dev. 0.0007 0.002
s.d. mean 0.0001 0.0003
Table 7(b): Summary of Varying Parameter Specification (Grouping 2) 1959-1971
Base Autonomous CRDW DF ADF
mean 0.84 0.17 2.31 -8.1 -2.65
standard dev. 0.005 0.005
s.d. mean 0.0007 0.0007
Figure 5: Beta Coeff. Base Industries
Test statistic
+ - 2 Standard Errors
0-.3-
0.5-(a) 78 - 86 Recursive Estimation (b) 59 - 71 Recursive Estimation
A> «°> _Q> J"- <V °i > <o <b
(c) 78 - 86 Kalman Rlter
0.84-
0.82-0.8- I I I I I I I I I I I I I
o i c > < j > o > o > c n a ) o i o > a ) a > 0 ) < 7 >
Figure 6: Beta Coeff. Autonomous Industries
Coefficient V a l u e s
+ - 2 S t a n d a r d E r r o r s
(c) 78 - 86 Kalman Filter (d) 59 - 71 Kalman Filter
F i n a l l y , recursive O L S estimates of t h e parameters i n b o t h t h e static a n d d y n a m i c m o d e l were c o m p u t e d for t h e t w o sample periods. F u l l details are n o t reported, b u t t h e recursive estimates of t h e coefficients i n t h e static model are shown i n F i g u r e s 5 a n d 6 for comparison w i t h t h e K a l m a n f i l t e r results. Once a g a i n t h e f i n d i n g s b e t r a y i n s t a b i l i t y r o u n d about 1965 i n t h e e a r l i e r p e r i o d , a n d r o u n d about 1982 a n d 1985 i n t h e l a t e r period. I t is n o t e w o r t h y t h a t t h e recursive estimates t e n d to m i m i c t h e behaviour of t h e K a l m a n f i l t e r estimates, t h o u g h n o t s u r p r i s i n g l y t h e i r r a n g e o f v a r i a t i o n is v e r y m u c h greater.
V D I S C U S S I O N
F i r s t , the incidence o f i n s t a b i l i t y w o u l d appear t o create a n u m b e r of serious difficulties for the Engle-Granger procedure. C h e c k i n g for u n i t roots is i m p a i r e d i n the sense t h a t t h e r e w i l l be an increased l i k e l i h o o d of n o n -rejection w h e n u s i n g s t a n d a r d tests, a l t h o u g h as was m e n t i o n e d p r e v i o u s l y , P e r r o n (1990) has proposed a u n i t r o o t test w h i c h allows for the possibility of s t r u c t u r a l shifts. Difficulties arise for the r a p i d convergence r e s u l t s o f Stock (1987) w h i c h u n d e r p i n t h e two-step procedure, a n d for the J o h a n s e n test. T h e r e are problems s u r r o u n d i n g the p a r a m e t e r estimates, n o t least of w h i c h is the i n t e r p r e t a t i o n of the coefficients f r o m an unstable c o i n t e g r a t i n g regres sion as r e l a t i n g to a l o n g - r u n e q u i l i b r i u m s i t u a t i o n . T h e mechanical use of the Engle-Granger approach w o u l d appear to be a l r i g h t i f the p a r a m e t e r s of the model are stable, b u t otherwise i t w o u l d seem to be f r a u g h t w i t h a v a r i e t y of serious p i t f a l l s . T h e r e is therefore a clear need for tests against i n s t a b i l i t y to be u n d e r t a k e n w h e n t h i s approach is employed.
U n f o r t u n a t e l y , there m a y also be problems i n i m p l e m e n t i n g s t a b i l i t y tests. A t t e n t i o n has already been d r a w n to the use of the Chow a n d M H tests w h e n v a r i a b l e s are 1(1). T h e r e m a y also be p r o b l e m s w i t h t h e B L S test w h e n variables are 1(1) b u t n o t cointegrated, w h i c h m a y e x p l a i n t h e r e l a t i v e l y poor performance of t h i s test i n the context of an unsatisfactory E C M for the 1959-1971 p e r i o d , as m e n t i o n e d above. I n such a case i t m i g h t be w o r t h w h i l e e x p l o r i n g t h e use of the B L S procedure i n the context of a V A R model r a t h e r t h a n an E C M .
of d a t a - m i n i n g , t h e i n c l i n a t i o n of the present authors is to favour t h i s type of analysis i n t h e hope t h a t i t w o u l d produce a general consensus o f r e s u l t s . I n c i d e n t a l l y , such an approach m i g h t i m p l y t h a t consideration be given to t h e use o f n e u r a l n e t w o r k t h e o r y i n economic m o d e l l i n g , since t h i s is i n t e n d e d to simulate, albeit crudely, the sort of t r i a l a n d error processes envisaged.7
V I C O N C L U S I O N
T h i s paper has d r a w n a t t e n t i o n to the c u r r e n t concern about t e s t i n g for i n s t a b i l i t y i n t i m e series econometrics. T h e new t e s t for s t r u c t u r a l breaks i n d y n a m i c error-correction models due to B a i , L u m s d a i n e a n d Stock has been described, as has t h e K a l m a n f i l t e r technique for e s t i m a t i n g t i m e - v a r y i n g p a r a m e t e r models. These procedures, a n d several others, have been a p p l i e d to a m o d e l developed to e s t i m a t e e m p l o y m e n t m u l t i p l i e r s for N o r t h e r n I r e l a n d , u s i n g t w o samples of q u a r t e r l y data. T h o u g h t h e study was essen t i a l l y i l l u s t r a t i v e i n n a t u r e , h i g h l i g h i n g the need for caution w h e n a p p l y i n g t h e concepts o f c o i n t e g r a t i o n , t h e f i n d i n g s o f extensive i n s t a b i l i t y a n d r a d i c a l l y d i f f e r e n t e l a s t i c i t y estimates between the t w o periods m a y be o f some i n t e r e s t i n themselves a n d could provide the basis for f u r t h e r research. M o r e i m p o r t a n t , p e r h a p s , is t h e fact t h a t the case study gives rise to a n u m b e r o f general methodological questions concerning the Engle-Granger approach to m o d e l l i n g d y n a m i c economic r e l a t i o n s h i p s . These issues have been discussed b r i e f l y , a n d a suggestion has been made to make greater use of t h e exploratory approach to d a t a analysis i n economic m o d e l l i n g .
T h r e e m a i n conclusions emerge f r o m the paper. F i r s t , applied economists s h o u l d consider u s i n g m o r e general tests for u n i t roots, such as t h a t o f Perron, w h i c h allow for the possibility of s t r u c t u r a l breaks. Second, there is a need for m o r e r o b u s t e s t i m a t i o n a n d t e s t i n g procedures i n c o i n t e g r a t i n g regression. I t m a y be t h a t t h e n e w canonical c o i n t e g r a t i n g regression tech nique proposed b y P a r k (1992) m a y shortly provide a means of coping b e t t e r w i t h c o i n t e g r a t e d models w i t h s t r u c t u r a l i n s t a b i l i t y . T h i r d , economists should perhaps reconsider w h a t some w o u l d see as an over-reliance on para m e t r i c techniques, fostered by the ready a v a i l a b i l i t y of p o w e r f u l computer software, a n d embrace m o r e the s p i r i t of e x p l o r a t o r y d a t a a n a l y s i s a n d consider e x a m i n i n g the use of recent developments i n the f i e l d o f n e u r a l n e t w o r k theory.
REFERENCES
A L O G O S K O U F I S , G . , and R . S M I T H , 1991. "On E r r o r Correction Models: Specific ation, Interpretation and Estimation", Journal of Economic Surveys, V o l . 5.
A N D R E W S , D . W . K . , a n d W . P L O B E R G E R , 1991. "Optimal T e s t s of P a r a m e t e r Constancy", Manuscript, Yale University.
B A I , J . , R . L . L U M S D A I N E , and J H . S T O C K , 1991. T e s t i n g for a n d Dating B r e a k s i n Integrated a n d Cointegrated T i m e Series", M a n u s c r i p t , K e n n e d y School of Government, H a r v a r d University.
B A N E R J E E , A . , R . L . L U M S D A I N E , and J . H . S T O C K , 1989. "Recursive a n d Sequen tial T e s t s of the U n i t Root a n d T r e n d B r e a k Hypothesis: Theory and International Evidence", Manuscript, Kennedy School of Government, H a r v a r d University. B O N D , D . , 1990. "Dynamic Regional M u l t i p l i e r s a n d the Economic B a s e : A n
Application of Applied Econometric Techniques", Papers of the Regional Science
Association, Vol. 69, pp. 21-30.
B O N D , D . , a n d M J . H A R R I S O N , 1992. "Some Recent Developments i n Econometric Model Selection and Estimation", The Statistician , Vol. 41, pp. 315-325.
B R O O K S , R . D . , 1991. "Alternative Point Optimal T e s t s for Regression Coefficient Stability", Manuscript, Department of Econometrics, Monash University.
B R O W N , R . L . , J . D U R B I N a n d J . M . E V A N S , 1975. "Techniques for Testing the Constancy of Regression Relationships over Time", Journal of the Royal Statistical
Society, Series B, Vol. 37, pp. 149-192.
C A M P B E L L , J . Y . , and N . G . M A N K I W , 1987. "Are Output Fluctuations Transitory?",
Quarterly Journal of Economics , Vol. 102, pp. 857-880.
C H O W , G . , 1960. "Tests of E q u a l i t y between Subsets of Coefficients i n Two L i n e a r Regressions", Econometrica, Vol. 28, pp. 591-605.
C O C H R A N E , J . H . , 1988. "How B i g is the Random W a l k i n G N P ? " Journal of Political
Economy, Vol. 96, pp. 893-920.
C H R I S T I A N O , L . J . , 1988. "Searching for a B r e a k i n G N P " , Working P a p e r No. 416, Federal Reserve B a n k of Minneapolis, Minneapolis, Minnesota.
D A V I D S O N , J . E . H . , D . F . H E N D R Y , F . S R B A a n d S . Y E O , 1978. "Econometric Modelling of the Aggregate Time-Series Relationship between Consumer's E x p e n diture and Income i n the United Kingdom", Economic Journal, Vol. 88, pp. 661-692. D E M P S T E R , A . P . , N . M . L A I R D , and D . B . R U B I N , 1977. "Maximum Likelihood from Incomplete D a t a v i a the E M Algorithm", Journal of the Royal Statistical Society,
Series B, Vol. 39, pp. 1-38.
D I C K E Y , D . A . , W . R . B E L L , a n d R . B . M I L L E R , 1986. "Unit Roots i n Time Series Models: Tests and Implications", American Statistician, Vol. 40, pp. 12-26.
D I C K E Y , D . A . , D . W . J A N S E N , a n d D . L . T H O R N T O N , .1991. "A P r i m e r on Cointe-gration with an Application to Money a n d Income", Federal Reserve Bank of St.
Louis Review, Vol. 73, pp. 58-78.
D I E B O L D , F . X . , a n d M . N E R L O V E , 1990. "Unit Roots i n Economic T i m e Series: A Selective Survey", i n T . B . Fomby a n d G . F . Rhodes ( E d s . ) , Advances in Econo
metrics: Cointegration, Spurious Regressions and Unit Roots, Greenwich, C T : J A I
Press, pp. 3-70.
D O L A D O , J J . , T . J E N K I N S O N , a n d S. S O S V I L L A - R I V E R O , 1990. "Cointegration and U n i t Roots", Journal of Economic Surveys, Vol. 4, pp. 249-273.
F A R L E Y , J . U . , and M . H I N I C H , 1970. "Testing for a Shifting Slope Coefficient i n a L i n e a r Model", Journal of the American Statistical Association, Vol. 65, pp. 1,320-1,329.
G R A N G E R , C . W . J . , a n d P . N E W B O L D , 1974. "Spurious Regressions i n Econo metrics", Journal of Econometrics, Vol. 2, pp. 111-120.
H A N S E N , B . E . , 1990. "Testing for Structural Change of Unknown F o r m i n Models with Nonstationary Regressors", Manuscript, Department of Economics, University of Rochester.
H A R R I S O N , P . J . , and C . F . S T E V E N S , 1976. "Bayesian Forecasting", Journal of the
Royal Statistical Society, Series B, Vol. 38, pp. 205-247.
H A R V E Y , A . C . , a n d P . H . J . T O D D , 1984. "Forecasting Economic Time Series with S t r u c t u r a l a n d Box-Jenkins Models: A C a s e Study with Comments", Journal of
Business and Economic Statistics, Vol. 1, pp. 299-315.
H E N D R Y , D . F . , a n d N.R. E R I C S S O N , 1991. "An Econometric Analysis of U K Money D e m a n d i n 'Monetary T r e n d s i n the United States and the United Kingdom' by Milton F r i e d m a n a n d A n n a J . Schwartz", American Economic Review, V o l . 81, pp. 8-38.
J O H A N S E N , S., 1988. "Statistical A n a l y s i s of Cointegration Vectors", Journal of
Economic Dynamics and Control, Vol. 12, pp. 231-254.
K A L M A N , R . E . , 1960. "A New Approach to L i n e a r F i l t e r i n g and Prediction Prob lems", Transactions of the ASME Journal of Basic Engineering, Vol. 83, pp. 35-45. K I N G , M . L . , 1987. "An Alternative Test for Regression Coefficient Stability", Review
of Economics and Statistics, Vol. 69, pp. 379-381.
K I N G , R . G . , C . I . P L O S S E R , a n d S . P . R E B E L O , 1988. "Production, G r o w t h a n d B u s i n e s s Cycles: I I , New Directions", Journal of Monetary Economics, V o l . 21, pp. 309-342.
K I T A G A W A , G . , a n d W. G E R S C H , 1984. "A Smoothness Priors Modeling i n T i m e S e r i e s w i t h T r e n d a n d Seasonality", Journal of the American Statistical
Association, Vol. 79, pp. 378-389.
K U A N , C - M . , a n d H . W H I T E , 1991. "Artificial N e u r a l Networks: A n Econometric Perspective", M a n u s c r i p t , Department of Economics and Institute of N e u r a l Computation, S a n Diego: University of California.
L a M O T T E , L . R . , a n d A . M c W H O R T E R , J r . , 1978. "An E x a c t Test for the Presence of Random W a l k Coefficients i n a L i n e a r Regression Model", Journal of the American
Statistical Association, Vol. 73, pp. 816-820.
M c C A B E , B . P . M . , 1987. "Testing Dynamic L i n e a r Regression Models for Structural Change", Manuscript, School of Economic Studies, University of Leeds.
M c C A B E , B . P . M . , a n d M . J . H A R R I S O N , 1980. "Testing the Constancy of Regression Relationships over T i m e using L e a s t Squares Residuals", Journal of the Royal
Statistical Society, Series C (Applied Statistics), Vol. 29, pp. 119-127.
N E L S O N , C . R . , a n d C . I . P L O S S E R , 1982. "Trends a n d Random W a l k s i n Macro-economic Time Series", Journal of Monetary Economics, Vol. 10, pp. 139-162. N I C H O L L S , D . F . , a n d A . R . P A G A N , 1985. "Varying Coefficient Regression", i n
Handbook of Statistics, Vol. 5, Amsterdam: North Holland, pp. 413-449.
P A R K , J . Y . , 1992. "Canonical Cointegrating Regressions", Econometrica, Vol. 60, pp. 119-143.
P A R K , J . Y . , a n d P . C . B . P H I L L I P S , 1989. "Statistical Inference i n Regression with Integrated Processed: P a r t 2", Econometric Theory, Vol. 5, pp. 95-131.
P E R R O N , P., 1989. "The G r e a t C r a s h , the O i l Price Shock a n d the U n i t Root Hypothesis", Econometrica, Vol. 57, pp. 1,361-1,401.
P E R R O N , P., 1990. "Testing for a U n i t Root i n a T i m e Series with a Changing Mean",
Journal of Business and Economic Statistics, Vol. 8, pp. 153-162.
P E R R O N , P., and T . J . V O G E L S A N G , 1991. "Nonstationarity and Level Shifts with an Application to P u r c h a s i n g Power Parity", M a n u s c r i p t , Econometric R e s e a r c h Program, Princeton University.
P H I L L I P S , P . C . B . , 1986. "Understanding Spurious Regression", Journal of Econo
metrics, Vol. 33, pp. 311-340.
P L O B E R G E R , W., and W. K R A M E R , 1985. "The Local Power of the C u s u m of Squares Test", Manuscript, Institute for Advanced Studies a n d Technische U n i v e r s i t a t Wien.
Q U A N D T , R . E . , 1960. "Tests of the Hypothesis that a L i n e a r Regression System Obeys Two Separate Regimes", Journal of the American Statistical Association, Vol. 55, pp. 324-330.
R A P P O P O R T , P., a n d L . R E I C H L I N , 1989. "Segmented T r e n d s and Non-Stationary Time Series", Economic Journal, Vol. 99, pp. 161-177.
S A R G A N , J . D . , 1964. "Wages a n d P r i c e s i n the U n i t e d Kingdom: A S t u d y i n Econometric Methodology", i n P . E . H a r t , G . M i l l s , a n d J . N . W h i t t a k e r ( E d s . ) ,
Econometric Analysis for National Economic Planning, London: Butterworths.
S C H W E P P E , F . , 1965. "Evaluation of Likelihood Functions for G a u s s i a n Signals",
IEEE Transactions in Information Theory, Vol. 11, pp. 61-70.
S H I V E L Y , T . S . , 1988. "An A n a l y s i s of T e s t s for Regression Coefficient Stability",
Journal of Econometrics, Vol. 39, pp. 367-386.
S H U M W A Y , R . H . , and D . S . S T O F F E R , 1982. "An Approach to Time Series Smoothing and Forecasting using the E M Algorithm", Journal of Time Series Analysis, Vol. 3, pp. 253-264.
S T O C K , J . H . , 1987. "Asymptotic Properties of L e a s t Squares E s t i m a t o r s of Cointe grating Vectors", Econometrica, Vol. 55, pp. 1,035-1,056.
T A N A K A , K . , 1983. "Non-normality of the Lagrange Multiplier Statistic for Testing the Constancy of Regression Coefficients", Econometrica, Vol. 51, pp. 1,577-1,582. W A T S O N , M.W., and R . F . E N G L E , 1985. "Testing for Regression Coefficient Stability
with a Stationary AR(1) Alternative", Review of Economics and Statistics, Vol. 69, pp. 379-381.
Y U L E , G . U . , 1926. "Why do we Sometimes get Nonsense Correlations between Time Series?", Journal of the Royal Statistical Society, Vol. 89, pp. 1-64.