Cold Spray by direct
nozzle-internal measurements of
non-dilute particle motion
Morten-Christian Louis Meyer
February 16, 2018
A thesis submitted to the University of Dublin, Trinity College, in partial fulfilment of
the requirements for the degree of
I declare that this thesis has not been submitted as an exercise for a degree at this or any
other university and it is entirely my own work.
I agree to deposit this thesis in the University’s open access institutional repository or
allow the library to do so on my behalf, subject to Irish Copyright Legislation and Trinity
College Library conditions of use and acknowledgement.
This work presents the research conducted during the development of a new optical particle
velocity measurement in the field of Cold Spray. Cold Spray is a process for surface coating
formation and additive manufacturing, in which powder particles are accelerated by an
expanding process gas in a converging-diverging supersonic nozzle and deposited via
high-speed impact onto a substrate. Temperatures below the melting point are characteristic
for this process, which leads to unique benefits, such as low oxide contents and residual
stresses, as well as sprayability of progressive material combinations and
temperature-sensitive powders. The core feature of this process is the gas-particle nozzle and jet
flow, defining the required high velocities upon impact. Although some aspects can be
simulated reasonably well using computational models, the general validity of such is
case-dependent and coverage of advanced features, such as the particle loading effect, is not
yet established. As a result, application challenges like nozzle clogging and the prediction
of the deposition efficiency cannot be assessed with these methods. In order to overcome
this limitation and to provide means for validation of a new generation of computational
models, a new measurement technique is developed in this study.
The approach combines the Cold Spray process with a Particle Tracking Velocimetry
system and introduces the design of a transparent quartz glass nozzle for internal particle
motion measurements. Particle behaviour during powder injection, nozzle-immanent
dis-tribution, acceleration as well as particle dispersion within the jet were observed at various
pressures and particle loadings. The injector position was varied to study the influence
of the particle injection plume and materials were altered to identify differences between
distinct Stokes number ranges. The character of the particle phase motion was analysed
and particle-particle interactions found to play an important role. Firstly, acceleration of
heating residence time.
Commercially available software (Ansys FLUENTv16.0) was used to construct a com-putational model with advanced methods, including full phase coupling, particle collisions
and a tailored particle phase boundary condition. The value of the presented experimental
set-up for advanced model validation was demonstrated by comparing the measurements
against the simulation results. Limits of such computational models were identified in this
respect: it is necessary to employ an advanced, fully coupled model to obtain adequate
velocity predictions, while dispersion characteristics remain challenging also for detailed
models. This results in very material-dependent opportunities for computational clogging
and heating time analysis. The validation was used to identify ways to manipulate the
First and foremost, I would like to thank my supervisor Dr Rocco Lupoi for his continued
support and encouragement. Neither the direction nor the extent of this research study
would have been possible without his feedback and input. I thank him for managing the
project and acknowledge the financial support of FP7 - Marie Curie Actions and the
co-operation of the Irish Centre for High-End Computing (ICHEC) in this context.
For his valuable advise on experimental fluid dynamics and practical issues in PIV, I am
grateful to Dr Tim Persoons, with whom I shared the honour to unexpectedly repair a
too sensitive device. Many thanks to Dr Shuo Yin, who shared his broad knowledge on
Cold Spray with me, and Dr Barry Aldwell, who always integrated my special wishes in
the bigger picture of the lab. I would like to thank Federico Caruso and Conor Stenson
for their supporting work, Dr Kun “K” Zhao for his cooperation, and Sara Doherty for
helping on the administrative side.
Without the Technical Staff of the Department, none of the measurements would have
happened, so my thanks is with them all, in particular with Mick Reilly for the many
ideas I got from his engineering knowledge, as well as Alex and JJ for their and
manufac-turing skills and for turning my thoughts into reality. In addition, I am thankful to my
supervisor and to Prof John Monaghan for the opportunity to work as a teaching assistant,
lessons that were just as valuable for me as for the students.
Cheers to the Parsons-guys Fede, Sara, Patrick, K, Richard, Sajad, Diarmuid, Claudia,
Dylan, Barry, Robin and many more for good craic during occasional pints or coffees,
and to my housemate and dear friend Jason for all the above, for his opinion, his help,
and so much more.
I deeply thank my family - especially Mom, Sarah, Andreas and Kolja - for supporting
me uninterruptedly.
And finally, I have no words for my gratitude for my Anne. Thank you for carrying me
“So
ungef¨
ahr
stell
ich
mir
die
Quintessenz
von
Dialektik
der
List of Figures xiii
List of Tables xvii
Nomenclature xix
. . . xix
1 Introduction 1 1.1 Context of aims and objectives . . . 5
1.2 Thesis synopsis . . . 8
2 Background 11 2.1 Introduction . . . 11
2.2 Cold Gas Dynamic Spray . . . 11
2.2.1 Early modern Cold Spray . . . 11
2.2.2 Cold Spray process . . . 13
2.2.3 Cold Sprayed coatings . . . 19
2.3 Fundamentals of nozzle flow and particle motion . . . 21
2.3.1 Gas dynamic principles . . . 22
2.3.2 Particulate phase considerations . . . 28
2.4 Gas-particle flow in Cold Spray . . . 32
2.4.1 Analytical modelling . . . 32
2.4.2 Numerical analysis . . . 33
2.4.3 Experimental analysis . . . 47
3.2 Cold Spray analysis system . . . 60
3.2.1 General set-up . . . 60
3.2.2 Gas supply, flow meters and gauges . . . 61
3.2.3 Powder feeder and load cell . . . 62
3.2.4 PTV integration and data acquisition . . . 64
3.2.5 Post-processing . . . 65
3.3 Component development . . . 66
3.3.1 Measurement rig . . . 67
3.3.2 Transparent nozzle . . . 68
3.3.3 Injector needles . . . 77
3.4 Materials and parameters . . . 78
3.4.1 Gas and powder . . . 78
3.4.2 Operating conditions . . . 80
3.5 Particle Tracking Velocimetry . . . 84
3.5.1 Hardware . . . 84
3.5.2 Software . . . 87
3.5.3 Uncertainty analysis . . . 88
3.6 Summary . . . 92
4 Experimental results: Indirect jet flow characterisation 93 4.1 Outline of the results chapters . . . 93
4.2 Introduction . . . 95
4.3 Low pressure operation . . . 96
4.4 High pressure operation . . . 98
4.4.1 Flow and loading conditions . . . 98
4.4.2 Velocity distribution and footprint . . . 99
4.4.3 Mean velocity change and phase interaction drivers . . . 103
5.2 Injection-independent motion . . . 110
5.3 Injection-dependent motion . . . 115
5.3.1 Effect of loading on velocity decrease . . . 115
5.3.2 Particle acceleration from injection to jet . . . 115
5.3.3 Effect of injection plume on particle motion . . . 119
5.4 Statistical particle analysis . . . 124
5.4.1 Velocity magnitude . . . 126
5.4.2 Trajectory angle . . . 129
5.5 Discussion of nozzle clogging . . . 132
5.5.1 Wall normal velocity . . . 132
5.5.2 Tangential velocity . . . 134
5.5.3 Particle-wall collision probability . . . 136
5.6 Properties at impact location . . . 141
5.6.1 Particle velocity footprint . . . 141
5.6.2 Jet dispersion diagram . . . 143
5.7 Summary . . . 145
6 Computational results: Analysis of a new computational model 149 6.1 Introduction . . . 149
6.2 Model development . . . 150
6.2.1 Model equations . . . 150
6.2.2 Geometry and computational grid . . . 153
6.2.3 Case settings and solution strategy . . . 157
6.3 Prediction of velocity . . . 160
6.3.1 Effect of coupling between phases . . . 160
6.3.2 Adequacy of drag on particles . . . 169
6.4 Prediction of dispersion . . . 171
6.4.1 Influences of advanced sub-models . . . 172
6.4.2 Injection statistics and jet dispersion . . . 179
6.6 Summary . . . 190
7 Conclusions and future work 193
7.1 Conclusions . . . 193
7.2 Recommendations . . . 200
References 207
1.1 Human development goals connected to manufacturing . . . 2
1.2 The potential of Additive Manufacturing . . . 4
2.1 Basic cold spray process . . . 13
2.2 Deposition efficiency of Copper and Aluminium . . . 14
2.3 The CS window of deposition . . . 15
2.4 Parameter selection maps for Copper . . . 17
2.5 Particle size and influence on deposition . . . 18
2.6 Particle impact . . . 20
2.7 Four stages of coating formation . . . 21
2.8 Hugoniot relation . . . 24
2.9 Nozzle flow schematic . . . 26
2.10 Over- and under expanded jet patterns . . . 26
2.11 Jet Impingement and Normal Shock Wave . . . 27
2.12 Schlieren shadowgraph of a CS Jet . . . 27
2.13 Particle velocity and temperature parameter . . . 41
2.14 Asymmetric particle footprint . . . 42
2.15 Mass loading effect on particle velocity . . . 43
2.16 Gas structure and particle speed change with loading . . . 44
2.17 Influence of the nozzle length on particle . . . 46
2.18 Schlieren imaging in barrel section . . . 49
2.19 PIV and DPV results from literature . . . 50
2.20 Principle of Particle Image Velocimetry . . . 51
3.3 Measurement section and containment box assembly . . . 67
3.4 CFD optimisation for transparent nozzle deduction . . . 69
3.5 Application nozzle NZ1 and transparent nozzle NZTR . . . 70
3.6 Quartz nozzle components . . . 72
3.7 Nozzle channel geometry . . . 74
3.8 Quartz nozzle assembly . . . 75
3.9 Quartz nozzle concept . . . 76
3.10 Injector needles . . . 77
3.11 Powder size distribution . . . 79
3.12 SEM images of feedstock powders . . . 80
3.13 Laser head and optics . . . 85
3.14 Image calibration . . . 88
3.15 Peak-locking observation . . . 90
3.16 Particle size bias . . . 92
4.1 Initial particle feed rate effect . . . 96
4.2 Relation of feed rate and mass loading . . . 98
4.3 Feed rate effect on particle velocity distribution in NZ1-jet . . . 100
4.4 Radial particle velocity profile comparison . . . 102
4.5 Velocity trend with feed rate . . . 103
4.6 Normalised particle velocity gradients . . . 105
5.1 Particle velocity in converging section of NZTR . . . 111
5.2 Velocity gradient comparison inside and outside nozzle . . . 114
5.3 Particle exit velocity using injector 1-3 . . . 116
5.4 Full-nozzle particle velocity distribution . . . 117
5.5 Peak acceleration within nozzle throat . . . 118
5.6 Axial particle velocity evolution . . . 118
5.7 Injection plumes . . . 120
5.11 Particle residence times with pressure . . . 125
5.12 Velocity probability density of different injections . . . 126
5.13 Pdf of velocity for Stellite-21 and Titanium . . . 127
5.14 Change of velocity statistics from injector to throat . . . 128
5.15 Velocity pdf . . . 129
5.16 Pdf of trajectory angle . . . 130
5.17 Feed pdf . . . 131
5.18 Wall normal velocity . . . 133
5.19 Injector clogging comparison . . . 134
5.20 Wall tangential velocity . . . 135
5.21 Particles on wall collision path . . . 136
5.22 Particles contributing to nozzle clogging risk . . . 137
5.23 Zone of influence for wall collision . . . 140
5.24 Particle velocity profiles in the jet . . . 142
5.25 Jet dispersion diagram . . . 144
6.1 Computational domain geometry . . . 154
6.2 Computational mesh . . . 156
6.3 Gas velocity profile along nozzle . . . 161
6.4 Gas velocity exit and jet profile . . . 162
6.5 Jet contours of velocity and turbulent kinetic energy . . . 163
6.6 Inverse centreline velocity . . . 164
6.7 Gas velocity vectors at injection . . . 165
6.8 Gas phase momentum modulation . . . 166
6.9 Validity of particle velocity change with loading . . . 167
6.10 Comparison of internal particle velocity distribution . . . 168
6.11 Concept of particle phase evaluation . . . 169
6.12 Validation of velocity along the nozzle . . . 170
6.13 Validation of peak acceleration . . . 171
6.17 Comparison of sub-models for evolution in throat . . . 178
6.18 Validation of velocity probability density . . . 179
6.19 Stellite velocity footprint validation . . . 180
6.20 Titanium velocity footprint validation . . . 182
6.21 Comparison of dispersion diagrams . . . 183
6.22 Dispersion diagram for uncoupled and coupled model . . . 184
6.23 Velocity evolution comparison in converging section . . . 187
6.24 Validation of residence times . . . 188
2.1 Turbulence models employed in cold spray modelling . . . 35
2.2 Drag coefficient models used in cold spray . . . 37
2.3 Particle velocity measurements in cold spray . . . 54
3.1 Nozzle dimensions . . . 71
3.2 Injectors configurations . . . 77
3.3 Feedstock powders . . . 78
3.4 Operating conditions . . . 81
3.5 PIV-hardware properties . . . 86
5.1 Probability of particle-wall collisions . . . 138
5.2 Particle-wall collisions of different injectors . . . 139
6.1 Model equations . . . 151
6.2 Computational meshes . . . 155
6.3 Boundary conditions . . . 157
6.4 Boundary parameter settings . . . 158
6.5 Spray footprint comparison . . . 182
Roman symbols
A Cross-sectional area [m2]
b Collision random parameter [-] c Speed of sound [m/s]
CD Particle drag coefficient [-]
cp Specific heat [J/(kgK)]
dinj Diameter [m]
E Specific energy [J/kg] ~
F External body forces coupling term [N/m3]
F Particle-gas volume ratio [-]
~g Gravitational acceleration vector [m/s2]
GrF,n Normalised velocity gradient with volume ratio [-]
GrZ,n Normalised velocity gradient with mass loading [-]
h Height [m]
hj Specific enthalpy [J/kg]
hq Heat transfer coefficient [W/(m2K)]
I Unit identity tensor ~
J Diffusion flux
lturb Integral turbulent length scale [m]
M a Mach number [-] ˙
m Mass flow rate [kg/s]
n Average number of particle collisions [-]
Ncoll/N Percentage of particles with positive wall normal velocity [%]
N u Nusselt number [-]
p Pressure [Pa]
P r Prandtl number [-]
R Specific gas constant [J/(kgK)]
r Radius [m] (geometry), Main line/feeder flow ratio [-] (gas variables) Re Reynolds number [-]
Sh External heat source coupling term [J/(m3s)]
Sk Stokes number [-]
T Local gas temperature [K]
ui Velocity component in i-th dimension [m/s]
V Volume of mesh element [m3]
~v Velocity vector [m/s] v Velocity magnitude [m/s] w Nozzle width in z-direction [m] x Longitudinal location [m]
y+ Dimensionless wall adjacent mesh cell size [-]
Z Particle mass loading [-] Greek symbols
α Trajectory angle [◦]
αp Particle volume fraction [-]
γ Gas heat capacity ratio [-]
δinf luence Width of influence of wall collision in diverging section [m]
Πmom Momentum coupling parameter [-]
ρ Density [kg/m3]
σu Yield stress [N/m2]
τef f Effective deformation tensor [J/m3]
τ Characteristic time scale [s] Φs Shpericity of particle [-]
Subscripts
0 Gas stagnation value
1,2 Collision of particle parcels 1 and 2
∗ Critical (sonic) condition
c Nozzle converging section (geometry), continuous phase (gas variables) c, e Centreline at nozzle exit
cr Critical impact condition d Nozzle diverging section
e Nozzle exit
i Nozzle inlet
inj Injector needle
m Melting point
n, w Normal to nozzle wall
p Particle
p, i Particle impact condition r Relaxation of particle tr Nozzle throat contour t, w Tangential to nozzle wall V Velocity response of particle w, i Impact onto nozzle wall Abbreviations
1D,2D,3D One-, two-, three-dimenstional
DE Deposition Efficiency
DPM Discrete Phase Model
DPV Doppler Picture Velocimetry
DRW Discrete Random Walk model
ER Expansion Ratio
FFT Fast Fourier Transform
FoV Field of View
HVOF High-Velocity-Oxy-Fuel
L2F Laser-two-focus
LES Large Eddy Simulation
MoC Methods of Characteristics
NSE Navier-Stokes equations
NZ1 Cold Spray Nozzle 1
NZTR Transparent Cold Spray Nozzle
pdf Probability density function
PIV Particle Image Velocimetry
PTP Particle Temperature Parameter
PTU Programmable Timing Unit
PTV Particle Tracking Velocimetry
PVP Particle Velocity Parameter
RANS Reynolds-Averaged Navier-Stokes equations
rms Root mean square
RSM Reynolds Stress Model
SEM Scanning Electron Microscope
SoD Stand-off distance
UDF User-defined function
Introduction
There is something fascinating about flows. Humans are amazed by creeks and rivers,
waterfalls, and the waves of oceans. By nature, our intuition is tightly connected to fluids
- gases and liquids. Yet, it is astonishing how mysteriously this un-holdable matter behaves
to us, after thousands of years of study. From the antique times of Archimedes and Julius
Frontinus, through the Islamicate physicists in the middle ages and the disciples of the
renaissance, by Newton, Bernoulli and Euler, to the big names of Helmholtz, Kelvin,
Stokes, Rayleigh, Prandtl and countless more: studies on fluid mechanics were never
suspended.
It is true, that one grows along with one’s tasks. Maybe our fascination for fluid flows
contributed to the exponential growth of complexity and detail of studies. Along with it,
a vast amount of applications were born from technological advancements. It appears that
no relevant process nowadays functions without fluid mechanics. In fact, flowing media are
often core elements in modern automotive, transport and aviation sectors, in construction,
agriculture and food industry, even in biological and biotechnological sciences, as well as
health and medicine.
Technology development in these domains is impossible without manufacturing, the
process of converting raw materials into required shapes and combining their properties
in such a way, that the part can fulfil its function in the bigger picture. Through the
innovation process, new advanced ways of manufacturing are developed, that increasingly
Man-ufacturing is the means by which technological benefits for society are realised. In fact,
economic growth by virtue of improved industrial infrastructure, as well as research and
development of technical solutions, are taken as direct indicators for human development
by the United Nations (UN). On the way to a more peaceful, equal, and prospering planet,
the UN set a series of critically important goals, at least five of which are directly connected
[image:26.612.184.388.202.407.2]to the advancement of manufacturing [1].
Figure 1.1: Human development goals connected to
manufactur-ing
• Affordable, reliable, sustainable and modern energy
Energy efficiency is one of the main drivers in industrial innovation. Lower energy
consumption reduces manufacturing cost and requires fewer resources.
• Sustained and inclusive economic growth & productive employment The industrial sector is a main pillar for employment. A prospering economy ensures
value chains from which local societies benefit. Manufacturing means are therefore
constantly improved by research and industry, in order to open new markets and
amend current production.
• Resilient infrastructure, promoted industrialisation & fostered innovation The previous goal of economic prosperity relies on a network of regional and
In particular research projects provide the required momentum of innovative
pro-duction solutions.
• Sustainable consumption and production patterns
Future industry is required to make efficient use not only of energy, but also of
materials and human resources. Smart, automated, and integrated production lines
aim to reduce material waste, while more effective manufacturing techniques boost
the sustainability of industry by more direct approaches.
• Action against climate change and its impacts
All the above goals eventually lead to the notion of saving the ecological environment
that we live in. Combat against climate change is the most fundamental
responsi-bility to fulfil in developing more efficient and sustainable production methods and
the best motivation for innovation and research.
International research institutions like the European Research Council (ERC) and
national funding organisations like Science Foundation Ireland (SFI) layout their support
strategies and agendas accordingly. Their mission statements promote directing funding
into promising new fields with high potential and far-reaching impact (ERC [2] ) and
in particular to support the best engineering research to advance Ireland’s society and
economy (SFI [3]). In face of this, advanced manufacturing techniques are one focal point
of research and innovation, and they tightly tie in with the human development goals of
the UN, potentially more than other branches of engineering: the manufacturing sector
represents the realisation of engineering concepts, is therefore the largest contributor to
non-financial business economy value added and makes up a significant fraction (10%) of all
enterprises in the European Union (EU), which is a total of 2.1 million companies with 29.9
million employees (values for 2014) [4]. As a consequence, research and innovation in this
vast field has significant impact on our society and carries vast potential for contributions
to the development goals. In this context, Cold Spray is an outstanding example of such
innovative manufacturing processes, representing Additive Manufacturing (AM) in general
[5].
In an additive process, material is added to components rather than subtracted like
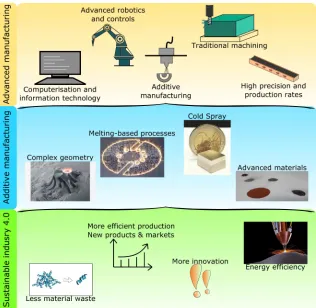
Advanced manufa
cturing
Energy efficiency Traditional machining
Addi
tive manufacturing
Less material waste
Melting-based processes
Cold Spray
Complex geometry
Advanced materials
More efficient production New products & markets
More innovation
Sustainabl
e i
ndusry 4
.0
[image:28.612.128.444.57.365.2]High precision and production rates
Figure 1.2: The potential of Additive Manufacturing among
ad-vanced manufacturing techniques
factually identified AM processes as the family of technologies with the “highest growth
potential in industry”, providing “unprecedented opportunities for businesses” [6]. In the
long term, production can be done locally through 3D-printing, rather than being required
to be relocated to low-cost countries. This reduces logistical effort and the respective
pol-lution and energy consumption. By being a more direct approach to building components,
AM minimises the waste of raw materials and lowers the energy use during manufacturing.
The impact on society even goes beyond these aspects, since vast customisation
opportu-nities and new markets will give rise to a “maker-culture”, in which the character of the
majority of jobs will shift from repetitive to innovative work, and the phase of these deep
changes has already started.
What is offered by melting-based technologies like Selective Laser Melting (SLM) to
date, e.g. producing complex geometries, is going to be complemented by Cold Spray (CS), a relatively recently developed method among a group of “thermal” spray processes.
can be combined within parts, unweldable components joined directly without build-up
of oxides, and material properties adjusted continuously throughout a product. Now
primarily used to apply coatings to engineering components, examples of its benefits are
corrosion and wear resistance, but its potentials are more numerous: customised and
optimised geometries, advanced material and composite parts, optimal manufacturing
times and resources, as well as making assemblies leaner and more reliable [7].
Cold Spray, more than any other additive manufacturing and thermal spray process,
relies on the fluid flow of a gas-particle mixture. It achieves the deposition of material
through high speed impacts of particles, which bond with a substrate. For this, high
velocities are required, realised by a supersonic gas-particle jet that impinges on the
com-ponent [8]. This gas-solid, hence two-phase, accelerating nozzle and jet flow is the heart
of the process. Addressing this importance, one main focus of studies in Cold Spray is
the dynamics of the nozzle flow. Over the last twenty years, the particle velocity and
gas structures in the jet were measured, in order to gather understanding of the working
principles, to design better components, and to find optimal process parameters.
Com-putational techniques were introduced in this process, not only because they help to save
time and resources, but also because some aspects of the flow are hidden in the nozzle and
cannot be measured.
Models used for investigative and design purposes have limited experimental validity
and are difficult to improve. Moreover, many studies focus their models on the capabilities
to predict particle impact velocities for simplified conditions, but drop adequate
represen-tation of spray dispersion and particle impact statistics. If the critical hurdle to assess
the validity of numerical tools in entirely new ways could be overcome, they would reach
a level of accuracy currently not possible. Opening doors to a new level of understanding
of the Cold Spray flow process advances this part of a high-potential engineering field
towards a more innovative, efficient and sustainable future of industry.
1.1
Context of aims and objectives
The growth of the Cold Spray field in the last decades is owed to its immense usefulness.
com-bine incompatible materials, improve strengths of deposits, and design nozzles with very
specific performances. It appears natural that the potential has lead to strong and fast
application-oriented progress. As the literature (chapter 2) shows in detail, new difficulties
were encountered hand in hand with this process: how can difficult-to-reach locations be
accessed on components, how can detrimental nozzle wear be reduced, how could the
par-ticle beam be controlled, or how can the efficiency of the deposition be estimated? These
aspects emerge from the applications, but are deeply rooted in the physics of interactions
of gas and particles. Computational simulations were already used to design short nozzles
to ease access difficulties. However, the models were not ready to explain the performances
of different nozzle shapes and could not assess the impact conditions for the whole powder
rather than single particles, which impeded on the efficiency prediction. The calculation
of particle dispersion in the jet, or the explanation of why nozzles are getting clogged by
the powder under various conditions, were could not be investigated either. This narrative
describes the situation at the beginning of the present work: how can a computational
model be amended to assess these advanced aspects?
For such improvements to be achievable, it is required to gain better understanding
of how the particles behave inside the nozzle, rather than after they exit from it. This is
important, because most critical mechanisms, the acceleration and the dispersion, hence
all gas-particle phase-interactions, occur within the nozzle. The conflict arises when
re-searchers rely on those computational models that, based on their assumptions, do not
cover the responsible mechanisms that take place here. To avoid this, two routes can
be taken. An empirical/application-oriented approach offers the advantage that already
established measurements, in the jet or based on deposits, can be conducted with no need
to measure nozzle-internal mechanisms. Such established observations can be correlated
to some optimum through large numbers of conditions, while it is not generally possible to
assure the causal reasons for the observed behaviour. The latter may however be a
priori-tised aim, because the additional physical insight entails more general solutions that can
be applied to other systems, or leads to unforeseen possibilities to exploit the mechanisms.
In this case, an in-depth investigation through a novel measurement that can identify
the mechanisms in question is necessary. However, this is possible only for a selected set
since, naturally, the region inside the nozzle is not generally accessible to measurements,
obtaining direct data about the particle movement seems prohibitive at first. If this could
be realised nonetheless, the benefit would be significant, as derived models would be based
on the actual observed particle behaviour.
This work takes the challenging second path and aims to measure the particle behaviour
inside a Cold Spray nozzle. It aims to use the gathered new insights to rethink the
computational modelling and include the identified aspects. This is done in order to
provide means to computationally assess the advanced challenges that are faced in CS
applications on the basis of physically validated methods.
With this in mind, the aim of this research project is to design a new experiment
for nozzle-internal particle velocity measurements and use the novel experimental analysis
to demonstrate the validity of an advanced computational model. In this respect, the
following objectives are defined for the research project:
1. The phase coupling in Cold Spray is not fully clarified. Extend current knowledge on
the importance of gas-particle momentum exchange, on the particle dispersion, and
on the influence of mass loading for nozzle-external observations. Identify possible
drivers originating from inside the nozzle.
2. In order to overcome the discovered confinement in model quality, investigate the
conditions during particle acceleration directly. To this end, develop an experimental
set-up for nozzle-internal measurements.
3. Measure and analyse particle behaviour within the nozzle and suggest physical
mech-anisms that explain the observations that following influences induce.
4. Construct a computational model that covers the observed phenomena and
demon-strate new validation opportunities based on the novel experimental data.
To summarise, since the understanding derived from computational studies and
esti-mates of particle properties greatly depends on the validity of the used computational
models, the notion of direct measurements of the particle acceleration and dispersion
car-ries high potential. More detailed knowledge of the fully coupled gas and particle phases
within the Cold Spray nozzle would be beneficial for facing modern design and
result in higher model quality and more predictable quantities, in the long term, even
the statistical distribution of powder impact conditions and the onset of nozzle clogging.
The pursuit of these aims and objectives is reported during the forthcoming chapters, as
outlined in the following synopsis.
1.2
Thesis synopsis
Chapter 2 - Background
This chapter presents the general concepts of the Cold Spray process and differentiates
it from other thermal spray technologies. Besides the introduction of the process and its
parameters, an overview of the essential aspects of flow theory is provided, with emphasis
on the particle motion. Because this study aims to provide means of better model
val-idation and discuss the limits of current models, the core part of the review focuses on
the most common computational modelling approaches. The experimental methods for
flow analysis and particle velocity observations are subsequently summarised. The chapter
foregrounds unanswered questions within the field that give rise to the area of investigation
of the present work.
Chapter 3 - Experimental methodology
The novel methodology introduced in this work is experimental in nature and a detailed
discussion of the equipment and the procedure can be followed in this chapter. Besides
the presentation of the Cold Spray system, the flow control devices and the operation
parameters, the component design is strongly in focus. Most importantly, the transparent
Cold Spray nozzle development is reported. Moreover, the measurement technique is
described and the accuracy of the measured data is assessed in this context.
Chapter 4 - Experimental results: Indirect jet flow
characterisa-tion
Until now, the effect of significant coupling between the particle and gas phase, and with
studies with ambiguous results. The implicit character results from the observation of
particle velocities in the jet, i.e. downstream of the nozzle, in which the acceleration takes place. In order to clarify the necessity of deeper two-phase analysis, this chapter
extends this implicit approach of measurements in the jet by adding changing feedstock
materials and operating pressures to the spectrum of results. In order to advance the
understanding of the particle feed rate as a process parameter for applications nozzles,
this chapter reports a structured investigation of it in a Cold Spray nozzle from previous
work. This aims to identify possible driving mechanisms of the phase interactions and to
make a connection between the two-phase character of the flow and the crucial process
quantities of velocity and dispersion.
Chapter 5 - Experimental results: Direct nozzle-internal
mea-surements
The actual mechanisms that cause the particle behaviour from the previous chapter are
still unknown, and experiments in the jet are insufficient for clarification. Subsequent to
such indirect jet-measurements, velocimetry within the transparent nozzle is expected to
be the new required step. Therefore, the basic concept of this chapter is to analyse the
statistical behaviour of particles within the nozzle under different injection and operation
configurations. This study is the very first report of a quantitative measurement of a
nozzle-internal particulate flow and introduces a variety of novel findings about injection
velocity, nozzle internal dispersion, particle-particle interactions and the acceleration of
particles along the nozzle. In addition, those observations are connected to the velocity
and dispersion of particles within the jet.
Chapter 6 - Computational results: Analysis of a new
computa-tional model
This chapter leads the argumentation back to the beginning of the study and hence to
its main focus. The experimental analysis presented in the previous chapter is applied
validation of the velocity profiles. It discusses and explains the limits of the predictive
capabilities with respect to particle dispersion and suggest possible improvements. After
introducing the computational model, the chapter attempts to answer three main
ques-tions that arise about Cold Spray computaques-tions: Can the velocity level be predicted, is
the dispersion captured, and what does this mean for the assessment of residence times
and wall-interactions - two very important current operational challenges for researchers
working on Cold Spray applications.
Chapter 7 - Conclusions and future work
Finally, this chapter concludes the main aspects and combines them in a bigger picture,
Background
2.1
Introduction
This chapter aims to inform the reader in a concise manner about the general concepts
involved in the Cold Spray (CS) process and the experimental and numerical analysis
methods of gas and particle flow applied in the past. Within this context, it is the focus of
this chapter to foreground unanswered questions that give rise to the area of investigation
of the present work.
2.2
Cold Gas Dynamic Spray
This section aims - with no claim to completeness - to rank CS within the group of
conventional thermal spray processes, to provide an overview over the most important
features and parameters of CS, and to outline some important coating properties.
2.2.1
Early modern Cold Spray
The process of CS was initially developed by a group of researchers lead by Dr. Anatolii
Papyrin during the 1980’s at the Institute of Theoretical and Applied Mechanics of the Russian Academy of Sciences in Novosibirsk [8]. During experiments on supersonic flows around cylindrical bodies, the scientists discovered that their tracer particles deposited
onto the wind-tunnel model. The phenomenon appeared to be connected to the cold
was ready for patent registration in the 1990’s [9–11]. Over the following decades, the
technology was further developed by a rapidly growing number of research groups, at first
located in Russia and the United States, subsequently also in several European and Asian
countries, as well as Australia [12].
As CS is a relatively recently established method, it is considered the “new-comer”
among other thermal spray technologies. This is a group of coating manufacturing
pro-cesses, of which some examples should be given, categorising them according to the source
for feedstock heating: electrical or chemical.
The first category is found in processes such as arc spraying and plasma spraying.
In arc spray, the spray material forms wire electrodes that are molten by applying an
electric arc and accelerated towards the substrate by a compressed air stream. It stands
for high deposition rates and high energy efficiency. Limitations are the conductivity of
the wires and the moderate adhesion strength of the coatings [13]. Plasma spray utilises an
electric arc to generate an ionised plasma as a source of heat for a driving gas that passes
through a nozzle. The feedstock is injected into this hot gas jet in form of powder, molten
and accelerated. The main advantage comes from the extreme temperature level (up to
8000◦
): high-melting materials, in particular ceramics, can be deposited. The downside is
a complex, less efficient system [14].
The second category can be represented by combustion processes, such as flame spray
or High-Velocity-Oxy-Fuel (HVOF). Flame spray uses the heat from the combustion of a
fuel gas to heat the wire or powder feedstock material [14]. In the HVOF process [15], a
fuel is similarly combusted by oxygen to heat the feedstock material, but at a higher flow
velocity. This enables suppression of extreme thermal degradation of the spray particle
by lowering gas temperatures [16].
All these processes are, to different extents, operated at temperatures in excess of the
melting temperatures of the coating material. This is the aspect in which Cold Spray is
a very distinct process: in CS, melding temperatures are generally not crossed and the
energy required to enable bonding between coating particles and substrate material is
provided in a kinetic rather than thermal way - the lower temperature levels are made up
for by much higher particle impact velocities. Considering that coatings can be applied
surface engineering and additive manufacturing. Low thermal input goes hand in hand
with a massive reduction of detrimental thermal effects, such as oxidation, evaporation,
high residual stresses or crystallisation [17]. This provides a possibility to coat
oxidisation-sensitive materials and to combine materials with very different melting temperatures that
are in no other way compatible [8, 18]. These core advantages aside, the process can still
deliver coatings with very low porosity and high adhesive strength [19].
2.2.2
Cold Spray process
Despite possible more complex installations, the basic principle of Cold Spray can be
explained with a minimum set of components that can be seen in the arrangement in
Figure 2.1.
High-Pressure Gas
Gas Heater
Substrate Powder Feeder
Nozzle
Figure 2.1: Basic cold spray process
High pressure gas (Helium or Nitrogen) is fed from a supply into a main line and a
feeder line. The main line gas (process gas) is heated to a desired temperature and
sub-sequently lead into a converging-diverging De-Laval nozzle, in which the gas expands and
accelerates, forming a low-velocity/high-temperature and a high-velocity/low-temperature
part. Simultaneously, the unheated feeder line gas (carrier gas) transports the feedstock
powder to the nozzle and injects either into the converging or the diverging section. A
drag force of the fast moving process gas acts on the individual particles and accelerates
them to velocities in the range of 300−1200m/s [20]. This two-phase flow system is above all other aspects responsible for the coating formation. Upon impact of the fast-moving
particle onto the substrate surface, it undergoes high plastic deformation and reaches a
mechanical bond. The particles must achieve velocities above a certain material-dependent
important process parameters need to be set carefully for each application.
Process gas
Given a specific nozzle design, the supersonic exit velocity of the gas is a function of the
exit Mach number. Consequently, the velocity can be raised by increasing the speed of
sound. Because of its lowest molar mass and highest heat capacity ratio, Gilmore e.g.[21] documented that helium achieved particle velocities twice as high as nitrogen at the same
temperature level. More detailed studies analysed the microscopic changes in the coating
with gas type [22], or investigated gas mixtures using Computational Fluid Dynamics
(CFD) [23]. Because of the high cost of helium as a process gas, it is economically desirable
to save expenses utilising nitrogen when possible. In order to make up for the lower sound
velocity, nitrogen is more commonly pre-heated [24]. Another option is to use a gas
[image:38.612.195.372.356.554.2]recycling system for helium [25].
Figure 2.2: Measurements of the deposition efficiency of Copper
and Aluminium indicate the critical velocities for 19µm-particles
and varying temperatures and pressures [21].
Deposition efficiency
By the late 1990s, the increasing effect of the particle velocity on the deposition efficiency
(DE) was quantified and used for nozzle optimisation [26]. DE quantifies the capability of
deposited particle mass over all injected particle mass [20]. A steep increase of measured
DE with increasing particle velocity is characteristic just above the critical threshold [21],
as shown in Figure 2.2. The average particle velocity, at which the DE is non-zero,
corresponds to the critical velocity.
It is an important general principle of CS that for given nozzles, the goal is the increase
of the particle velocity above this lower threshold to the so-called deposition window.
Particles need to impact below a second, upper threshold, the erosion velocity, where the
impact becomes overly strong. Too high kinetic energy may result in the destruction of the
single particle upon its impact, or in the bulk deformation and erosion of whole layers of
the substrate under formation (see section 2.2.3). The range of velocities in between those
values forms the deposition window [27], visualised in Figure 2.3. Very brittle materials
generally cannot be deposited (without further adaptations). Apart from the material
selection, the window of deposition changes implicitly with other parameters, such as
temperature, by changing both the critical velocity and the impact velocity.
(a) (b)
Figure 2.3: The deposition efficiency depends on the impact
ve-locity and the specific critical and erosion veve-locity. (a) Change of impact structure with impact velocity, (b) implicit effect of tem-perature, from [27].
With a seemingly strong sensitivity to a wide variety of parameters, the critical
ve-locity was required to be quantified more precisely. Indeed, using both experiments and
calculations, the critical velocity was first determined for a small selection of materials
(copper and aluminium) [28], yielding a first empirical formulation. This fitting
particles need to exceed this threshold in order to overcome their material strength and
hence succeed in deforming. Because this was considered a material-dependent process,
here, the size of particles was not considered in the expression.
vcrit = 667−0.014ρ+ 0.08 (Tm−TR)−10−7σu−0.4 (Tm−TR) (2.1)
with TR as the reference temperature of 293K, the melting point Tm, the initial particle
temperature Ti, the particle density ρp and the yield strength σu. While the critical
ve-locity primarily depends on the material strength as covered by this equation, the size of
impacting particles may nonetheless have secondary influences. The different
surface-to-volume-ratios of smaller sized particles may entail a detrimental higher amount of
adsor-bents and surface oxides. Another, more important, origin may be the change in length
scales of heat conduction and size dependent differences in strain rate hardening.
Con-sequently, Schmidt e.g. [29] later further improved the expression for various materials to:
vcr = s
4F1σu
ρp
1− Ti−TR Tm−TR
+F2cp(Tm−Ti) (2.2)
Hence, the critical velocity is reduced by increasing initial particle temperature and
parti-cle density, or by lowering the yield strength and melting point. The substantial difference
to equation 2.1 is that it implicitly includes the particle size based on the equation
cali-bration: the first term in the sum under the square root represents the interplay between
material strength and dynamic load, combining the tensile strength with the
Johnson-Cook equation for thermal softening. This represents the mechanical impact balance and
is calibrated for a specific particle size through fitting coefficient F1. The second term
under the square root represents the energy balance of impact, which is added to the
equation to account for the thermal dissipation through provided kinetic energy. This is
also calibrated through correlation factor F2. It is worth noting that the authors
addi-tionally quantified a minimal (threshold) particle size based on the thermal length scale,
below which no localised heating can lead to bonding.
More recently, Assadi at al. [30] again extended this relation (Eq. 2.2), accounting
particles can exhibit drastically localised heating (hence softening). In contrast, small
par-ticles have rather uniform temperature and, when approaching the melting temperature,
inevitably bond due to total melting (for details of bonding mechanism, see section 2.2.3).
Further studies derived of deposition windows of various materials and their categorisation
according to deformation patterns [31–33].
Stagnation pressure and temperature
Based on good empirical understanding of the critical velocity for a number of materials,
the notion of a coating quality parameter,η = vpi
vcr, the ratio of the particle impact velocity
and the critical velocity, was introduced along with parameter selection maps, as in Figure
2.4 [30].
Figure 2.4: The parameter selection maps for Copper indicate
the evolution of the deposition window (expressed as regions of
coating quality parameterη) with pressurep0, temperatureT0(a)
and particle size dp(b) [30].
Relatively low pressures are required at high temperatures due to the reduced critical
velocity, and vice versa, making gas pressure and temperature most influential process
quantities besides materials [19]. High operation pressures are favourable in that they
enable the use of nozzles with high expansion ratios and hence high Mach numbers. In
turn, for a fixed stagnation pressure, there is an optimal expansion ratio which guarantees
the maximum particle velocity [34, 35].
The temperature effect is twofold. Firstly, the gas temperature influences the particle
temperature, depending on the particle residence time within the flow. Secondly, and most
are crucial and therefore discussed in more detail in a review of the gas-particle flow field
in section 2.3. Because the focus here is on the process itself, it should be emphasised
that, through this connection, a drastic dependency of the pressure and temperature on
DE exists [36], and that a result of increased temperature is often a change in
micro-structure and mechanical properties of the coating, e.g. porosity and tensile strength [37].
Others [38, 39] verified that DE increases with temperature with the limit of onset of
partial melting. Thermal effects on the deposition behaviour of particles are also subject
of numerical studies [40].
Feedstock material and substrate
The above discussion already indicates that the particle-substrate material combination
and the particle size are important. Similarly, the substrate material, angle, curvature,
and size influence the gas impingement and the particle deposition and were constantly
kept in focus in CS related research [20]. Gas-atomized powders are commonly used in
CS applications, most of which exhibit an approximately logarithmic-normal distribution
of particle sizes in the range of 10−100µm, as in Figure 2.5a [41, 42].
(a) (b)
Figure 2.5: (a)Representative copper particle size distribution
for various mean sizes [41] and (b) typical influence of the particle size on the deposition [42].
The particle size and weight determine how the particles follow the gas flow, interact
with shock waves and impact onto the substrate [43, 44]. Light-weight particles follow
the flow more closely and reach higher maximum velocities. Due to its supersonic
substrate (see section 2.3). Small sized/light particles decelerate in this layer much more
noticeably than a particle with more inertia. A too heavy particle however may not cross
the critical velocity, limiting the particle size range that can be deposited, as illustrated in
Figure 2.5b [42]. Moreover, a change in particle morphology is directly connected to the
drag coefficient of the particle and hence the acceleration - irregular particles can reach
higher speeds, but follow less predictable paths and impact in a less controlled way [41, 45].
Early work in CS has shown important effects of the stand-off distance (SoD), the
distance between the nozzle exit and the substrate [19, 26]. In particular, due to varying
impact velocities, the coating quality eventually decreases for large values of the stand-off
distance (>50mm) [36]. More recently, three regions of stand-off distances provided
ex-planations:
1) small, where particle interactions with the bow shock reduce deposition;
2) medium, where the bow shock is weak or has disappeared (favourable);
3) large, where gas velocity is below the particle velocity, causing deceleration [46, 47].
A decreasing particle velocity component normal to the substrate has adverse effects
on the deposition [21]. As the tilt grows, the shock wave first becomes weaker and the
overall velocity of particles increases. Nonetheless, the normal component steeply drops
concurrently [48]. The substrate size changes the flow field due to shock curvature,
espe-cially for small substrates [49]. Similarly, the normal component of the impact velocity
changes for a curved substrate, such as a cylinder, having detrimental consequences for
deposition with distance from the jet centreline [50].
More specific substrate treatment can be beneficial: substrate pre-heating [51] and
particle pre-heating [42] showed to decrease the critical velocity and particle surface oxides
or mixtures of abrasive ceramics and metallic powders can amend the deposition due to
surface activation [52, 53].
2.2.3
Cold Sprayed coatings
There is no conclusive physical explanation of the bonding mechanisms between particle
and substrate as well as particles and other particles. There are, however, prevailing
studies. One key feature in the bonding is the formation of sideways-directed jets of
substrate and particle material away from the particle-substrate contact zone, to be seen
in figure 2.6 [28, 54]. The existence of these jets is evidence of high deformation in a
localised zone in the vicinity of the contact.
Figure 2.6: Simulation of an impacting copper particle onto a
copper substrate, adapted from [28].
It was firstly surmised that bonding is entirely solid-state, also in this contact region
[54, 55]. Subsequent investigations, however, predicted localised melting due to adiabatic
shear instabilities in the close vicinity of the contact surface [28, 56]; a process in which
shearing of the material becomes highly localised due to softening of heated regions that are
unable to remove the dissipated heat during the short time scales of impact. Under ideal
circumstances, the particle deformation progresses from the centre to the outer region.
Sweeping away possible contaminants, it leads to a drastic increase in surface area of
conformal particle-substrate contact under high local pressures that results in bonding.
In addition, the particle deformation in the dented substrate surface induces mechanical
interlocking.
This metallurgical and mechanical bond is described by Van Steenkiste [55] to be one
factor of the more complex overall interaction of substrate and particles during coating
formation. Four regions, shown in figure 2.7, were identified: 1) the particle-substrate bond
in the first layer, as explained above; 2) the compression and realignment of particles in
the direction of least resistance, triggered by follow-on particles, leading to void reduction;
3) the formation of metallurgical bonds between particles in upper layers; 4) potential
bulk deformation of coating material if the kinetic energy is too high (erosion of layers).
So-produced coatings have some unique advantages, e.g. that the material properties of the coating are very close to those of the initial feedstock material: contrasting other
thermally sprayed coatings, oxide contents are less than or equal to those of the feedstock
Voids
Particle motion
Particle 1) Substrate cratering
and first layer build up
2) Particle deformation and realignment
3) Particle-particle bonding 4) Bulk deformation
at access kinetic energy
Figure 2.7: The four stages of coating formation in Cold Spray,
emulated from [55].
size of the feedstock can be maintained [55, 59]. Hereby, the resulting coating
micro-structure is generally inhomogeneous with a primary orientation normal to the impact
direction. The continuous compression of deposited layers of particles during coating
formation leads to void reduction, and hence low porosity of the coating, typically between
0 and 5% [60]. The coating bond strength is crucial for parts that are to be used in
mechanical applications and can be as high as 67MPa for aluminium and 50MPa for
titanium coatings [61, 62]. Due to excessive work hardening during formation, the coating
micro-hardness can be more than twice as high as compared to the feedstock [59]. In
copper coatings, the low oxide content and porosity cause an electrical resistivity close to
pure copper [57].
This overview of the modus operandi and the advantages of the process and coating properties has set the framework in which an advancing understanding of the flow is
beneficial. The following paragraphs shift the attention away from the coating formation
itself to more fundamental aspects of the two-phase nozzle flow as the central element of
the scope of this work.
2.3
Fundamentals of nozzle flow and particle motion
Cold Spray employs a supersonic de-Laval nozzle for particle acceleration, which makes
compressible gas dynamics the most important fundamental physics of the process.
Like-wise, the effects occurring due to the introduction of solid particles in the flow have to be
are introduced on a general level, in order to introduce all required notions in a compact
way. For further information, the interested reader may refer to established literature for
gas dynamics [63]. In succession to this section, the ongoing investigations on the
gas-particle flow in the field of Cold Spray can be discussed without disrupting fundamental
explanation or definition.
2.3.1
Gas dynamic principles
Compressible gas dynamics can be governed fully by the Navier-Stokes equations (NSE)
(2.3-2.5), which comprise the conservation of mass, momentum, and energy of a continuum
of Newtonian fluid. Here, the variables v, T, E, p are the gas velocity, temperature, specific energy and pressure, and the gas properties ρ, mu, and k denote the density, dynamic viscosity, and thermal conductivity respectively. For further notation refer to the
nomenclature.
∂ρ
∂t +∇ ·(ρ~v) = 0 (2.3)
∂
∂t(ρ~v) +∇ ·(ρ~v~v) =−∇p+∇ ·µ
∇~v+∇~vT
−2
3∇ ·~vI
+ρ~g+F~ (2.4)
∂
∂t(ρE) +∇ ·(~v(ρE+p)) =∇ · kef f∇T −
X
j
hjJ~j+τef f ·~v !
+Sh (2.5)
This set of partial differential equations is mathematically complex and has to be solved
approximatively in the majority of cases. It can only be simplified significantly if certain
aspects of the flow are less important, e.g. if the viscous terms can be omitted. This is particularly helpful to point out some important flow properties like in the following
introduction.
Incompressible fluids have the property that local pressure changes are instantaneously
transmitted through the entire flow field. In contrast, fluid elements in compressible fluids
are elastic and, by changing density under pressure fluctuations, transmit the pressure
change to neighbouring elements. This induces an isentropic (specific entropy s remains constant) wave-like spreading of the pressure impulse through the flow field with a certain
involving the specific gas constantR of the gas and and the heat capacity ratio γ.
c=
s
∂p ∂ρ
s=const.
=pγRT (2.6)
In subsonic compressible flow, the fluid velocity is smaller than the speed of sound, and,
the Mach number, which is the ratio of the two, is lower than unity.
M a= |v|
c (2.7)
When M a approaches unity, the transonic regime is reached, in which simplifications for subsonic calculations do not hold. Consequently, M a larger than one represents fluid velocities surpassing the speed at which pressure information can be transmitted through
the medium. This leads to a fundamental change in the fluid behaviour. While in subsonic
regimes, properties both upstream and downstream of the fluid element have an influence
on its state, in supersonic flows, this influence is limited to upstream properties. This gives
rise to the possibility of discontinuous compression waves, so-called shock waves, and an
inverse fluid acceleration behaviour. The latter can be illustrated by the area-velocity
relation, or Hugoniot-equation, whereA denotes the cross-sectional area of the channel.
dv v =−
dA A
1
1−M a2 (2.8)
It states, that a supersonic flow with increasing cross-sectional area will accelerate, and
with decreasing area, decelerate respectively. This trend is the opposite for subsonic flows.
Descriptively, this means that fluid elements at supersonic speeds cannot “know” how the
pressure is going to change downstream, so the only way to respond to more space is to
expand. This expansion increases the velocity and decreases the local speed of sound,
increasing M a further. This is the principle of a converging-diverging nozzle, figure 2.8, which triggers a supersonic flow by a sonic or “critical” flow condition in the restriction.
A useful reference state in compressible flows is the stagnation state, indicated by
subscript “0”, which describes the state of a fluid that thought to isentropically decelerate
to zero velocity. All energy is hence stored in the stagnation pressure p0 and stagnation
Ma<1
Ma>1
Ma
1.0
Figure 2.8: Area-velocity or Hugoniot relation, illustrating the
principle of a de-Laval shaped nozzle.
a complex compressible nozzle flow to a one-dimensional flow. The Hugoniot relation,
in combination with the equation of state for an ideal gas and the isentropic relations of
pressure, density and temperature (with the heat capacity at constant pressure cp)
p=ρRT (2.9)
p0 =p+ρ
v2
2, T0 =T + v2 2cp (2.10) p0 p = T0 T γγ −1 = ρ0 ρ γ1 =
1 + γ−1 2 M a
2 γγ
−1
, (2.11)
can be used to connect the local Mach number to the local cross-section of the nozzle. A
given nozzle geometry therefore gives a fixed idealised Mach number distribution, which
is exploited in nozzle design procedures and holds high value for approximate flow
calcu-lations. The idealisation mainly originates from the fact that no real flow is isentropic.
Although gases tend to have relatively low viscosity, the resulting shear stresses are
sig-nificant in some flow regions. Approaching a stationary wall, for instance, the velocity
decreases, forming the boundary layer. The occurring viscous forces are connected to
dissipation and therefore entropy production that causes the layer to grow. The main
characteristics are described by the Reynolds number Re,
Re= ρvlref
µ (2.12)
problem-specific reference lengthlref. In case of boundary layers, the boundary layer thickness can
be used as the reference, in case of flow around a particle the particle diameter (the latter
is most important in this work).
Boundary layers change the mass flow and momentum flux of the fluid by displacing
the constant velocity region away from the wall. In long ducts or nozzles, this displacement
can be sufficiently big for the boundary layers from adjacent walls to meet and form a
fully developed flow, which represents a limitation to the centreline velocity of a duct or
nozzle.
A second, even more massive contribution to entropy production are turbulent
fluctu-ations. Turbulence is a complex fluid phenomenon - a random motion state that occurs
in flows above a case-dependent critical Reynolds number. The onset of turbulence can
be thought of as an unstable point of the inertial forces, causing flow structures to build
up and collapse in on themselves, producing eddies of a broad band of length scales. For
(locally) isotropic turbulence, these eddies are pictured to decay into smaller and smaller
eddies until they finally dissipate entirely on the smallest scales, the Kolmogorov scales
[63, 64]. As the onset of turbulence is a matter of flow perturbation and flow velocity,
very high speed flows tend to be entirely turbulent. Therefore, this phenomenon is fairly
important in CS nozzle flows.
One limitation of the above statement, that the nozzle geometry defines the Mach
number, is the expansion state of the nozzle. Under- and over-expansion can occur if
the nozzle is operated at too high or too low pressure relative to the ambient conditions
downstream of the nozzle exit. Under-expansion means that the gas has not expanded,e.g.
accelerated, enough and still exhibits higher than ambient pressure at the exit. This causes
the gas jet to expand further after exiting from the nozzle. The opposite is true for
over-expansion, that is characterised by an overly widened nozzle exit, a lower than ambient
pressure and hence a compression of the nozzle gas by the environment. This compression
can be an oblique shock wave at the exit, or even a shock that moves upstream into the
nozzle, if the pressure difference is drastic. Figure 2.9 illustrates this connection and can
be used to follow the possible expansion states.
A shock wave is the discontinuous adaptation of low upstream to high downstream
Adverse pressure
gradients Subcritical flow
Critical condition
Shock in nozzle
Shock at exit
Compression pattern
Expansion pattern
1.0
0 p*/p0 p/p0
[image:50.612.73.500.380.637.2]Sonic condition in restriction
Figure 2.9: Schematic of flow through a de-Laval shaped nozzle,
showing different expansion states.
entropy-producing processes, and results in a sudden deceleration of the fluid. The
strength of a shock wave and the respective losses depend on the upstream Mach number
and the angle of the shock wave, so the higher the pressure difference across the shock
wave, the steeper the angle; a normal shock wave is most intense for a given Mach number.
Strong shocks are additionally characterised by a sub-sonic velocity on the downstream
side and can also be triggered by obstacles, such as a substrate.
Figure 2.10: CFD results illustrating the influence of increasing
pressure on jet patterns: (top) under-expansion due to small nozzle exit (bottom) over-expansion due to wide nozzle exit, from [65].
In reality, the flow features that are created by shock waves and expansion fans are
viscous stresses. Figure 2.10 shows these structures for the under- and over-expanded case.
It can be seen, that the expansion and compression waves reflect on the jet edge and collide
on the centreline of the jet. This produces a pattern, which disintegrates with distance
from the nozzle due to dissipative losses. More detail of the supersonic over-expanded jet
structures can be found in literature [66].
Figure 2.11: Jet Impingement and Normal Shock Wave [67]
Approaching the close vicinity of the substrate, the supersonic jet is forced to decelerate
to subsonic speeds and compress by means of a normal shock wave. Fluid elements passing
through it are then diverted outwards in the radial direction. In reality, the shock interacts
with the shear layer and curves, causing several secondary features, which then reflect off
the substrate wall and produce a complex flow pattern, as can be seen in figure 2.11. The
zone between the substrate and the shock is called the compression layer and has a certain
[image:51.612.244.415.175.311.2]thickness, that depends on the Mach number.
Figure 2.12: Schlieren shadowgraphy image of a typical
over-expanded supersonic jet (a) and subsonic flow (b) [22]

![Figure 2.2: Measurements of the deposition efficiency of Copperand Aluminium indicate the critical velocities for 19µm-particlesand varying temperatures and pressures [21].](https://thumb-us.123doks.com/thumbv2/123dok_us/8812543.919097/38.612.195.372.356.554/measurements-deposition-eciency-copperand-aluminium-velocities-particlesand-temperatures.webp)

![Figure 2.12: Schlieren shadowgraphy image of a typical over-expanded supersonic jet (a) and subsonic flow (b) [22]](https://thumb-us.123doks.com/thumbv2/123dok_us/8812543.919097/51.612.244.415.175.311/figure-schlieren-shadowgraphy-image-typical-expanded-supersonic-subsonic.webp)

![Figure 2.14: Asymmetric particle footprint of different particlesizes at side injection [50].](https://thumb-us.123doks.com/thumbv2/123dok_us/8812543.919097/66.612.207.365.58.268/figure-asymmetric-particle-footprint-dierent-particlesizes-injection.webp)
![Figure 2.15: Initial evidence of particle mass loading effect onparticle velocity [21].](https://thumb-us.123doks.com/thumbv2/123dok_us/8812543.919097/67.612.237.414.356.560/figure-initial-evidence-particle-loading-eect-onparticle-velocity.webp)
![Figure 2.16: Gas structure change simulation (left) and parti-cle velocity loss measurement and simulation (right) with particlemass loading, from [83].](https://thumb-us.123doks.com/thumbv2/123dok_us/8812543.919097/68.612.94.472.60.280/figure-structure-simulation-velocity-measurement-simulation-particlemass-loading.webp)
![Figure 2.18: Schlieren imaging in barrel section of cold spraypnozzle, visualizing structures at increasing stagnation pressures0/p=2.0-7.8 [158].](https://thumb-us.123doks.com/thumbv2/123dok_us/8812543.919097/73.612.208.446.57.388/figure-schlieren-spraypnozzle-visualizing-structures-increasing-stagnation-pressures.webp)
