© 2018, IRJET | Impact Factor value: 6.171 | ISO 9001:2008 Certified Journal | Page 2702
Improving Labour Productivity in Construction Industries
Sreeresh. R
1, Sunil Kumar. J
21Student, Dept. of Civil Engineering, Universal College of Engineering and Technology, Vallioor. 2Assistant Professor, Dept. of Civil Engineering,Universal College of Engineering and Technology, Vallioor.
---***---Abstract -
In the construction industry productivity loss is one of the greatest and severe problems. Despite all the technological advancements, abundance of construction materials, tools, and financial means available to local contractors, construction costs are constantly on the rise, completion durations of projects are substantially increasing, and most projects are significantly overrunning their budgets. The objective of this research, therefore, is to identify and rank the factors that affect the labour productivity on construction sites. A questionnaire was preferred as the best effective and suitable data-collection technique for the study. SPSS (Statistical Package for Social Science) software is used in this study for analyzing the data from the field survey. The SPSS Statistics Base program covers all basic statistical needs. It includes crosstabs, frequencies, descriptive statistics, correlations, and all comparisons of mean scores.Key Words: Productivity, Cost, Data measurement, Management, Survey, Analysis.
1. INTRODUCTION
Construction productivity has become such a buzz word and one of the most frequently researched topics. In most countries, labour cost comprises 30 to 50% of the overall project’s cost, and thus is regarded as a true reflection of the economic success of the operation. There are many challenges facing the construction industry but one of the most important is low productivity. There are many challenges facing the construction industry in Kerala, but one of the most important, the writers debate, is low productivity. Despite all the technological advancements, abundance of construction materials, tools, and financial means available to local contractors, construction costs are constantly on the rise, completion durations of projects are substantially increasing, and most projects are significantly overrunning their budgets. The objective of this research, therefore, is to identify and rank the factors that affect the labour productivity on construction sites. To achieve this objective, astatistically representative sample of contractors was invited to participate in a structured questionnaire survey, comprising 30 productivity factors, classified under the following five primary groups. These are manpower, external, communication, resources and miscellaneous.
The main aim and objective of this study focuses on views from the construction industry about various factors affecting labour productivity, analyses factors affecting the labour productivity impact, and suggests appropriate measures that can be taken to improve labour productivity. Other objectives of this study are following:
Analyzes and quantifies previous studies in depth. To identify the key factors affecting the labour
productivity.
To find the relation between the factors.
Conduct the comparison and significance between the factors.
To rank the factors based on their intensity.
2. METHODOLOGY
Survey research is defined as collection of different data by asking people questions. The data collection process used in this research had the option of two basic methods: questionnaires and personal interviews. A questionnaire was preferred as the best effective and suitable data-collection technique for the study. It was concluded that the questionnaire was described as a self-administered tool with web-design questions, an appropriate response. A questionnaire in a field survey format comparatively requires less duration and saves cost for the researcher while permits respondents to response the questionnaire at their personal ease. However, for this approach the reply rate is usually higher as compared to web surveys. Data was collected from literature reviews from books, journals, articles, seminar conferences, and websites which emphasize building construction’s labour productivity. A survey was given to employees from different trades involved with the construction project.
2.1 Organization of the Questionnaire
One of the biggest concern of the research study was about number of responses with complete information. Recognition of respondents about the benefits and uses of this research study was also of great concern.
2.2 Data Measurement
© 2018, IRJET | Impact Factor value: 6.171 | ISO 9001:2008 Certified Journal | Page 2703 previously used in other studies. Slight modifications were
made to the typical conditions after they were reviewed by the participants. Further, detailed questionnaire was developed to calculate the factors affecting labor productivity in building construction.
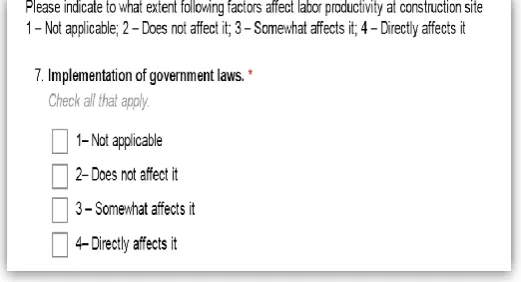
In order to select the suitable technique of study, the level of measurement is to be studied. For each measurement type, there are appropriate methods that can be applied. In this research, ordinal scales were used. An ordinal scale, as shown in Figure 1, is a ranking or a rating of data that normally uses integers in ascending or descending order. The numbers assigned (1, 2, 3, 4) neither indicate that the intervals between scales are equal, nor do they indicate absolute quantities. They are merely numerical labels based on Likert scale.
Fig -1: Likert ordinal scale used in this survey
2.2.1 Criteria for Data measurement
Keep it labeled: Numbered scales, or scales that are marked from 1 to 4, for instance, have also proven to give survey respondent’s trouble, since they might not immediately know what end of the spectrum skews positively versus negatively. Instead, use words to label your scales, i.e. ‘poor’ ranging to ‘excellent’.
Keep it unipolar: Whenever possible, try to use a “unipolar” scale that ranges from “extremely” to “not at all,” rather than extremely one thing to extremely another. Unipolar scales are just easier for people to think about, and you can be sure that one end is the exact opposite of the other, which makes it methodologically more sound as well.
Keep it continuous: Response options in a scale should be equally spaced from each other. (The distance between scale points should be the same throughout the scale, which makes the scale clear and less ambiguous.) This can be tricky when using word labels instead of numbers.
Keep it inclusive: Scales should span the entire continuum of responses. For example, if a question
asks how hot your coffee was and the answers range from “extremely hot” to “moderately hot”, respondents who think the coffee wasn’t hot at all won’t know what answer to choose.
Keep it logical: Add question logic to save your survey takers some time! For example, let’s say you want to ask how much your patron enjoyed your restaurant, and then get more details only if they were unhappy with something. To do this, just add question logic so that only those who are unhappy skip to a question asking for improvement suggestions.
Keep it interrogative: Ask questions whenever possible instead of using agreement with statements. Avoid scales of agreement or disagreement whenever possible as they are subject to an acquiescence bias. This means that survey takers are more likely to agree with statements no matter what they say, and less likely to read the question carefully.
2.3 Questionnaire Distributions
The target groups in this study were professionals from the construction industry. A list of 100 building-construction organizations was obtained from the Lensfed (Licensed Engineers Federation). The sample size can be calculated with the following equation for a 94% confidence level.
n = n’/ [1+(n’/N)]
Where, n= Total number of population
N = Sample size from a finite population
n’ = Sample size from an infinite population = S2/V
S2= the variance of the population elements and
V = a standard error of the sampling population. (Usually, S= 0.5, and V = 0.06.)
n’=S2/V2= (0.5)2/(0.06)2= 69.44 For N=100
n = 69.44/ [1+ (69.44 / 100)] = 41
To obtain 94% of confidence level, it was calculated to send the questionnaire to 41 organizations to accomplish a 94%. For getting more accuracy and precision for the study we take 80 respondents instead of 41.
3. RESULT AND ANALYSIS
In this research there are mainly three types of analysis are done and they are,
(1) Perason’s product moment correlation method (2) One way anova test and
[image:2.595.39.300.283.424.2]© 2018, IRJET | Impact Factor value: 6.171 | ISO 9001:2008 Certified Journal | Page 2704
3.1 Pearson’s Correlation Test
The Pearson product-moment correlation coefficient (Pearson’s correlation, for short) is a measure of the strength and direction of association that exists between two variables measured on at least an interval scale. Many basic analysis projects involving data exploration, descriptive statistics and simple inferential statistics can be successfully completed using a spreadsheet package such as Microsoft Excel. SPSS comes into its own for more advanced projects, especially those requiring statistical routines not available in standard spreadsheet packages and those involving multivariate analysis. Project involves either of the latter, consider using SPSS (or a similar package) for data analysis. SPSS can be used to calculate Pearson’s r, using the Bivariate correlation command. SPSS will also report tests of statistical significance. We will show this applied to measure and test the correlation between satisfaction and commitment in the customer satisfaction.sav dataset. The routine is similar for the other tests.
The sample correlation coefficient between two variables x and y is denoted r or rxy, and can be computed as:
where cov(x, y) is the sample covariance of x and y; var(x) is the sample variance of x; and var(y) is the sample variance of y.
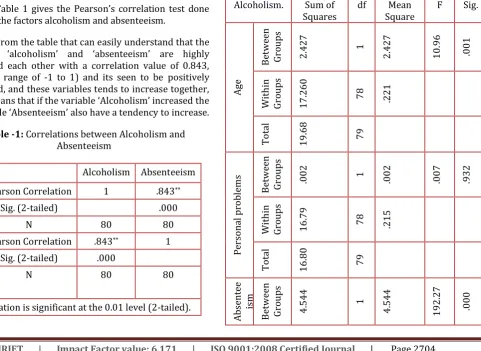
Table 1 gives the Pearson’s correlation test done between the factors alcoholism and absenteeism.
[image:3.595.77.559.439.790.2]From the table that can easily understand that the variables ‘alcoholism’ and ‘absenteeism’ are highly correlated each other with a correlation value of 0.843, (within a range of -1 to 1) and its seen to be positively correlated, and these variables tends to increase together, which means that if the variable ‘Alcoholism’ increased the co-variable ‘Absenteeism’ also have a tendency to increase.
Table -1: Correlations between Alcoholism and Absenteeism
Alcoholism Absenteeism
A
lco
ho
lis
m Pearson Correlation 1 .843**
Sig. (2-tailed) .000
N 80 80
A
bs
ent
ee
is
m Pearson Correlation .843** 1
Sig. (2-tailed) .000
N 80 80
**. Correlation is significant at the 0.01 level (2-tailed).
3.2 One-Way Anova Test
The One-Way ANOVA ("analysis of variance") compares the means of two or more independent groups in order to determine whether there is statistical evidence that the associated population means are significantly different.
The main assumption in this test is; the independent variable should consist of two or more categorical, independent groups. Typically, a one-way ANOVA is used when you have three or more categorical, independent groups, but it can be used for just two groups. One-Way ANOVA is a parametric test. The null and alternative hypotheses of one-way ANOVA can be expressed as:
H0: µ1 = µ2 = µ3 =...= µk
Where,
µi is the population mean of the ith group (i = 1, 2,..., k)
Table 2 shows the one way anova comparison test done in between the variables such as age, personal problems and
absenteeism with respect to the variable Alcoholism. In this
study we can understand that there is high significance
between Alcoholism and Personal problems (‘Personal problems’ get a value of 0.932 out of 1.00).
Table -2: ANOVA comparison between the variables w.r.t Alcoholism
Alcoholism. Sum of
Squares df Square Mean F Sig.
A ge B etw ee n G ro up s 2. 42 7 1 2. 42 7 10 .9 6 .0 01 Wit hin G ro up s 17 .2 60
78 .221
T ota l 19 .6 8 79 Pe rs ona l p ro bl em s B etw ee n G ro up s .0
02 1 .002
.0 07 .9 32 Wit hin G ro up s 16 .7 9
78 .215
T ota l 16 .8 0 79 A bs ent ee is m B etw ee n G ro up s 4. 54 4 1 4. 54 4 19 2. 27 .0 00
x
y© 2018, IRJET | Impact Factor value: 6.171 | ISO 9001:2008 Certified Journal | Page 2705
Wit
hin
G
ro
up
s
1.
84
3
78 .024
T
ota
l
6.
38
8
79
3.3 Ranking of Variables
The results obtained from the ranking of variables were further divided into 3 main categories such as
a. The overall factors in the ascending order based on their mean values
b. The factors directly affects the labour productivity c. The factors that less affects the labour productivity.
The 5 sub categories based on their groups and they are given manpower, external, communication, resources and miscellaneous factors.
3.3.1 Manpower factors affecting labor productivity
Labour absenteeism was ranked 1st in the manpower group, with a mean value of 3.91, and in 1st among all 30 factors that affect labour productivity. Alcoholism ranked 2nd in the manpower group, with a mean value of 3.91, and 2nd among all 30 factors that affect labor productivity. Consuming alcohol at the construction site may lead to various negative effects on other laboures who are working. Alcohol consumption may lead to rework, misplacing the job work, and accidents, thus completely or partially stopping the construction work and affecting labour productivity. The chart 1 shows the ranking of the various factors for the manpower group
19%
19% 19%
18%
12% 13%
Manpower
Absenteeism
Alcoholism
Disloyality
lack of experience Age
Personal problems
Chart -1: Manpower Factors affects labour productivity
3.3.2 External factors affecting labor productivity
Chart 2 illustrates the ranking of factors for the external group. Payment delays were ranked 1st in the external group, with a mean value of 3.28, and 13th among all 30 factors that negatively affect labor productivity.
17% 13%
10% 15%
15% 15%
15%
External
Payment Delays
Rework
Training Sessions
Implementation of Govt.Laws Design Changes
Supervision Delays
Inspection Delays
Chart -2: External Factors affects labour productivity
3.3.3 Communication factors affecting labor productivity
Chart 3 shows the ranking of the factors for the communication group. ‘Dispute with owner’ was ranked 1st in the communication group with a mean value of 3.22, and 20th among all 30 factors affecting labor productivity.
26%
26% 24%
24%
Communication
Dispute With Owner Dispute With Designer Change Orders From Designers Change Orders From The Owners
Chart -3: Communication Factors affects labour productivity
3.3.4 Resource factors affecting labor productivity
© 2018, IRJET | Impact Factor value: 6.171 | ISO 9001:2008 Certified Journal | Page 2706 17%
15%
13% 14%
13%
14% 14%
Resources Violation of safety laws
Increase The Price Of Materials
Lack of required tools
Poor site conditions
Inadequate
transportation facilities Material storage location
Insufficient lighting
Chart -4: Resource factors affecting labor productivity
3.3.5 Miscellaneous factors affecting labor productivity
Chart 5 shows the ranking for factors of the miscellaneous group. Accidents were ranked first in the resource group, with a mean value of 3.78, and were sixth among all 30 factors affecting labour productivity.
27%
25% 15%
23% 10%
Miscellaneous Accidents
Shortage of water and power supply Overtime
Weather conditions
Chart -5: Miscellaneous factors affecting labor productivity
4. CONCLUSION
In today’s world, the construction industry is rated as one of the key industry. It helps in developing and achieving the goal of society. Study and knowledge of constructionproductivity are very important because they cause losses to the governing agencies and also influence the economics of the construction industry. Prior knowledge of labour productivity during construction can save money and time. Investments for these projects are very high and because of the complexity in construction, various factors canhighly affect overall productivity, thus the project can end up adding even more time and money in order to be completed. This research is intended to identify the causes of probable factors affecting labour productivity in building
construction. This study investigates all possible factors through a structured questionnaire administered all over Kerala. The survey results are subjected to analysis, and the ranking of factors is calculated. Based on the correlation between the variables, many variables are positively correlated; some of them are negatively correlated; some variables have no significant relation and the data used in the study is from small companies executing small building projects. The basic ideas of the research are to study various factors affecting labour productivity on construction.
5. FUTURE RESEARCH
The distribution of the questionnaire and its study are limited with in Kerala and the data used in this study is from small companies executing small building projects. Future study could be done in other parts of the Country and could emphasize specific types of building construction, including commercial, education, government buildings, skyscrapers, etc. There is a need to study the productivity levels in other types of projects. Only a few studies are conducted in this area using SPSS and the output of the project is valuable for researchers as well as companies in this field. A study similar to the present research is needed for transportation projects to find factors that affect the productivity of highway construction, which will help departments of transportation to minimize unnecessary cost and project-schedule delays.
REFERENCES
[1] M. R. Abdul Kadir and W. P. Lee, “Factors affecting construction labour productivity for Malaysian residential projects”, Journal of Engineering Science and Technology, vol. 16, 2005, pp. 2467-2472.
[2] J. Adrian, “Construction productivity improvement”, Journal of Construction Engineering and Management, vol. 11, 1987, pp. 52-64.
[3] E. H. Allmon, and C.T. Borcherding, “Construction labor productivity trends”, Journal of Construction Engineering and Management, vol. 217, 2000, pp. 185-200.
[4] S. Hanna and C. S. Taylor, “Impact of extended overtime on construction labor productivity”, ASCE Journal of Construction Engineering Management, vol. 131(6), 2005, pp. 734-740.
[5] F. C. Harris and G. D Holt, “A survey of constraints on Iranian construction operatives productivity”, Construction Management and Economics, vol. 14(5), 1996, pp. 417-426.