INTRODUCTION
The T-box genes encode a large family of transcription factors with about 20 members in most vertebrate species and are important for many developmental processes, including limb, heart and cranio-facial development (Naiche et al., 2005). In addition, T-box genes play an integral role during vertebrate gastrulation, highlighted first in the mouse by the identification of the T/Brachyury gene (Dobrovolskaïa-Zavadskaïa, 1927), the first T-box gene to be molecularly identified (Herrmann et al., 1990). Since the cloning of Brachyury, orthologs have been found in Xenopus(Smith et al., 1991), zebrafish [ntl(Schulte-Merker et al., 1992) and brachyury (Martin and Kimelman, 2008)], Ciona intestinalis (Corbo et al., 1997), chick (Kispert et al., 1995) and many others (Naiche et al., 2005), including species as distant from vertebrates as hydra (Technau and Bode, 1999), suggesting that Brachyuryis an ancient gene. In vertebrates, Brachyury homologs are expressed throughout the presumptive mesoderm during gastrulation and later in the tail bud and notochord (Kispert et al., 1995; Schulte-Merker et al., 1992; Smith et al., 1991; Wilkinson et al., 1990). Loss of Brachyury function causes a range of deficiencies in posterior mesoderm and notochord (Herrmann et al., 1990; Halpern et al., 1993; Schulte-Merker et al., 1994; Conlon et al., 1996; Martin and Kimelman, 2008).
Members of the Tbx6/16 subfamily of T-box factors also play important roles in mesoderm formation. In mouse, Tbx6is expressed in the presumptive mesoderm during gastrulation and in the tail bud
and presomitic mesoderm during segmentation (Chapman et al., 1996). Strikingly, the paraxial mesoderm develops as neural tissue in Tbx6mutants (Chapman and Papaioannou, 1998). Zebrafish contain paralogs of mouse Tbx6, including spadetail(spt,tbx16), tbx6and tbx24, that are expressed in the presumptive non-axial mesoderm (Ruvinsky et al., 1998; Griffin et al., 1998; Hug et al., 1997; Nikaido et al., 2002). Zebrafish spt mutants have severe defects in trunk paraxial mesoderm formation as a result of incorrect cell migration and specification (Kimmel et al., 1989; Ho and Kane, 1990; Amacher and Kimmel, 1998).
Although spt and ntl mutant phenotypes have been well characterized and some Spt/Ntl targets have been identified (Yamamoto et al., 1998; Goering et al., 2003; Gourronc et al., 2007), identification of Spt- and Ntl-responsive regulatory elements is necessary to fully understand how these genes regulate mesoderm development. First, the identification of gene regulatory regions reveals which genes are direct targets of the factors and how they fit into the regulatory hierarchy of mesoderm patterning. Second, regulatory element identification may uncover features, such as binding site number and/or orientation of co-regulator binding sites, that are required for maximal response. The importance of T-box factor co-regulators is highlighted by the finding that Xbra directly interacts with the transcription factor Smad1, which is crucial for the activation of some targets in Xenopus(Messenger et al., 2005).
We have designed a moderate throughput method for identifying and characterizing Spt- and Ntl-responsive regulatory elements. First, we identified putative downstream targets by measuring genome-wide transcription in Spt- and Ntl-deficient embryos. We performed in vitro binding selection assays to generate binding site models to search non-coding sequence around putative targets for binding motif clusters, and prioritized these clusters using comparisons to other fish genomes. We demonstrate that Spt and Ntl bind two putative regulatory regions in vivo and in vitro, and have tested both regions for transcriptional activity using a transgenic reporter assay. Our results place Spt and Ntl directly upstream of tbx6, a T-box gene involved in posterior mesoderm specification (Hug et al., 1997).
Identification of direct T-box target genes in the developing
zebrafish mesoderm
Aaron T. Garnett1, Tina M. Han1, Michael J. Gilchrist2, James C. Smith2,3, Michael B. Eisen1,4,5, Fiona C. Wardle6 and Sharon L. Amacher1,*
The zebrafish genes spadetail (spt) and no tail (ntl) encode T-box transcription factors that are important for early mesoderm development. Although much has been done to characterize these genes, the identity and location of target regulatory elements remain largely unknown. Here, we survey the genome for downstream target genes of the Spt and Ntl T-box transcription factors. We find evidence for extensive additive interactions towards gene activation and limited evidence for combinatorial and
antagonistic interactions between the two factors. Using in vitro binding selection assays to define Spt- and Ntl-binding motifs, we searched for target regulatory sequence via a combination of binding motif searches and comparative genomics. We identified regulatory elements for tbx6and deltaD, and, using chromatin immunoprecipitation, in vitro DNA binding assays and transgenic methods, we provide evidence that both are directly regulated by T-box transcription factors. We also find that deltaDis directly activated by T-box factors in the tail bud, where it has been implicated in starting the segmentation clock, suggesting that sptand ntlact upstream of this process.
KEY WORDS: Enhancer prediction, Gene regulation, No tail/brachyury, Spadetail/tbx16
Development 136, 749-760 (2009) doi:10.1242/dev.024703
1Department of Molecular and Cell Biology and Center for Integrative Genomics, University of California, Berkeley CA 94720, USA. 2Wellcome Trust/Cancer Research UK Gurdon Institute, Tennis Court Road, Cambridge, CB2 1QN, UK. 3Department of Zoology, Tennis Court Road, Cambridge CB2 1QN, UK. 4Genomics Division, Lawrence Berkeley National Laboratory, Berkeley, CA 94720, USA. 5California Institute for Quantitative Biosciences, Berkeley, CA 94158, USA. 6Department of Physiology, Development and Neuroscience, Anatomy Building, Downing Street, Cambridge CB2 3DY, UK.
*Author for correspondence (e-mail: [email protected])
Accepted 30 December 2008
D
E
V
E
LO
P
M
E
N
In addition, we show that T-box factors directly regulate deltaD (dld) in the posterior tail bud. As dldhas been suggested to prime the segmentation clock (Mara et al., 2007), we suggest that Spt and Ntl play an important role in initiating cyclic gene expression in the presomitic mesoderm. Finally, the T-box sites that we defined within the tbx6regulatory region cluster with functional Tcf/Lef transcription factor binding sites (Szeto and Kimelman, 2004), suggesting that Spt and Ntl are required together with Wnt signaling to regulate some targets. Several other putative target genes we have identified are known targets of vertebrate Wnt signaling, including the mouse dldhomolog Delta-like 1(Hofman et al., 2004), suggesting that an interaction between T-box genes and Wnt signaling in gastrula mesoderm is widespread.
MATERIALS AND METHODS
Zebrafish stocks and husbandry
Adult fish strains were kept at 28.5°C on a 14-hour light/10-hour dark cycle. Embryos were obtained from natural crosses or in vitro fertilizations and staged as previously described (Kimmel et al., 1995).
Morpholino injections
The morpholino (MO) combination needed to phenocopy spt–;ntl–mutant
embryos was determined by injecting translation-blocking MOs targeting either spt or ntl into the complementary single mutant. Injections were performed as described by Nasevicius and Ekker (Nasevicius and Ekker, 2000). A combination of four MOs reliably phenocopied spt–;ntl–mutants
(see Fig. S1 in the supplementary material).
mRNA isolation and microarray hybridization
RNA was collected at 75% epiboly from embryos injected with MOs against sptand/or ntlor control embryos injected with Danieau solution plus 0.25% Phenol Red. Samples were prepared and hybridized as previously described (Ouyang et al., 2008). Array probes consisted of the Compugen/Sigma-Genosys zebrafish oligo library (GEO platform accession number GPL7343). Three biological replicates were performed for each treatment and genes with significantly different expression levels in MO-injected embryos versus controls were identified using a Student-Newman-Keuls post hoc test.
Gene expression time course profiling
Gene expression profiles were downloaded from http://giscompute.gis.a-star.edu.sg/~govind/zebrafish/data_download.html (Mathavan et al., 2005) and visualized using MapleTree (http://rana.lbl.gov/EisenSoftware.htm). We normalized expression levels by setting the point of maximum expression for each gene to 1.
Recombinant Spt-GST and Ntl-GST protein preparation and in vitro DNA binding assays
spt-and ntl-GST fusion constructs were created in the vector pGEX-5X-1. Proteins were purified basically as described by Yagi et al. (Yagi et al., 2004). SELEX experiments were performed as described previously (Senger et al., 2004) and details can be provided on request. After 3-4 rounds of selection bound oligomers were subcloned and sequenced. Binding competition assays with genomic sequences (Fig. 5) were carried out as described previously (Chan et al., 2003).
Binding site score matrix construction and genome searches
Using Spt and Ntl SELEX data and previously identified binding sites for Tcf/Lef and Suppressor of Hairless (see Fig. S6 in the supplementary material), the program PATSER (Hertz and Stormo, 1999) was used to generate binding site score matrices. Sequences matching a score matrix with a P-value of ≤0.001 were counted as binding sites. We obtained gene models from the RefSeq database (Pruitt et al., 2005) and genomic positions from the UCSC genome browser (Kent et al., 2002; Karolchik et al., 2008) (Sanger Institute, 2004: ftp://ftp.sanger.ac.uk/pub/sequences/zebrafish). UCSC genome browser-annotated repetitive sequences (Smit et al., 2007; Jurka, 2000) were not included in genome searches.
Chromatin Immunoprecipitation (ChIP)
Chromatin immunoprecipitation on 75-85% epiboly zebrafish embryos was performed as previously described (Wardle et al., 2006; Morley et al., 2009) using anti-Ntl antibody (Schulte-Merker et al., 1992) or anti-Spt antibody (Amacher et al., 2002). The microarrays used contain probes ranging from 9 kb upstream and 3 kb downstream of transcription start sites. ChIP PCR was carried out using standard techniques (Morley et al., 2009).
Reporter plasmid construction
The I-SceI-based plasmids mCherry::pXex:GFP and the Tol2-based mCherry::pXex:GFP construct were based on the previously described GFP::pXex:BFP construct (Szeto and Kimelman, 2004) (details can be provided on request).
Regulatory element fragments were amplified from genomic or plasmid DNA with high fidelity polymerase and inserted into reporter constructs using standard molecular biology techniques. The dldTol2 construct was made using Gateway cloning procedures and plasmids from Tol2 Gateway kits (Villefranc et al., 2007; Kwan et al., 2007). Site-specific mutagenesis was carried out using PCR-based methods. Primer sequences can be provided on request.
Generation of transgenic zebrafish
Reporter constructs were injected as previously described for I-SceI-based transgenesis (Thermes et al., 2002) and Tol2-based transgenesis (Kawakami, 2004; Kwan et al., 2007). Transiently transgenic embryos were grown to the appropriate stage and those with GFP expression at the blastoderm margin or in the tail bud and somites were classified as expressing mCherry in these regions robustly, faintly or not at all. To generate stable transgenic lines, germline transgenic founders were identified by crossing to wild-type fish. Embryos from these crosses were raised and their offspring analyzed.
In situ hybridization, photography and mounting
Whole-mount in situ hybridization was performed as described (Thisse et al., 1993) with modifications (Melby et al., 1997). Digoxigenin-labeled RNA probes were synthesized from templates as cited in Fig. 1. Embryos were cleared and mounted as described previously (Griffin et al., 1998).
RESULTS
Expression analysis identifies sptand ntltarget genes
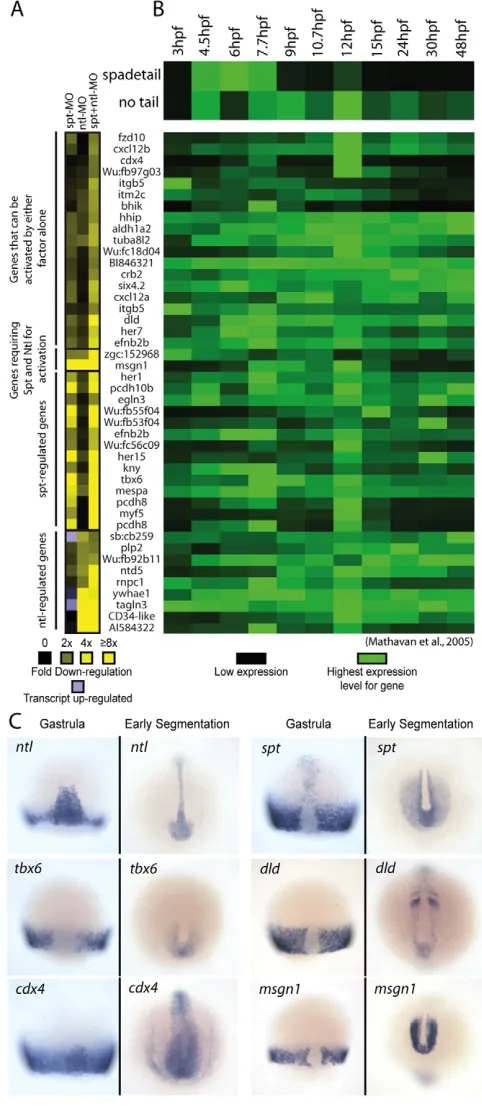
Mutational analyses have shown that whereas sptandntl have distinct functions (Kimmel et al., 1989; Halpern et al., 1993) they also have partially redundant roles (Amacher et al., 2002). We measured genome-wide gene expression in sptand/or ntl-deficient embryos to identify their putative downstream targets, focusing on downregulated genes as Spt and Ntl homologs appear to act mainly as transcriptional activators (Horb and Thomsen, 1997; Conlon et al., 1996). We depleted embryos of Spt and Ntl activity using antisense morpholinos (MOs) targeting sptand ntltranscripts (see Fig. S1 in the supplementary material). To identify genes most likely to be direct targets, we measured transcript levels at mid-gastrulation [75% epiboly, 8 hours post-fertilization (hpf)], soon after sptand ntl expression normally begins and before mutant phenotypes become morphologically apparent. Genes with significantly different expression levels in depleted embryos (compared with control embryos) that were downregulated ≥2-fold were considered further. The list of 44 hits (representing 41 candidate target genes) is shown in Fig. 1A. Microarray results are available from the Gene Expression Omnibus (Accession Number GSE12857).
Downregulated genes include several known Spt and/or Ntl targets, such as protocadherin 8[a spttarget (Yamamoto et al., 1998)], no tail dependent gene 5[a ntltarget (Goering et al., 2003)], mesogenin1[a target of both sptand ntl(Goering et al., 2003)], and tbx6[which is down-regulated in spt–embryos and not expressed in spt–;ntl– embryos (Griffin et al., 1998)] (Fig. 1A). Some
D
E
V
E
LO
P
M
E
N
downregulated genes have known mutant phenotypes: for example, cdx4 mutants have severe posterior mesoderm truncations (Davidson et al., 2003); mesogenin 1 (Msgn1) mutant mice fail to properly specify trunk and tail mesoderm (Yoon and Wold, 2000); dld, her1 and her7 mutants have mesodermal segmentation defects (Holley et al., 2000; Henry et al., 2002); and knypekmutants have convergence and extension defects (Topczewski et al., 2001). These phenotypes are reminiscent of sptand ntlmutant phenotypes, and thus consistent with the genes being targets of T-box factors.
Of the >16,000 genes on the microarray: 14 are downregulated in the absence of spt, but not ntl, activity; nine are downregulated in the absence of ntl, but notspt, activity; 19 are downregulated when both factors are absent; and two are downregulated when either gene product is absent. The distinctions among categories are somewhat arbitrary because in some cases gene expression is reduced, but not below the level of our cut-off. For example, tbx6 expression decreases 5-fold in spt-deficient embryos, 1.7-fold in ntl-deficient embryos, and 25-fold in spt;ntl-deficient embryos; it is labeled a spt target by our criteria, even though ntl also contributes to its activation.
sptand ntl target genes are spatially and temporally co-expressed with spt and ntl
We presumed that direct sptand ntl target genes would be expressed in spatial and temporal patterns overlapping with those of sptand ntl.To examine temporal overlap, we used an existing microarray dataset (Mathavan et al., 2005) that reports gene expression levels for >16,000 genes at 12 early developmental time points (0-48 hpf) using the same Compugen probe set as our experiments. We visualized the normalized expression profiles of spt/ntltarget genes from our microarray, as well as the profiles for sptand ntl, using the program MapleTree (Fig. 1B). Although the target genes have a variety of expression profiles, they are generally expressed at similar times as sptand ntl. The spatial expression patterns of many target genes listed in Fig. 1A have been previously determined and, for most of them, expression partially overlaps with sptand/or ntl (Thisse et al., 2001) (see Fig. S2 in the supplementary material). Most are expressed in the non-axial gastrula margin and later in the tail bud, whereas surprisingly few are expressed in the axial midline. Typical target gene expression patterns, including those for the genes whose regulation we characterized further, are shown in Fig. 1C. The apparent lack of more targets (such as ntd5) expressed in the axial midline may be due to the function of a second ntl-like gene, brachyury, which can functionally substitute for ntlin anterior mesoderm (Martin and Kimelman, 2008).
Spt and Ntl bind similar sequences in vitro
[image:3.612.52.293.63.622.2]Many regulatory elements have been characterized by identifying large genomic regions that drive appropriate reporter expression, followed by deletion and mutational analyses to determine crucial regulatory sequences. To identify Spt- and Ntl-responsive regulatory elements, we took a more streamlined and targeted Fig. 1. Microarray analysis identifies candidate spt and ntltarget genes.(A) Gene expression levels in MO-injected embryos relative to wild-type embryos at 75% epiboly. Downregulation is shown in shades of yellow (2 to >8-fold) and upregulation (2 to 3-fold) is shown in light purple. Only genes with a two-fold or greater decrease in expression level are shown. (B) spadetail(spt) and no tail (ntl) gene expression profiles between 3 and 48 hpf are shown (top) with the expression profiles of putative targets below. These gene expression profiles were retrieved from another dataset (Mathavan et al., 2005). The expression level for each gene was normalized to its highest expression level over the time course. (C) mRNA expression of spt, ntl and four targets at midgastrula (75% epiboly, 8 hpf) and early segmentation (11-13 hpf). These patterns have been previously reported: ntl(Schulte-Merker et al., 1992), spt (Griffin et al., 1998), tbx6(Hug et al., 1997), dld(Haddon et al., 1998; Hans and Campos-Ortega, 2002), cdx4(Joly et al., 1992) and msgn1(Yoo et al., 2003).
D
E
V
E
LO
P
M
E
N
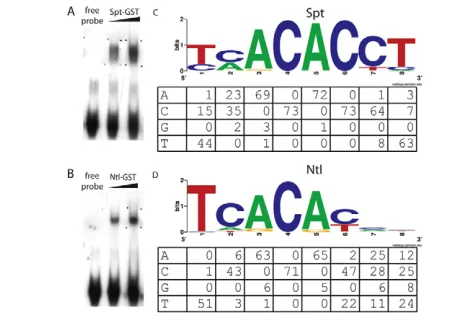
approach by searching for Spt- and Ntl-binding motif enrichment in genomic sequence around target genes. We first generated binding site models using in vitro binding selection assays (SELEX assays) (Fig. 2A,B). We performed gel mobility shift assays with random double-stranded oligonucleotides and GST-tagged Spt and Ntl, and amplified bound DNA using PCR (Gold et al., 1995). The binding selection/amplification cycle was performed four times and bound oligomers from round four were sequenced. Limited sequencing revealed that the Spt-bound oligomer pool from round four consisted almost entirely of near exact matches to previously identified consensus T-box binding sites (Kispert and Herrmann, 1993). As Spt-responsive regulatory elements probably contain both high- and low-affinity sites, we also sequenced oligomers from the third SELEX round and used these to generate binding site models. More than 70 bound oligonucleotides were sequenced for each protein and are represented by WebLogo diagrams (Crooks et al., 2004) (Fig. 2C,D). The Spt model has the consensus sequence TCACACCT and the Ntl model has the consensus sequence TCACACC(C/T), both of which are similar to sequences bound by T-box factors Brachyury, VegT, Eomesodermin and Tbx6 from other species (Kispert and Herrmann, 1993; Conlon et al., 2001; White and Chapman, 2005). This experiment also revealed that Spt, but rarely Ntl, can bind oligomers with a C at position 1; we confirmed this using binding assays with oligomers differing only at the first position (see Fig. S3 in the supplementary material).
Genome searches for spt/ntl-responsive
regulatory elements
To identify putative T-box regulated regulatory elements, we searched genomic sequence within and around 23 putative Spt/Ntl target genes (those that could be assigned to an mRNA in the RefSeq database and aligned to the zebrafish genome) for conserved clusters of Spt- and Ntl-binding sites. We used the program PATSER (Hertz and Stormo, 1999) to construct scoring matrices based upon our SELEX data and background base
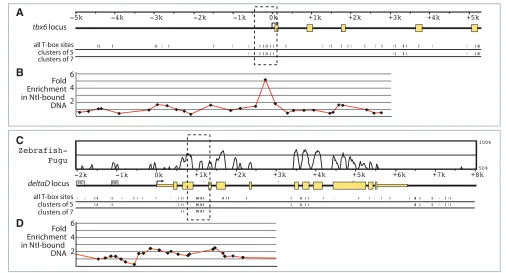
frequencies derived from zebrafish intergenic sequence (36% G-C; 64% A-T). Using a 500 bp sliding window, we searched 5 kb upstream of potential target genes and within intronic sequence for motifs significantly matching the Spt- or Ntl-binding site models (P-value ≤0.001) and ranked each 500 bp region based upon the number of matches. Similar binding site cluster searches have proven effective in identifying Drosophila regulatory elements (Berman et al., 2002; Markstein et al., 2002). The regions with the greatest numbers of Spt and Ntl motifs in our dataset are shown in Table S1 in the supplementary material. In Drosophila, conservation of binding site clusters among species is a good indicator of regulatory activity, even when the primary sequence of the regulatory elements is divergent (Berman et al., 2004). To determine whether T-box site clusters were conserved, and thus more likely to identify Spt/Ntl-responsive regulatory elements, we aligned the genomic loci listed in Table S1 with the orthologous loci from Fugu(Aparicio et al., 2002), Tetraodon (Jaillon et al., 2004), Gasterosteus (Broad Institute, 2007: http://www.broad.mit.edu/models/stickleback/) and Medaka (Kasahara et al., 2007) obtained from the ENSEMBL database (Flicek et al., 2008), and assessed the number of Spt/Ntl motifs in the regions aligning with the 500 bp zebrafish T-box binding site clusters (an example from the dldlocus is shown in Fig. S4 in the supplementary material).
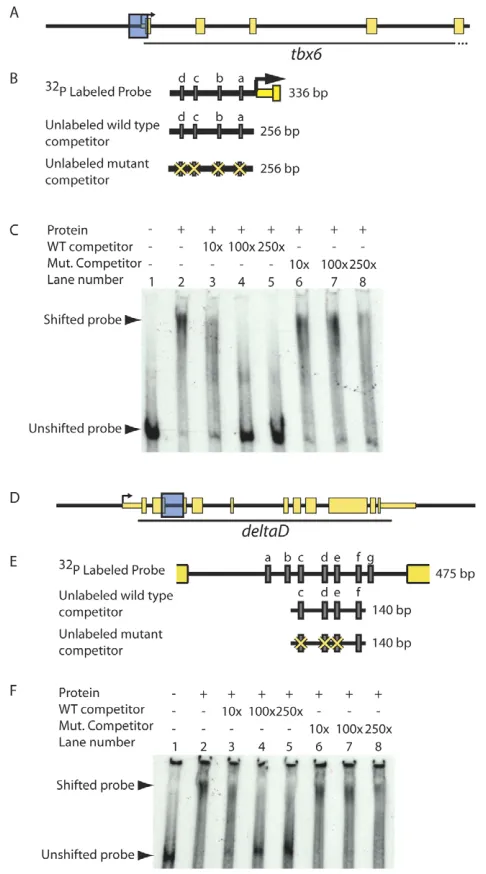
We chose two putative regulatory regions for detailed analysis: the dldsecond intron and the upstream region of tbx6. The dldregion (+911 bp to +1316) shows conservation among all four species for which sequence is available. In addition, previous work showed that a dldregion between +1 and +2800 bp can drive gene expression in the gastrula margin and in the tail bud during segmentation, although regulatory motifs have not been identified (Hans and Campos-Ortega, 2002). Because we recognize that sequences from other fish species will not always be available for approaches such as ours, we also chose to examine a candidate region from the tbx6gene that contains six putative T-box binding sites within 500 bp of the transcription start site for which orthologous sequence was unavailable for comparison (Flicek et al., 2008). Additionally, this tbx6region is known to drive Wnt- and BMP-dependent gene expression in the forming mesoderm (Szeto and Kimelman, 2004). Thus, although several regions identified in our searches are promising candidates for regulation by T-box factors, we selected regions near dldand tbx6for further analysis for the above reasons and because of the predicted high affinity of the T-box binding motifs they contain.
Spt and Ntl bind predicted regulatory elements in vivo and in vitro
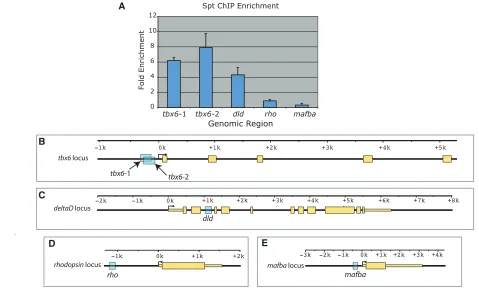
[image:4.612.52.277.61.221.2]To determine whether Spt and Ntl bind tbx6and dldgenomic regions containing conserved binding site clusters in the embryo, we performed chromatin immunoprecipitation (ChIP) at 75-85% epiboly using Spt and Ntl antibodies (Figs 3 and 4). Ntl-bound regions were detected using a promoter microarray containing probes corresponding to sequences up to 9 kb upstream and 3 kb downstream of transcription start sites (Fig. 3) and Spt-bound regions were detected using promoter-specific qPCR (Fig. 4). The conserved T-box binding site cluster upstream of tbx6is enriched 5-fold in the Ntl-bound sample (Fig. 3A,B). Although our promoter microarray does not include probes corresponding to the dldintron 2 T-box site cluster, a probe corresponding to the intron 2-exon 3 junction of dldis 2.3-fold enriched in Ntl-bound DNA (Fig. 3C,D). Using promoter-specific qPCR (Morley et al., 2009), we found that the tbx6upstream region and dldsecond intron T-box clusters are enriched 7.9±1.8 fold and Fig. 2. Spt and Ntl bind similar sites in vitro.(A,B) Representative
gel shifts using recombinant Spt-GST (A) and Ntl-GST (B).
(C,D) WebLogo (Crooks et al., 2004) binding site models based on the sequences of >70 bound oligos from the in vitro selection assays are shown for Spt-GST (C) and Ntl-GST (D) with the count matrices for the sequenced binding sites below. Regions of binding sites contained in the non-random primer region of the oligonucleotide were not counted, therefore some columns have fewer total counts.
D
E
V
E
LO
P
M
E
N
4.3±0.95 fold, respectively, in Spt-bound DNA relative to untreated DNA (Fig. 4A). Additional details for the ChIP experiments can be provided on request. The data indicate that Spt and Ntl bind both candidate regulatory regions in vivo.
To determine whether Spt and Ntl can bind the predicted regulatory regions in vitro, we tested whether a mixture of Spt-GST and Ntl-GST could bind the relevant tbx6(Fig. 5A,B) and dld(Fig. 5D,E) genomic fragments in gel mobility shift assays. A combination of equal volumes of bacterially produced Spt-GST and Ntl-GST bind the regions in vitro (compare lanes 1 and 2 in Fig. 5C,F). Because each radiolabeled genomic fragment contains multiple T-box binding sites, shifted fragments are probably bound by different numbers of transcription factor molecules and thus migrate more diffusely than when bound to a single T-box site (e.g. Fig. 2); however, most of the
probe migrates as a higher mobility complex. To determine whether T-box sites are required for factor binding to the tbx6and dldregions, we performed an in vitro binding competition assay. Probe binding is eliminated with increasing concentrations of unlabeled wild-type competitor DNA (Fig. 5C,F, lanes 3-5). However, a competitor in which positions 4 and 5 in T-box motifs are changed from ‘CA’ to ‘AT’ (merely 8/256 bp changes for tbx6and 6/140 bp for dld) fails to compete efficiently (Fig. 5C,F, lanes 6-8), indicating that intact T-box sites are required for binding. Taken together, our in vivo and in vitro binding assays demonstrate that Spt and Ntl bind regions within the tbx6and dldgenes that contain T-box binding sites and that these binding sites are required for this interaction. It will be interesting in the future to determine the specificity of Spt and Ntl for particular T-box binding motifs within each region.
deltaD locus
all T-box sites clusters of 5 clusters of 7
HI HII
2 4 6 all T-box sites clusters of 5 clusters of 7
4 tbx6 locus
A
Fold Enrichment in Ntl-bound DNA
B
C
D
2 6
[image:5.612.53.559.59.332.2]Fold Enrichment in Ntl-bound DNA
Fig. 3. Ntl binds clusters of T-box sites near tbx6and deltaDin vivo.(A,C) The genomic loci of tbx6(A) and dld (C) are schematized with sequence identity between the orthologous zebrafish and Fugu sequences plotted above the gene schematics using VISTA (Mayor et al., 2000; Frazer et al., 2004) (the Fugu tbx6ortholog has not yet been sequenced). Matches to the Spt and/or Ntl binding site models with a PATSER P-value ≤0.001 are depicted as hatch marks below the gene schematics, with all T-box sites shown first, followed by those that belong to a cluster of 5 and 7 sites within 500 bp of one another. Previously identified dldneural regulatory elements HI and HII (Hans and Campos-Ortega, 2002) are shown in grey in C. (B,D) Chromatin immunoprecipitation was carried out using an antibody against Ntl. Fold enrichment in the Ntl-immunoprecipitated samples is shown. Error bars are not assigned to the Ntl-ChIP data since it represents the median of ratios.
Table 1. Embryo counts for transient transgenesis assays
mCherry expression level (75% epiboly) mCherry expression level (14 somites)
Construct Bright (%) Faint (%) None (%) Number scored (n) Bright (%) Faint (%) None (%) Number scored (n)
tbx6:mCherry 93 5 2 110 96 4 0 110
tbx6:mCherry+spt and ntl MOs 0 6 94 47
tbx6:mCherry mut a 0 87 13 24 89 11 0 38
tbx6:mCherry mut b 22 65 13 60 98 0 2 57
tbx6:mCherry mut c 0 87 13 63 98 0 2 65
tbx6:mCherry mut d 17 40 43 52 85 10 4 50
tbx6:mCherry mut a-d 0 0 100 79 1 15 84 105
–1.2 to +1.3 kb dld:mCherry 98 0 2 88 98 0 2 81
–1.2 to +1.3 kb dld:mCherry mut c-e 21 65 14 109 11 41 48 56
D
E
V
E
LO
P
M
E
N
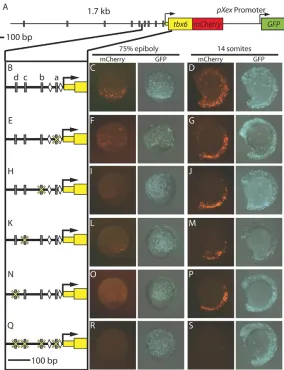
[image:5.612.49.563.627.741.2]T-box binding sites are required for tbx6expression tbx6 contains six Spt/Ntl binding motifs within 500 bp of the transcription start site (Fig. 3A; Fig. 6A), within a region previously shown to drive Wnt- and BMP-dependent gene expression during gastrulation and segmentation stages (Szeto and Kimelman, 2004). Two Tcf/Lef-binding sites were shown to be crucial for the Wnt responsiveness of this regulatory element (Szeto and Kimelman, 2004) and their positions are shown (Fig. 7B). To test the ability of the tbx6upstream region to drive gene expression in vivo, we built a dual fluorescence reporter construct based on one designed by Szeto and Kimelman (Szeto and Kimelman, 2004) that allows one to assess the activity and tissue specificity of a test regulatory region in transient transgenic assays compared with that of a ubiquitously expressed reporter on the same plasmid. The construct contains tbx6upstream sequence (–1.7 kb to the start codon) driving mCherry (Shaner et al., 2004) expression and a ubiquitous pXex promoter driving GFP expression to mark cells that received the plasmid (Fig. 6A). We used I-SceI-mediated transgenesis (Thermes et al., 2002) to introduce the constructs into zebrafish embryos and analyzed GFP and mCherry expression in the injected embryos between mid-gastrulation and early segmentation stages. We observed that mCherry expression was restricted to the blastoderm margin during gastrulation (Fig. 6B; Fig. 7C, compare with Fig. 1C) and later to the tail bud and somites (Fig. 7D), as previously reported (Szeto and Kimelman, 2004). As previously reported (Szeto and Kimelman, 2004), we also observed that the fluorescent reporter was more stable than endogenous tbx6 transcripts (Fig. 1C); thus, fluorescence perdures in presomitic cells as they incorporate into somites and become muscle cells. Reporter
expression is detected in a majority of embryos at shield stage (6 hpf) (see Fig. S5A in the supplementary material), when endogenous tbx6 is initially expressed (Hug et al., 1997), suggesting the regulatory element is involved in initiation of tbx6expression. Double in situ hybridization of reporter construct-injected embryos reveals that mCherry expression overlaps extensively with endogenous tbx6 expression (see Fig. S5B,C in the supplementary material). Similar to the endogenous tbx6gene, mCherry expression is eliminated when spt and ntl MOs are injected with the reporter construct (Fig. 6B-G; see Fig. S5A broken versus unbroken line).
To assess whether T-box binding sites contribute to regulatory element activity, we mutated each of the four most proximal T-box sites independently by changing positions 4 and 5 of the binding site from ‘CA’ to ‘AT’ (Fig. 7E,H,K,N) and tested each modified regulatory element in transient expression assays. Each single T-box mutant construct drove weak mCherry expression at the gastrula margin relative to the wild-type construct (Fig. 7F,I,L,O); however, at segmentation stages, expression was indistinguishable from that driven by the wild-type construct (Fig. 7G,J,M,P). When all four T-box sites were mutated in the context of the full-length regulatory element (Fig. 7Q), reporter expression was completely lost (Fig. 7R,S), demonstrating that 2-4 T-box sites are crucial for tbx6expression in the forming mesoderm and consistent with our in vitro binding data showing that mutation of T-box sites a-d eliminates Spt and Ntl binding (Fig. 5C). Although both Spt and Ntl bind this region in vivo (Fig. 3B; Fig. 4A), Spt appears to play a greater role in activating tbx6than Ntl (Fig. 1A; Fig. 6D-G) (Griffin et al., 1998). Consistent with this, T-box sites a, b and c deltaD locus
tbx6 locus
A
B
tbx6-1 tbx6-2
dld
rhodopsin locus mafba locus
C
D
rho mafba
[image:6.612.51.530.61.351.2]E
Fig. 4. Spt binds clusters of T-box sites near tbx6and deltaDin vivo.We used qPCR to measure the enrichment of the genomic sequences highlighted in blue in B-E in DNA precipitated using a Spt antibody. (A,B) Regions of the T-box motif cluster upstream of tbx6(B) are 7.9±1.8 and 6.2±0.39-fold enriched in Spt-bound DNA (A). A region of the intronic T-box motif cluster in the dldsecond intron (C) is enriched 4.3±0.95 fold in Spt-bound DNA (A). As a negative control, we determined the enrichment level of parts of the rhodopsin(rho) (D) and v-maf musculoaponeurotic fibrossarcoma oncogne protein b(mafba) (E) upstream regions in Spt-bound DNA using qPCR and saw no enrichment in Spt-bound DNA (A).
D
E
V
E
LO
P
M
E
N
have PATSER P-values <0.001 using the Spt matrix, but not the Ntl matrix, suggesting that Spt has a higher affinity for these sites. Site d has a similar predicted affinity for both factors.
The early mesodermal deltaDregulatory element
is directly regulated by T-box factors
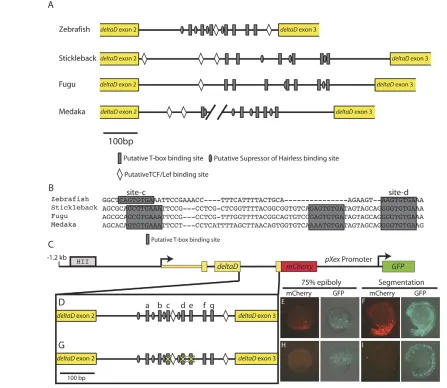
[image:7.612.51.294.60.497.2]We identified seven Spt/Ntl binding site motifs in the 405 bp dld second intron in a region of high sequence identity with Fugu(Fig. 3C). Importantly, other fish species also have multiple T-box sites in this region (Fig. 8A; see Table S1 in the supplementary material). The dldsecond intron from most fish species also contains putative binding sites for other relevant factors, including Tcf/Lef and Suppressor of Hairless (Fig. 8A). Previous dldregulatory analysis identified two upstream regulatory elements (labeled ‘HI’ and ‘HII’ in Fig. 3C) that drive neural expression in zebrafish embryos (Hans and Campos-Ortega, 2002). The same study found that the region between the dld transcription start site and +2.8 kb (including intron 2) contains regulatory information for driving mesodermal expression, but did not further define the sequences required. We tested activity of a dldreporter construct containing the 1.2 kb upstream sequence, the first two exons and introns and partial exon 3 sequence, fused in frame to mCherry (Fig. 8C) in transient transgenic embryos. This region drove mCherry expression in the blastoderm margin during gastrulation and in the tailbud during segmentation (Fig. 8E,F) and reporter expression overlaps well with endogenous dldexpression (see Fig. S5D,E in the supplementary material).
To determine whether T-box sites in the second dldintron are required for activity, we mutated binding motifs in the context of the full-length regulatory element. The dldsecond intron from each fish species contains an assortment of Spt/Ntl binding motifs and two of these (sites c and d) are conserved in orientation and some flanking sequence (Fig. 8B). These two sites are followed closely by a consensus T-box binding site (site e) in zebrafish, so we mutated sites c, d and e. When these sites were mutated (Fig. 8G), mCherry expression substantially decreased (compare Fig. 8H,I with Fig. 8E,F). The remaining regulatory activity could be mediated by any of the four remaining T-box sites or other regulatory sequences contained in the construct.
Fig. 5. T-box proteins bind putative regulatory sequences in vitro in a T-box binding site-dependent manner. (A-F) To test whether Spt and Ntl bind putative regulatory sequences in vitro, we performed gel shifts using equal volumes of recombinant Spt-GST and Ntl-GST, and radiolabeled DNA corresponding to putativetbx6and dldgenomic regulatory sequences (shown as blue boxes in A and D and magnified in B and E to indicate Spt/Ntl binding motifs a-d and a-g, respectively, as grey rectangles). Spt and Ntl bind a 336 bp region containing four T-box sites just upstream of tbx6(C; lane 1 versus lane 2). Addition of 10-250⫻excess unlabeled competitor competes well for binding and virtually eliminates DNA-protein complex formation (C; lanes 3-5); however, excess unlabeled competitor containing mutated T-box sites competes poorly (C; lanes 6-8). Similarly, a mixture of equal volumes of Spt-GST and Ntl-GST binds a 475 bp fragment from the dldsecond intron containing seven putative T-box sites (F, lane 1 versus 2). Unlabeled competitor containing four of the T-box sites competes for binding (F; lanes 3-5), but fails to compete when three of the T-box sites are mutated (F, lanes 6-8).
Fig. 6. The tbx6regulatory element drives mesodermal gene expression and requires Spt and Ntl for activity. The 1.7 kb region upstream of tbx6is shown with gray rectangles representing predicted Spt- and/or Ntl-binding site motifs (A). This region drives reporter expression at the margin at mid-gastrulation (B), but not if embryos are co-injected with sptand ntlMOs (C) (mCherry, red; GFP, green). (D-G) Endogenous tbx6expression is decreased in spt-(F) or ntl-depleted (E) embryos when compared with expression in wild-type embryos (D). tbx6expression is undetectable when both ntland sptare depleted (G).
D
E
V
E
LO
P
M
E
N
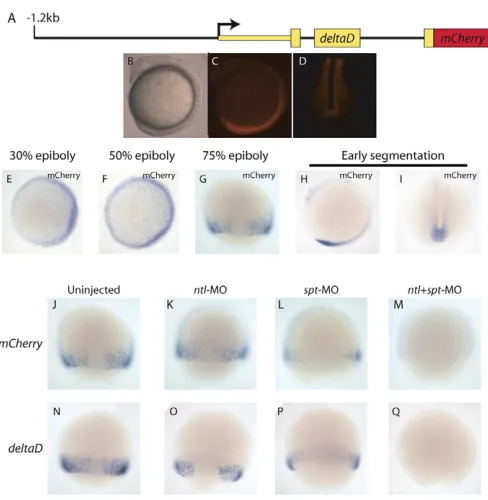
[image:7.612.309.565.64.231.2]To further characterize the expression pattern driven by the full-length dld construct and facilitate functional analyses, we generated stable lines (Fig. 9). In both lines analyzed, we observed mCherry expression in a subset of locations where dld is normally expressed (Fig. 9B-I). Specifically, we observed mCherry transcripts in regions where sptand ntlare strongly co-expressed: at the blastoderm margin (Fig. 9E-G) and later in the posterior tail bud (Fig. 9C,D,H,I). mCherry was also faintly expressed in neural tissue (Fig. 9H), which was expected as the construct contains an regulatory element that drives expression in the hindbrain and other neural tissues (Hans and Campos-Ortega, 2002). The stable lines express mCherry at the margin by 30% epiboly (Fig. 9E), the earliest time at which dldis expressed (Hans and Campos-Ortega, 2002), suggesting the regulatory element initiates expression of dld.
To test whether dldregulatory element activity requires sptand ntl function, we analyzed reporter expression in transgenic embryos injected with sptand ntl MOs. Control and ntl-depleted embryos showed no difference in expression level (Fig. 9J,K). spt-depleted embryos exhibited decreased reporter expression (Fig. 9L) and embryos depleted of both Spt and Ntl fail to express mCherry (Fig. 9M). These results demonstrate that the dld regulatory element requires sptfunction for full activity, but that ntlalso contributes to regulatory element activity. Endogenous dld responds similarly to treatment with these MOs (Fig. 1A; Fig. 9N-Q).
DISCUSSION
The use of T-box site clustering and conservation in regulatory element detection
Here, we show that T-box responsive regulatory elements can be found by searching for conserved clusters of T-box sites near target genes. Because we concentrated our search to introns and 5 kb upstream sequence and because we did not characterize regions with only a few T-box sites, we probably missed a subset of Spt/Ntl-responsive regulatory elements. Even with these possible limitations, we identified two mesodermal regulatory elements using our search criteria and provide evidence that both are directly regulated by T-box factors.
[image:8.612.56.340.59.429.2]The use of comparative genomics to identify zebrafish regulatory sequence has been successfully implemented in the past (Dickmeis et al., 2004; Yang et al., 2007; Allende et al., 2006). One difficulty with this approach is that the positions of regulatory elements and of transcription factor binding sites within them often change over evolution, making them difficult to identify through alignments, particularly across large evolutionary distances (Sanges et al., 2006; Moses et al., 2006). Our method avoids some of these difficulties. First, we compared zebrafish sequence to that of closely related species, increasing the likelihood that the regulatory elements will be conserved. Second, we evaluated the conservation of a sequence based on the presence of transcription factor binding sites, allowing for some flexibility in the positions of the regulatory element regions and the binding sites they contain.
Fig. 7. T-box sites are required for activity of the tbx6 mesodermal regulatory region.(A) The 1.7kb region upstream of tbx6is shown with gray rectangles
representing predicted Spt- and/or Ntl-binding site motifs. (B) A detailed view of 300 bp upstream of the tbx6 transcription start site [gray rectangles indicate putative T-box sites (a-d) and diamonds indicate Tcf/Lef-binding sites important for regulatory element function (Szeto and Kimelman, 2004)]. (C,D) mCherry expression driven by the full-length construct is robust at mid-gastrulation (8 hpf) (C) and mid-segmentation (14 somites) (D). (E-P) During gastrulation, mCherry expression driven by constructs in which one T-box site has been mutated (E,H,K,N) is reduced (F,I,L,O), but is normal during segmentation (G,J,M,P). (Q-S) When all four sites are mutated (Q) expression is abolished at both stages (R,S). The
percentages of embryos with robust, faint or no mCherry expression are given in Table 1.
D
E
V
E
LO
P
M
E
N
Regulatory interactions among T-box factors in mesoderm development
Detailed characterization of spt–, ntl–and spt–;ntl–embryos reveals
that spt and ntlfunction in a partially redundant manner (Amacher et al., 2002). Other experiments suggest spt,ntland tbx6interact in three ways: (1) two factors can activate target genes that neither factor can activate on its own (combinatorial interactions); (2) two factors can contribute to activation additively; and (3) one factor can prevent activation by another factor (competitive antagonism) (Goering et al., 2003). Our microarray-based approach indicates that additive and redundant interactions between Spt and Ntl are the most prevalent as many target genes have moderately decreased expression levels when one of the two T-box genes is depleted, but a greater decrease when both are depleted (Fig. 1A). Our data indicate combinatorial interactions are less common, as
[image:9.612.59.506.62.450.2]shown by the fact that only two targets had a greater than twofold decrease in expression level in both single knockdowns. The distinction between additive and combinatorial interactions is somewhat arbitrary as we define categories based on discrete cutoffs. Two genes were downregulated in ntl-depleted embryos, but upregulated in spt-depleted embryos. These targets may represent examples of competitive antagonism of Ntl function by Spt. One of the two genes, sb:cb259, encodes a transforming acidic coiled-coil-containing protein that is expressed strongly in the axial mesoderm and very weakly in the non-axial margin during gastrulation (Thisse et al., 2001), suggesting that Spt may repress expression in the non-axial margin. The other gene (transgelin3) is not spatially restricted during gastrula stages (Thisse et al., 2001) (see Fig. S2 in the supplementary material). Microarray experiments with other treatments (including tbx6 and Fig. 8. The second intron of deltaDcontains a conserved cluster of T-box sites required for T-box-dependent mesodermal expression. (A) The second intron from fish dld orthologs (there is an unsequenced gap in the Medaka intron). Grey rectangles represent T-box binding motifs, diamonds indicate putative Tcf/Lef sites and grey ovals represent putative Suppressor of Hairless-binding sites. (B) An alignment of the second intron of fish dld orthologs reveals two particularly well-conserved Spt/Ntl-binding motifs (sites c and d). (C-F) A construct containing 1.2 kb upstream and 1.3 kb downstream sequences relative to the dldtranscription start site, including the known neural regulatory element (HII) (Hans and Campos-Ortega, 2002) and the T-box site cluster (C,D) drives robust mCherry expression in the non-axial margin during gastrulation (E) and in the tail bud and somites during segmentation (F). (G-I) When two well-conserved T-box sites (c,d) and a T-box consensus sequence (e) are mutated (G), mCherry expression is greatly reduced (H,I). The percentages of embryos with robust, faint or no mCherry expression is given in Table 1.
D
E
V
E
LO
P
M
E
N
bradepletion, and spt,ntl,braand tbx6overexpression), as well as other functional experiments, will allow the interactions among T-box genes to be more fully characterized.
Interactions between T-box genes and Wnt signaling during posterior mesoderm development
Interference with Wnt signaling in the mesoderm increases the severity of sptand ntlphenotypes, suggesting that spt,ntland Wnt signaling function in concert to generate trunk and tail mesoderm (Lekven et al., 2001). Consistent with this, we find several known Wnt target genes among the T-box targets identified in our microarray screen, including tbx6(Szeto and Kimelman, 2004), cdx4(Shimizu et al., 2005), mesogenin1(Wittler et al., 2007), myf5(Shi et al., 2002) and aldh1a2(Weidinger et al., 2005). During gastrulation, wnt8aand ntlpositively regulate one another (Ueno et al., 2007; Goering et al., 2003; Martin and Kimelman, 2008), which may explain part of the overlap in Wnt/T-box target genes. However, we show that tbx6is directly regulated by T-box factors, which, taken in together with previous results demonstrating its direct regulation by Tcf/Lef factors (Szeto and Kimelman, 2004), indicates that, in some cases, the requirement for Wnt signaling and T-box genes is a result of direct activation by both players. The dld regulatory element we
characterized also contains Tcf/Lef-binding motifs and further analysis will reveal if Wnt signaling contributes to activity. Several recent studies in mouse indicate that T-box and Tcf/Lef transcription factor binding are important for gene activation in the forming mesoderm, including expression of Delta homologs (Dunty et al., 2008; Wittler et al., 2007; Hofmann et al., 2004). This requirement could result from a direct physical interaction between Tcf/Lef and T-box factors, as XenopusVegT (a close Spt homolog) can physically interact with Tcf3 in vitro and because protein domains of VegT and Tcf3 that are crucial for physical interaction include their well-conserved DNA-binding domains (Cao et al., 2007). Two T-box binding sites in the zebrafish tbx6regulatory element are close to Tcf/Lef binding sites (8 bp and 28 bp away), and the mouse Dll1 regulatory element also contains T-box sites within 20 bp of Tcf/Lef binding sites (Hofman et al., 2004). This close clustering of binding sites could result in a physical interaction between the proteins.
Distinct T-box responsive regulatory elements
drive deltaexpression in the tail bud of mouse
and zebrafish
Previous studies have shown that Dll1expression in mouse is driven in the tail bud by a combination of Tbx6 and Tcf/Lef factors acting through an upstream element (Beckers et al., 2000; Hoffman et al., 2004; White and Chapman, 2005). By contrast, dldexpression in the zebrafish tail bud is driven by an element downstream the transcription start site (Figs 8 and 9) (Hans and Campos-Ortega, 2002). We show the zebrafish dldsecond intron contains a tail bud regulatory element that is bound by Spt and Ntl, and requires the proteins for activation (Figs 3, 4, 8 and 9). Thus, Dll1and dldare both directly regulated by T-box factors, but through regulatory elements in different locations. Further experiments will determine whether Wnt signaling activates the dldtail bud regulatory element, as it does the Dll1regulatory element in mouse. It could be that these two elements are controlled by the same set of transcription factors and are functionally very similar, but located in different parts of the gene. This type of regulatory element shuffling may be common in vertebrate evolution (Sanges et al., 2006). Alternatively, it could be that the two regulatory elements are regulated by different sets of factors and the regulatory network has changed over evolution, but the Deltaexpression pattern in the tail bud has remained consistent. dldis a component of the segmentation clock in the posterior tail bud, and has been described as a factor required to ‘prime’ cyclic gene expression in the presomitic mesoderm (Mara et al., 2007). Because T-box factors directly regulate dld expression in this posterior zone, sptand ntlact upstream of the priming process. Several other target genes identified in our microarray study are components of the segmentation clock, including the cyclic genes her1,her7andher15.1(Henry et al., 2002; Gajewski et al., 2003; Oates and Ho, 2002; Shankaran et al., 2007). Consistent with previous studies, recent work has shown that cyclic gene expression starts early in gastrulation (Riedel-Kruse et al., 2007). Our results implicate Spt and Ntl in initiating cyclic gene expression.
[image:10.612.52.296.57.307.2]We thank D. Kimelman, U. Strähle, C. B. Chien, N. Lawson, D. J. Grunwald, J. S. Joly and R. Y. Tsien for plasmids, and S. Schulte-Merker and B. Draper for antibodies. We thank K. Senger, W. Rowell and M. Levine for help with SELEX assays. We thank Emily Janus for technical assistance, Xiao Xu for performing some of the in situ hybridizations in Fig. S1, Jennifer St Hilaire and Kimberly Blum for fish care, and all members of the Amacher laboratory for useful discussion. This work was supported by the March of Dimes Birth Defects Foundation (1-FY05-118) to S.L.A., by the Wellcome Trust Program Grant to J.C.S., and by an MRC Career Development Award and Lister Institute Research Prize to F.C.W. A.T.G. was supported by the U.C. Berkeley Center for Integrative Genomics. Deposited in PMC for release after 6 months. Fig. 9. The mesodermal deltaDregulatory element requires spt
and ntlfunction. (A-I) Stable transgenics carrying the dldreporter construct (A) express mCherry at the blastoderm margin during mid-gastrulation (G), and in the tail bud and hindbrain (C,D,H,I). Transgene expression begins by 30% epiboly (E,F; animal pole views). (J-M) Stable dldtransgenics were injected with MOs targeting ntl, sptor both transcripts, and analyzed by whole-mount in situ hybridization for mCherry. Most uninjected control (J) and Ntl-depleted embryos (K) expressed mCherry [76% (38/50) and 72% (26/36), respectively]. Only 67% (22/33) of Spt-depleted embryos expressed mCherry, and only 9% (3/33) did so at a level comparable with that of uninjected controls (L). No spt+ntlMO-injected embryos (0/54) expressed mCherry (M). (N-Q) In situ hybridization revealed that endogenous dldresponds to Spt and Ntl depletion in a similar manner to the transgene.
D
E
V
E
LO
P
M
E
N
Supplementary material
Supplementary material for this article is available at http://dev.biologists.org/cgi/content/full/136/5/749/DC1
References
Allende, M. L., Manzanares, M., Tena, J. J., Feijóo, C. G. and Gómez-Skarmeta, J. L.(2006). Cracking the genome’s second code: enhancer detection by combined footprinting and transgenic fish and frog embryos. Methods39, 212-219.
Amacher, S. L. and Kimmel, C. B.(1998). Promoting notochord fate and repressing muscle development in zebrafish axial mesoderm. Development125, 1397-1406.
Amacher, S. L., Draper, B. W., Summers, B. R. and Kimmel, C. B.(2002). The zebrafish T-box genes no tailand spadetailare required for development of trunk and tail mesoderm and medial floor plate. Development129, 3311-3323.
Aparicio, S., Chapman, J., Stupka, E., Putnam, N., Chia, J. M., Dehal, P., Christoffels, A., Rash, S., Hoon, S., Smit, A. et al.(2002). Whole-Genome shotgun assembly and analysis of the genome of Fugu rubripes. Science297, 1301-1310.
Beckers, J., Caron, A., de Angelis, M. H., Hans, S., Campos-Ortega, J. A. and Gossler, A.(2000). Distinct regulatory elements direct Delta1expression in the nervous system and paraxial mesoderm of transgenic mice. Mech. Dev. 95, 23-34.
Berman, B. P., Nibu, Y., Pfeiffer, B. D., Tomancak, P., Celniker, S. E., Levine, M., Rubin, G. M. and Eisen, M. B.(2002). Exploiting transcription factor binding site clustering to identify cis-regulatory modules involved in pattern formation in the Drosophila genome. Proc. Natl. Acad. Sci. USA99, 757-762.
Berman, B. P., Pfeiffer, B. D., Laverty, T. R., Salzberg, S. L., Rubin, G. M., Eisen, M. B. and Celniker, S. E.(2004). Computational identification of developmental enhancers: conservation and function of transcription factor binding-site clusters in Drosophila melanogasterand Drosophila pseudoobscura. Genome Biol. 5, R61.
Boyer, L. A., Lee, T. I., Cole, M. F., Johnstone, S. E., Levine, S. S., Zucker, J. P., Guenther, M. G., Kumar, R. M., Murray, H. L., Jenner, R. G. et al. (2005). Core transcriptional regulatory circuitry in human embryonic stem cells. Cell122, 947-956.
Cao, Y., Siegel, D., Donow, C., Knöchel, S., Yuan, L. and Knöchel, W.(2007). POU-V factors antagonize maternal VegT activity and beta-Catenin signaling in Xenopus embryos. EMBO J. 26, 2942-2954.
Chan, R. J., You, M. and Feng, G.-S.(2003). Identification of trans-acting factors by electrophoretic mobility shift assay. In Methods in Molecular Biology(ed. M. De Lay), pp. 7-20. Totowa, NJ: Humana Press.
Chapman, D. L. and Papaioannou, V. E.(1998). Three neural tubes in mouse embryos with mutations in the T-box gene Tbx6. Nature391, 695-697.
Chapman, D. L., Agulnik, I., Hancock, S., Silver, L. M. and Papaioannou, V. E.
(1996). Tbx6, a mouse T-box gene implicated in paraxial mesoderm formation at gastrulation. Dev. Biol. 180, 534-542.
Conlon, F. L., Sedgwick, S. G., Weston, K. M. and Smith, J. C.(1996). Inhibition of Xbratranscription activation causes defects in mesodermal patterning and reveals autoregulation of Xbrain dorsal mesoderm. Development122, 2427-2435.
Conlon, F. L., Fairclough, L., Price, B. M., Casey, E. S. and Smith, J. C.(2001). Determinants of T box protein specificity. Development128, 3749-3758.
Corbo, J. C., Levine, M. and Zeller, R. W.(1997). Characterization of a notochord-specific enhancer from the Brachyurypromoter region of the ascidian Ciona intestinalis. Development124, 589-602.
Crooks, G. E., Hon, G., Chandonia, J. M. and Brenner, S. E.(2004). WebLogo: a sequence logo generator. Genome Res. 14, 1188-1190.
Davidson, A. J., Ernst, P., Wang, Y., Dekens, M. P., Kingsley, P. D., Palis, J., Korsmeyer, S. J., Daley, G. Q. and Zon, L. I.(2003). cdx4mutants fail to specify blood progenitors and can be rescued by multiple hox genes. Nature425, 300-306.
Dickmeis, T., Plessy, C., Rastegar, S., Aanstad, P., Herwig, R., Chalmel, F., Fischer, N. and Strähle, U.(2004). Expression profiling and comparative genomics identify a conserved regulatory region controlling midline expression in the zebrafish embryo. Genome Res. 14, 228-238.
Dobrovolskaïa-Zavadskaïa, N.(1927). Sur la mortification spontanee de la chez la souris nouveau-nee et sur l’existence d’un caractere (facteur) hereditare, non-viable. Crit. Rev. Soc. Biol. 97, 114-116.
Dunty, W. C., Jr, Biris, K. K., Chalamalasetty, R. B., Taketo, M. M., Lewandoski, M. and Yamaguchi, T. P.(2008). Wnt3a/beta-catenin signaling controls posterior body development by coordinating mesoderm formation and segmentation. Development135, 85-94.
Flicek, P., Aken, B. L., Beal, K., Ballester, B., Caccamo, M., Chen, Y., Clarke, L., Coates, G., Cunningham, F., Cutts, T. et al.(2008). Ensembl 2008. Nucleic Acids Res. 36, D707-D714.
Frazer, K. A., Pachter, L., Poliakov, A., Rubin, E. M. and Dubchak, I.(2004). VISTA: computational tools for comparative genomics. Nucleic Acids Res. 32, W273-W279.
Gajewski, M., Sieger, D., Alt, B., Leve, C., Hans, S., Wolff, C., Rohr, K. B. and Tautz, D.(2003). Anterior and posterior waves of cyclic gene expression are
differentially regulated in the presomitic mesoderm of zebrafish. Development 130, 4269-4278.
Ghosh, T. K., Packham, E. A., Bonser, A. J., Robinson, T. E., Cross, S. J. and Brook, J. D.(2001). Characterization of the TBX5 binding site and analysis of mutations that cause Holt-Oram syndrome. Hum. Mol. Genet. 10, 1983-1994.
Goering, L. M., Hshijima, K., Hug, B., Bisgrove, B., Kispert, A. and Grunwald, D. J.(2003). An interacting network of T-box genes directs gene expression and fate in the zebrafish mesoderm. Proc. Natl. Acad. Sci. USA100, 9410-9415.
Gold, L., Polisky, B., Uhlenbeck, O. and Yarus, M.(1995). Diversity of oligonucleotide functions. Annu. Rev. Biochem. 64, 763-797.
Gourronc, F., Ahmad, N., Nedza, N., Eggleston, T. and Rebagliati, M.(2007). Nodal activity around Kupffer’s vesicle depends on the T-box transcription factors notail and spadetail and on notch signaling. Dev. Dyn. 236, 2131-2146.
Griffin, K. J., Amacher, S. L., Kimmel, C. B. and Kimelman, D.(1998). Molecular identification of spadetail: regulation of zebrafish trunk and tail mesoderm formation by T-box genes. Development125, 3379-3388.
Haddon, C., Smithers, L., Schneider-Maunoury, S., Coche, T., Henrique, D. and Lewis, J.(1998). Multiple deltagenes and lateral inhibition in zebrafish primary neurogenesis. Development125, 359-370.
Halpern, M. E., Ho, R. K., Walker, C. and Kimmel, C. B.(1993). Induction of muscle pioneers and floor plate is distinguished by the no tailmutation. Cell75, 99-111.
Hans, S. and Campos-Ortega, J. A.(2002). On the organization of the regulatory region of the zebrafish deltaDgene. Development129, 4773-4784.
Haraguchi, S., Kitajima, S., Takagi, A., Takeda, H., Inoue, T. and Saga, Y.(2001) Transcriptional regulation of Mesp1and Mesp2genes: differential usage of enhancers during development. Mech. Dev.108, 59-69.
Henry, C. A., Urban, M. K., Dill, K. K., Page, M. F., Kimmel, C. B. and Amacher, S. L.(2002). Two linked hairy/Enhancer of split-related zebrafish genes, her1and her7, function together to refine alternating somite boundries. Development129, 3693-3704.
Herrmann, B. G., Labeit, S., Poustka, A., King, T. R. and Lehrach, H.(1990). Cloning of the Tgene required in mesoderm formation in the mouse. Nature343, 617-622.
Hertz, G. Z. and Stormo, G. D.(1999). Identifying DNA and protein patterns with statisically significant alignments of multiple sequences. Bioinformatics15, 563-577.
Ho, R. K. and Kane, D. A.(1990). Cell-autonomous action of zebrafish spt-1 mutation in specific mesodermal precursors. Nature348, 728-730.
Hofmann, M., Schuster-Gossler, K., Watabe-Rudolf, M., Aulehla, A., Herrmann, B. G. and Gossler, A.(2004). WNT signaling, in synergy with T/TBX6, controls Notch signaling by regulating Dll1expression in the presomitic mesoderm of mouse embryos. Genes Dev. 18, 2712-2717.
Holley, S. A., Geisler, R. and Nusslein-Volhard, C.(2000). Control of her1 expression during zebrafish somitogenesis by a Delta-dependent oscillator and an independent wave-front activity. Genes Dev. 14, 1678-1690.
Horb, M. E. and Thomsen, G. H.(1997). A vegetally localized T-box transcription factor in Xenopus eggs specifies mesoderm and endoderm for embryonic mesoderm formation. Development124, 1689-1698.
Hug, B., Walter, V. and Grunwald, D. J.(1997). tbx6, a Brachyury-related gene expressed by ventral mesendodermal precursors in the zebrafish embryo. Dev. Biol. 183, 61-73.
Hughes, T. R., Marton, M. J., Jones, A. R., Roberts, C. J., Stoughton, R., Armour, C. D., Bennett, H. A., Coffey, E., Dai, H., He, Y. D. et al.(2000). Functional discovery via a compendium of expression profiles. Cell102, 109-126.
Jaillon, O., Aury, J. M., Brunet, F., Petit, J. L., Stange-Thomann, N., Mauceli, E., Bouneau, L., Fischer, C., Ozouf-Costaz, C., Bernot, A. et al.(2004). Genome dultication in the teleost fish Tetraodon nigroviridis reveals the early vertebrate proto-karyotype. Nature431, 946-957.
Joly, J. S., Maury, M., Joly, C., Duprey, P., Boulekbache, H. and Condamine, H.
(1992). Expression of a zebrafish caudal homeobox gene correlates with the establishment of posterior cell lineages at gastrulation. Differentiation50, 75-87.
Jurka, J.(2000). Repbase update: a database and an electronic journal of repetitive elements. Trends Genet. 16, 418-420.
Karolchik, D., Kuhn, R. M., Baertsch, R., Barber, G. P., Clawson, H., Diekhans, M., Giardine, B., Harte, R. A., Hinrichs, A. S., Hsu, F. et al.(2008). The UCSC genome browser database: 2008 update. Nucleic Acids Res. 36, D773-D779.
Kasahara, M., Naruse, K., Sasaki, S., Nakatani, Y., Qu, W., Ahsan, B., Yamada, T., Nagayasu, Y., Doi, K., Kasai, Y. et al.(2007). The medaka draft genome and insights into vertebrate genome evolution. Nature447, 714-719.
Kawakami, K.(2004). Transgenesis and gene trap methods in zebrafish by using the Tol2 transposable element. Methods Cell Biol. 77, 201-222.
Kent, W. J., Sugnet, C. W., Furey, T. S., Roskin, K. M., Pringle, T. H., Zahler, A. M. and Haussler, D.(2002). The human genome browser at UCSC. Genome Res. 12, 996-1006.
Kimmel, C. B., Kane, D. A., Walker, C., Warga, R. M. and Rothman, M. B.
(1989). A mutation that changes cell movement and cell fate in the zebrafish
embryo. Nature337, 358-362.