WRL
Research Report 95/8
Eliminating
Receive Livelock
in an
Interrupt-driven Kernel
research relevant to the design and application of high performance scientific computers. We test our ideas by designing, building, and using real systems. The systems we build are research prototypes; they are not intended to become products.
There are two other research laboratories located in Palo Alto, the Network Systems Lab (NSL) and the Systems Research Center (SRC). Another Digital research group is located in Cambridge, Massachusetts (CRL).
Our research is directed towards mainstream high-performance computer systems. Our prototypes are intended to foreshadow the future computing environments used by many Digital customers. The long-term goal of WRL is to aid and accelerate the development of high-performance uni- and multi-processors. The research projects within WRL will address various aspects of high-performance computing.
We believe that significant advances in computer systems do not come from any single technological advance. Technologies, both hardware and software, do not all advance at the same pace. System design is the art of composing systems which use each level of technology in an appropriate balance. A major advance in overall system performance will require reexamination of all aspects of the system.
We do work in the design, fabrication and packaging of hardware; language processing and scaling issues in system software design; and the exploration of new applications areas that are opening up with the advent of higher performance systems. Researchers at WRL cooperate closely and move freely among the various levels of system design. This allows us to explore a wide range of tradeoffs to meet system goals.
We publish the results of our work in a variety of journals, conferences, research reports, and technical notes. This document is a research report. Research reports are normally accounts of completed research and may include material from earlier technical notes. We use technical notes for rapid distribution of technical material; usually this represents research in progress.
Research reports and technical notes may be ordered from us. You may mail your order to:
Technical Report Distribution
DEC Western Research Laboratory, WRL-2 250 University Avenue
Palo Alto, California 94301 USA
Reports and technical notes may also be ordered by electronic mail. Use one of the fol-lowing addresses:
Digital E-net: JOVE::WRL-TECHREPORTS
Internet: [email protected]
UUCP: decpa!wrl-techreports
To obtain more details on ordering by electronic mail, send a message to one of these addresses with the word ‘‘help’’ in the Subject line; you will receive detailed instruc-tions.
Reports and technical notes may also be accessed via the World Wide Web:
in an Interrupt-driven Kernel
Jeffrey C. Mogul
Digital Equipment Corporation Western Research Laboratory
[email protected]
K. K. Ramakrishnan
AT&T Bell Laboratories
600 Mountain Avenue, Murray Hill, New Jersey 07974
[email protected]
(work done while at Digital Equipment Corporation)
December, 1995
Abstract
Most operating systems use interface interrupts to schedule network tasks. Interrupt-driven systems can provide low overhead and good latency at low of-fered load, but degrade significantly at higher arrival rates unless care is taken to prevent several pathologies. These are various forms of receive livelock, in which the system spends all its time processing interrupts, to the exclusion of other necessary tasks. Under extreme conditions, no packets are delivered to the user application or the output of the system.
To avoid livelock and related problems, an operating system must schedule net-work interrupt handling as carefully as it schedules process execution. We modified an interrupt-driven networking implementation to do so; this eliminates receive livelock without degrading other aspects of system performance. We present measurements demonstrating the success of our approach.
This report is an expanded version of a paper in the Proceedings of the 1996 USENIX Technical Conference.
Copyright
1995 Digital Equipment Corporation
2. Motivating applications 2
3. Requirements for scheduling network tasks 2
4. Interrupt-driven scheduling and its consequences 3
4.1. Description of an interrupt-driven system 4
4.2. Receive livelock 5
4.3. Receive latency under overload 5
4.4. Starvation of transmits under overload 7
5. Avoiding livelock through better scheduling 8
5.1. Limiting the interrupt arrival rate 8
5.2. Use of polling 9
5.3. Avoiding preemption 9
5.4. Summary of techniques 10
6. Livelock in BSD-based routers 10
6.1. Measurement methodology 11
6.2. Measurements of an unmodified kernel 11
6.3. Why livelock occurs in the 4.2BSD model 12
6.4. Fixing the livelock problem 12
6.5. Results and analysis 13
6.6. Scheduling heuristics 14
7. Guaranteeing progress for user-level processes 16
7.1. Performance of end-system transport protocols 18
7.2. Measurements using traces of kernel execution 19
7.3. Traces of single-packet activity 19
7.4. Traces of packet bursts 26
7.5. Possible improvements 28
8. Avoiding livelock in a promiscuous network monitor 28
8.1. Initial experiments 28
8.2. Network monitoring with the polling kernel 30
9. Related work 32
9.1. Calaveras: scheduling in an embedded system’s kernel 33
10. Future work 34
10.1. Faster implementations 34
10.2. Extension to multiprocessor kernels 35
10.3. Selective packet dropping 35
10.4. Interactions with application-layer scheduling 36
11. Summary and conclusions 36
Acknowledgements 37
load
Figure 4-2: Receive latency as a function of burst size and packet size 7
Figure 6-1: Forwarding performance of unmodified kernel 11
Figure 6-2: IP forwarding path in 4.2BSD 12
Figure 6-3: Forwarding performance of modified kernel, without using screend 14 Figure 6-4: Forwarding performance of modified kernel, with screend 15 Figure 6-5: Effect of packet-count quota on performance, no screend 16 Figure 6-6: Effect of packet-count quota on performance, with screend 16 Figure 7-1: User-mode CPU time available using cycle-limit mechanism 17 Figure 7-2: ATOM instrumentation code for kernel procedure tracing 20 Figure 7-3: ATOM analysis code for kernel procedure tracing 21 Figure 7-4: Timeline forwarding a single packet, polling disabled 24 Figure 7-5: Timeline forwarding a single packet, polling enabled 25 Figure 7-6: Distribution of latencies from lnintr() to ipinput() 25
Figure 7-7: 3-packet burst latency, polling disabled 26
Figure 7-8: 3-packet burst latency, polling enabled 27
Figure 8-1: Network monitor performance, 80-byte FDDI packets 29 Figure 8-2: Network monitor performance, 272-byte FDDI packets 29
Figure 8-3: tcpdump capture rate, output to /dev/null 31
Figure 8-4: tcpdump capture rate, output to disk file 31
Most operating systems use interrupts to internally schedule the performance of tasks related to I/O events, and particularly the invocation of network protocol software. Interrupts are useful because they allow the CPU to spend most of its time doing useful processing, yet respond quickly to events without constantly having to poll for event arrivals.
Polling is expensive, especially when I/O events are relatively rare, as is the case with disks, which seldom interrupt more than a few hundred times per second. Polling can also increase the latency of response to an event. Modern systems can respond to an interrupt in a few tens of microseconds; to achieve the same latency using polling, the system would have to poll tens of thousands of times per second, which would create excessive overhead. For a general-purpose system, an interrupt-driven design works best.
Most extant operating systems were designed to handle I/O devices that interrupt every few milliseconds. Disks tended to issue events on the order of once per revolution; first-generation LAN environments tend to generate a few hundred packets per second for any single end-system. Although people understood the need to reduce the cost of taking an interrupt, in general this cost was low enough that any normal system would spend only a fraction of its CPU time han-dling interrupts.
The world has changed. Operating systems typically use the same interrupt mechanisms to control both network processing and traditional I/O devices, yet many new applications can generate packets several orders of magnitude more often than a disk can generate seeks. Mul-timedia and other real-time applications will become widespread. Client-server applications, such as NFS, running on fast clients and servers can generate heavy RPC loads. Multicast and broadcast protocols subject innocent-bystander hosts to loads that do not interest them at all. As a result, network implementations must now deal with significantly higher event rates.
Many multi-media and client-server applications share another unpleasant property: unlike traditional network applications (Telnet, FTP, electronic mail), they are not flow-controlled. Some multi-media applications want constant-rate, low-latency service; RPC-based client-server applications often use datagram-style transports, instead of reliable, flow-controlled protocols. Note that whereas I/O devices such as disks generate interrupts only as a result of requests from the operating system, and so are inherently flow-controlled, network interfaces generate un-solicited receive interrupts.
The shift to higher event rates and non-flow-controlled protocols can subject a host to conges-tive collapse: once the event rate saturates the system, without a negaconges-tive feedback loop to con-trol the sources, there is no way to gracefully shed load. If the host runs at full throughput under these conditions, and gives fair service to all sources, this at least preserves the possibility of stability. But if throughput decreases as the offered load increases, the overall system becomes unstable.
Any purely interrupt-driven system using fixed interrupt priorities will suffer from receive livelock under input overload conditions. Once the input rate exceeds the reciprocal of the CPU cost of processing one input event, any task scheduled at a lower priority will not get a chance to run.
Yet we do not want to lightly discard the obvious benefits of an interrupt-driven design. In-stead, we should integrate control of the network interrupt handling sub-system into the operat-ing system’s scheduloperat-ing mechanisms and policies. In this paper, we present a number of simple modifications to the purely interrupt-driven model, and show that they guarantee throughput and improve latency under overload, while preserving the desirable qualities of an interrupt-driven system under light load.
2. Motivating applications
We were led to our investigations by a number of specific applications that can suffer from livelock. Such applications could be built on dedicated single-purpose systems, but are often built using a general-purpose system such as UNIX, and we wanted to find a general solution to the livelock problem. The applications include:
•Host-based routing: Although inter-network routing is traditionally done using special-purpose (usually non-interrupt-driven) router systems, routing is often done using more conventional hosts. Virtually all Internet ‘‘firewall’’ products use UNIX or Windows NT systems for routing [12, 19]. Much experimentation with new routing algorithms is done on UNIX [6], especially for IP multicasting.
•Passive network monitoring: network managers, developers, and researchers com-monly use UNIX systems, with their network interfaces in ‘‘promiscuous mode,’’ to monitor traffic on a LAN for debugging or statistics gathering [13].
•Network file service: servers for protocols such as NFS are commonly built from UNIX systems.
These applications (and others like them, such as Web servers) are all potentially exposed to heavy, non-flow-controlled loads.
We have encountered livelock in all three of these applications, have solved or mitigated the problem, and have shipped the solutions to customers. For example, an early implementation of this work was successfully deployed in the routers used for the NASDAQ financial network.
The rest of this paper concentrates on host-based routing and (to a lesser extent) network monitoring, since this simplifies the context of the problem and allows easy performance measurement.
3. Requirements for scheduling network tasks
When an end-system is involved in processing considerable network traffic, its performance depends critically on how its tasks are scheduled. The mechanisms and policies that schedule packet processing and other tasks should guarantee acceptable system throughput, reasonable latency and jitter (variance in delay), fair allocation of resources, and overall system stability, without imposing excessive overheads, especially when the system is overloaded.
We can define throughput as the rate at which the system delivers packets to their ultimate consumers. A consumer could be an application running on the receiving host, or the host could be acting as a router and forwarding packets to consumers on other hosts. We expect the throughput of a well-designed system to keep up with the offered load up to a point called the Maximum Loss Free Receive Rate (MLFRR), and at higher loads throughput should not drop below this rate.
Of course, useful throughput depends not just on successful reception of packets; the system must also transmit packets. Because packet reception and packet transmission often compete for the same resources, under input overload conditions the scheduling subsystem must ensure that packet transmission continues at an adequate rate.
Many applications, such as distributed systems and interactive multimedia, often depend more on low-latency, low-jitter communications than on high throughput. Even during overload, we want to avoid long queues, which increases latency, and bursty scheduling, which increases jit-ter.
When a host is overloaded with incoming network packets, it must also continue to process other tasks, so as to keep the system responsive to management and control requests, and to allow applications to make use of the arriving packets. The scheduling subsystem must fairly allocate CPU resources among packet reception, packet transmission, protocol processing, other I/O processing, system housekeeping, and application processing.
A host that behaves badly when overloaded can also harm other systems on the network. Livelock in a router, for example, may cause the loss of control messages, or delay their process-ing. This can lead other routers to incorrectly infer link failure, causing incorrect routing infor-mation to propagate over the entire wide-area network. Worse, loss or delay of control messages can lead to network instability, by causing positive feedback in the generation of control traffic [15].
4. Interrupt-driven scheduling and its consequences
Scheduling policies and mechanisms significantly affect the throughput and latency of a sys-tem under overload. In an interrupt-driven operating syssys-tem, the interrupt subsyssys-tem must be viewed as a component of the scheduling system, since it has a major role in determining what code runs when. We have observed that interrupt-driven systems have trouble meeting the re-quirements discussed in section 3.
In this section, we first describe the characteristics of an interrupt-driven system, and then identify three kinds of problems caused by network input overload in interrupt-driven systems:
•Increased latency for packet delivery or forwarding: the system delays the delivery of one packet while it processes the interrupts for subsequent packets, possibly of a burst.
•Starvation of packet transmission: even if the CPU keeps up with the input load, strict priority assignments may prevent it from transmitting any packets.
4.1. Description of an interrupt-driven system
An interrupt-driven system performs badly under network input overload because of the way in which it prioritizes the tasks executed as the result of network input. We begin by describing a typical operating system’s structure for processing and prioritizing network tasks. We use the 4.2BSD [9] model for our example, but we have observed that other operating systems, such as VMS, DOS, and Windows NT, and even several Ethernet chips, have similar characteristics and hence similar problems.
When a packet arrives, the network interface signals this event by interrupting the CPU. Device interrupts normally have a fixed Interrupt Priority Level (IPL), and preempt all tasks running at a lower IPL; interrupts do not preempt tasks running at the same IPL. The interrupt causes entry into the associated network device driver, which does some initial processing of the packet. In 4.2BSD, only buffer management and data-link layer processing happens at ‘‘device IPL.’’ The device driver then places the packet on a queue, and generates a software interrupt to cause further processing of the packet. The software interrupt is taken at a lower IPL, and so this protocol processing can be preempted by subsequent interrupts. (We avoid lengthy periods at high IPL, to reduce latency for handling certain other events.)
The queues between steps executed at different IPLs provide some insulation against packet losses due to transient overloads, but typically they have fixed length limits. When a packet should be queued but the queue is full, the system must drop the packet. The selection of proper queue limits, and thus the allocation of buffering among layers in the system, is critical to good performance, but beyond the scope of this paper.
Note that the operating system’s scheduler does not participate in any of this activity, and in fact is entirely ignorant of it.
As a consequence of this structure, a heavy load of incoming packets could generate a high rate of interrupts at device IPL. Dispatching an interrupt is a costly operation, so to avoid this overhead, the network device driver attempts to batch interrupts. That is, if packets arrive in a burst, the interrupt handler attempts to process as many packets as possible before returning from the interrupt. This amortizes the cost of processing an interrupt over several packets.
Modern network adapters can receive many back-to-back packets without host intervention, either through the use of copious buffering or highly autonomous DMA engines. This insulates the system from the network, and eliminates much of the rationale for giving absolute priority to the first few steps of processing a received packet.
4.2. Receive livelock
In an interrupt-driven system, receiver interrupts take priority over all other activity. If pack-ets arrive too fast, the system will spend all of its time processing receiver interrupts. It will therefore have no resources left to support delivery of the arriving packets to applications (or, in the case of a router, to forwarding and transmitting these packets). The useful throughput of the system will drop to zero.
Following [16], we refer to this condition as receive livelock: a state of the system where no useful progress is being made, because some necessary resource is entirely consumed with processing receiver interrupts. When the input load drops sufficiently, the system leaves this state, and is again able to make forward progress. This is not a deadlock state, from which the system would not recover even when the input rate drops to zero.
A system could behave in one of three ways as the input load increases. In an ideal system, the delivered throughput always matches the offered load. In a realizable system, the delivered throughput keeps up with the offered load up to the Maximum Loss Free Receive Rate (MLFRR), and then is relatively constant after that. At loads above the MLFRR, the system is still making progress, but it is dropping some of the offered input; typically, packets are dropped at a queue between processing steps that occur at different priorities.
In a system prone to receive livelock, however, throughput decreases with increasing offered load, for input rates above the MLFRR. Receive livelock occurs at the point where the through-put falls to zero. A livelocked system wastes all of the effort it through-puts into partially processing received packets, since they are all discarded.
Receiver-interrupt batching complicates the situation slightly. By improving system ef-ficiency under heavy load, batching can increase the MLFRR. Batching can shift the livelock point but cannot, by itself, prevent livelock.
In section 6.2, we present measurements showing how livelock occurs in a practical situation. Additional measurements, and a more detailed discussion of the problem, are given in [16].
4.3. Receive latency under overload
NFS RPC requests, for example, this means that the server’s disk sits idle when it could be doing useful work.
To demonstrate this effect, we performed experiments usingULTRIXVersion 3.0 running on a DECstation 3100 (approximately 11.3 SPECmarks). ULTRIX, derived from 4.2BSD, closely
follows the network design of that system. We used a logic analyzer to measure the time be-tween the generation of an interrupt by the Ethernet device (an AMD 7990 LANCE chip), sig-nalling the complete reception of a packet, and the packet’s delivery to an application. We used the kernel’s implementation of a simple data-link layer protocol, rather than IP/TCP or a similar protocol stack, but the steps performed by the kernel are substantially the same:
•link-level processing at device IPL, which includes copying the packet into kernel buffers
•further processing following a software interrupt, which includes locating the ap-propriate user process, and and queueing the packet for delivery to this process
•finally, awakening the user process, which then (in kernel mode) copies the received packet into its own buffer.
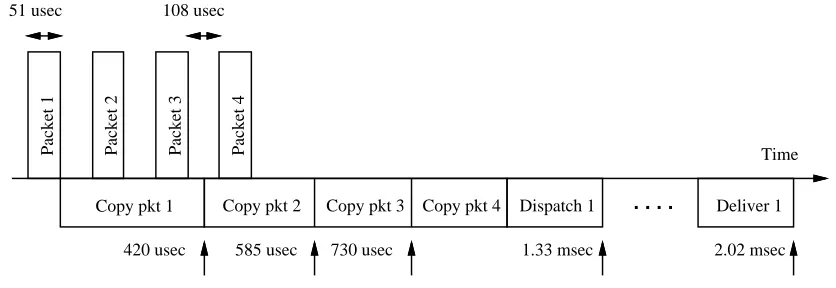
Figure 4-1 shows a time line for the completion of these processing stages, when receiving a burst of four minimum size packets from the Ethernet. The system starts to copy the first packet into a kernel buffer almost immediately after it arrives, but does not finish copying the third packet until about 1.33 msec later. Only after finishing this does it schedule a software interrupt to dispatch the packet to the user process, and all of the packets are dispatched before the user process is awakened. It is the use of preemptive interrupt priorities that prevents completion of processing for the first packet until substantial processing has been done on the entire burst.
Packet 1 Packet 2 Packet 3 Packet 4
51 usec 108 usec
420 usec
Copy pkt 1 Copy pkt 2 Copy pkt 3 Copy pkt 4
585 usec 730 usec 1.33 msec Dispatch 1
Time
. . . . Deliver 1
[image:16.612.80.498.423.567.2]2.02 msec
Figure 4-1: How interrupt-driven scheduling causes excess latency under overload
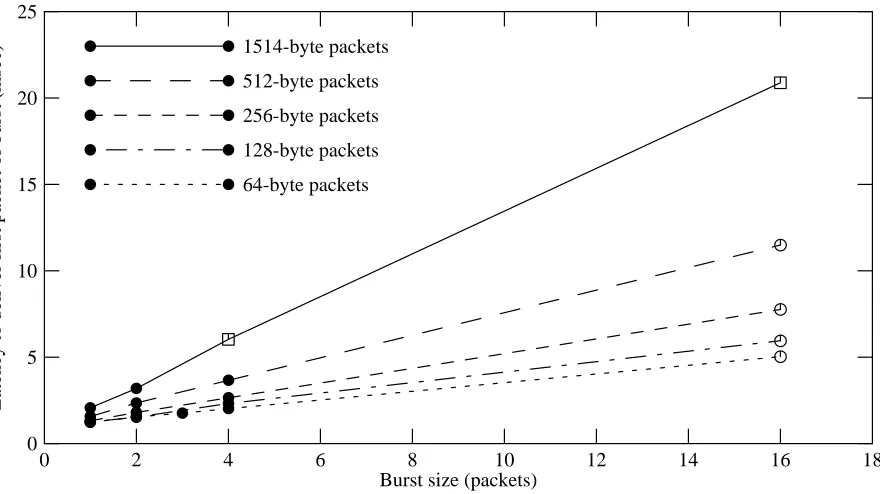
We generated our bursts of Ethernet packets with an inter-packet spacing of 108 usec (this is not the minimum theoretical spacing, but we were limited by the packet generator we used). The latency to deliver the first packet to the user application depended on the size of a burst: 1.23 msec for a single-packet burst, 1.54 msec for a two-packet burst, 2.02 msec for a four-packet burst, and 5.03 msec for a 16-packet burst. Figure 4-2 summarizes this data, showing that the excess delay is nearly linear in the burst size.
for the first packet in a burst. The data-link layer facility used in these trials supports only a limited amount of buffering, so in some trials not all of the packets in a burst were delivered to the application. The delivery queue could only hold 10 packets, so in the 16-packet trials only the first ten packets of a burst were actually received. These trials are indicated by open circles. Also, the queue could hold only 4 Kbytes of total data, so for the two trials using maximum-size packets, the system only delivered two packets from each burst; these trials are indicated by open squares.
0 2 4 6 8 10 12 14 16 18
Burst size (packets) 0
25
5 10 15 20
Latency to deliver first packet of burst (msec)
64-byte packets 128-byte packets 256-byte packets 512-byte packets 1514-byte packets
[image:17.612.103.543.170.417.2]In trials marked with open squares or open circles, the kernel failed to deliver the entire burst to the user application.
Figure 4-2: Receive latency as a function of burst size and packet size
We will present a more detailed analysis of receive latency in section 7.2, in the context of a somewhat different system.
4.4. Starvation of transmits under overload
In most systems, the packet transmission process consists of selecting packets from an output queue, handing them to the interface, waiting until the interface has sent the packet, and then releasing the associated buffer.
Packet transmission is often done at a lower priority than packet reception. This policy is superficially sound, because it minimizes the probability of packet loss when a burst of arriving packets exceeds the available buffer space. Reasonable operation of higher level protocols and applications, however, requires that transmit processing makes sufficient progress.
Transmit starvation may occur if the transmitter interrupts at a lower priority than the receiver; or if they interrupt at the same priority, but the receiver’s events are processed first by the driver; or if transmission completions are detected by polling, and the polling is done at a lower priority than receiver event processing.
This effect has also been described previously [17].
5. Avoiding livelock through better scheduling
In this section, we discuss several techniques to avoid receive livelocks. The techniques we discuss in this section include mechanisms to control the rate of incoming interrupts, polling-based mechanisms to ensure fair allocation of resources, and techniques to avoid unnecessary preemption.
5.1. Limiting the interrupt arrival rate
We can avoid or defer receive livelock by limiting the rate at which interrupts are imposed on the system. The system checks to see if interrupt processing is taking more than its share of resources, and if so, disables interrupts temporarily.
The system may infer impending livelock because it is discarding packets due to queue over-flow, or because high-layer protocol processing or user-mode tasks are making no progress, or by measuring the fraction of CPU cycles used for packet processing. Once the system has in-vested enough work in an incoming packet to the point where it is about to be queued, it makes more sense to process that packet to completion than to drop it and rescue a subsequently-arriving packet from being dropped at the receiving interface, a cycle that could repeat ad infinitum.
When the system is about to drop a received packet because an internal queue is full, this strongly suggests that it should disable input interrupts. The host can then make progress on the packets already queued for higher-level processing, which has the side-effect of freeing buffers to use for subsequent received packets. Meanwhile, if the receiving interface has sufficient buf-fering of its own, additional incoming packets may accumulate there for a while.
We also need a trigger for re-enabling input interrupts, to prevent unnecessary packet loss. Interrupts may be re-enabled when internal buffer space becomes available, or upon expiration of a timer.
On a system without a fine-grained clock, one can crudely simulate this approach by sampling the CPU state on every clock interrupt (clock interrupts typically preempt device interrupt processing). If the system finds itself in the midst of processing interrupts for a series of such samples, it can disable interrupts for a few clock ticks.
5.2. Use of polling
Limiting the interrupt rate prevents system saturation but might not guarantee progress; the system must also fairly allocate packet-handling resources between input and output processing, and between multiple interfaces. We can provide fairness by carefully polling all sources of packet events, using a round-robin schedule.
In a pure polling system, the scheduler would invoke the device driver to ‘‘listen’’ for incom-ing packets and for transmit completion events. This would control the amount of device-level processing, and could also fairly allocate resources among event sources, thus avoiding livelock. Simply polling at fixed intervals, however, adds unacceptable latency to packet reception and transmission.
Polling designs and interrupt-driven designs differ in their placement of policy decisions. When the behavior of tasks cannot be predicted, we rely on the scheduler and the interrupt sys-tem to dynamically allocate CPU resources. When tasks can be expected to behave in a predict-able manner, the tasks themselves are better predict-able to make the scheduling decisions, and polling depends on voluntary cooperation among the tasks.
Since a purely interrupt-driven system leads to livelock, and a purely polling system adds un-necessary latency, we employ a hybrid design, in which the system polls only when triggered by an interrupt, and interrupts happen only while polling is suspended. During low loads, packet arrivals are unpredictable and we use interrupts to avoid latency. During high loads, we know that packets are arriving at or near the system’s saturation rate, so we use polling to ensure progress and fairness, and only re-enable interrupts when no more work is pending.
5.3. Avoiding preemption
As we showed in section 4.2, receive livelock occurs because interrupt processing preempts all other packet processing. We can solve this problem by making higher-level packet processing non-preemptable. We observe that this can be done following one of two general approaches: do (almost) everything at high IPL, or do (almost) nothing at high IPL.
Following the first approach, we can modify the 4.2BSD design (see section 4.1) by eliminat-ing the software interrupt, polleliminat-ing interfaces for events, and processeliminat-ing received packets to completion at device IPL. Because higher-level processing occurs at device IPL, it cannot be preempted by another packet arrival, and so we guarantee that livelock does not occur within the kernel’s protocol stack. We still need to use a rate-control mechanism to ensure progress by user-level applications.
polling thread runs at zero IPL, checking the flags to decide which devices need service. Only when the polling thread is done does it re-enable the device interrupt. The polling thread can be interrupted at most once by each device, and so it progresses at full speed without interference.
Either approach eliminates the need to queue packets between the device driver and the higher-level protocol software, although if the protocol stack must block, the incoming packet must be queued at a later point. (For example, this would happen when the data is ready for delivery to a user process, or when an IP fragment is received and its companion fragments are not yet available.)
5.4. Summary of techniques
In summary, we avoid livelock by:
•Using interrupts only to initiate polling.
•Using round-robin polling to fairly allocate resources among event sources.
•Temporarily disabling input when feedback from a full queue, or a limit on CPU usage, indicates that other important tasks are pending.
•Dropping packets early, rather than late, to avoid wasted work. Once we decide to receive a packet, we try to process it to completion.
We maintain high performance by
•Re-enabling interrupts when no work is pending, to avoid polling overhead and to keep latency low.
•Letting the receiving interface buffer bursts, to avoid dropping packets.
•Eliminating the IP input queue, and associated overhead.
We observe, in passing, that inefficient code tends to exacerbate receive livelock, by lowering the MLFRR of the system and hence increasing the likelihood that livelock will occur. Aggres-sive optimization, ‘‘fast-path’’ designs, and removal of unnecessary steps all help to postpone arrival of livelock.
6. Livelock in BSD-based routers
In this section, we consider the specific example of an IP packet router built using Digital UNIX (formerly DEC OSF/1). We chose this application because routing performance is easily measured. Also, since firewalls typically use UNIX-based routers, they must be livelock-proof in order to prevent denial-of-service attacks.
6.1. Measurement methodology
Our test configuration consisted of a router-under-test connecting two otherwise unloaded Ethernets. A source host generated IP/UDP packets at a variety of rates, and sent them via the router to a destination address. (The destination host did not exist; we fooled the router by in-serting a phantom entry into its ARP table.) We measured router performance by counting the number of packets successfully forwarded in a given period, yielding an average forwarding rate.
The router-under-test was a DECstation 3000/300 Alpha-based system running Digital UNIX V3.2, with a SPECint92 rating of 66.2. We chose the slowest available Alpha host, to make the livelock problem more evident. The source host was a DECstation 3000/400, with a SPECint92 rating of 74.7. We slightly modified its kernel to allow more efficient generation of output packets, so that we could stress the router-under-test as much as possible.
In all the trials reported on here, the packet generator sent 10000 UDP packets carrying 4 bytes of data. This system does not generate a precisely paced stream of packets; the packet rates reported are averaged over several seconds, and the short-term rates varied somewhat from the mean. We calculated the delivered packet rate by using the ‘‘netstat’’ program (on the router machine) to sample the output interface count (‘‘Opkts’’) before and after each trial. We checked, using a network analyzer on the stub Ethernet, that this count exactly reports the num-ber of packets transmitted on the output interface.
6.2. Measurements of an unmodified kernel
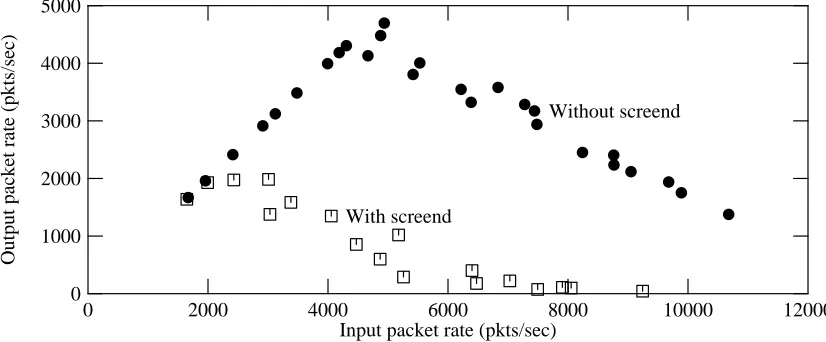
[image:21.612.100.513.485.656.2]We started by measuring the performance of the unmodified operating system, as shown in figure 6-1. Each mark represents one trial. The filled circles show kernel-based forwarding performance, and the open squares show performance using the screend program [12], used in some firewalls to screen out unwanted packets. This user-mode program does one system call per packet; the packet-forwarding path includes both kernel and user-mode code. In this case, screend was configured to accept all packets.
0 2000 4000 6000 8000 10000 12000
Input packet rate (pkts/sec) 0
5000
1000 2000 3000 4000
Output packet rate (pkts/sec)
Without screend
With screend
Figure 6-1: Forwarding performance of unmodified kernel
packets/sec. Even without screend, the router peaked at 4700 packets/sec., and would probably livelock somewhat below the maximum Ethernet packet rate of about 14,880 packets/second.
6.3. Why livelock occurs in the 4.2BSD model
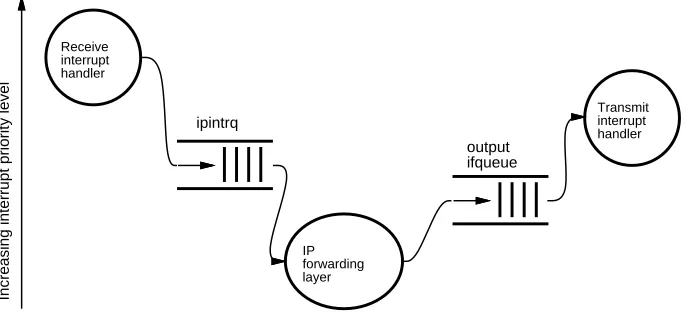
4.2BSD follows the model described in section 4.1, and depicted in figure 6-2. The device driver runs at interrupt priority level (IPL) = SPLIMP, and the IP layer runs via a software inter-rupt at IPL = SPLNET, which is lower than SPLIMP. The queue between the driver and the IP code is named ‘‘ipintrq,’’ and each output interface is buffered by a queue of its own. All queues have length limits; excess packets are dropped. Device drivers in this system implement interrupt batching, so at high input rates very few interrupts are actually taken.
Digital UNIX follows a similar model, with the IP layer running as a separately scheduled thread at IPL = 0, instead of as a software interrupt handler.
Receive interrupt handler
Transmit interrupt handler
IP forwarding layer
ipintrq
output ifqueue
[image:22.612.121.469.278.436.2]Increasing interrupt priority level
Figure 6-2: IP forwarding path in 4.2BSD
It is now quite obvious why the system suffers from receive livelock. Once the input rate exceeds the rate at which the device driver can pull new packets out of the interface and add them to the IP input queue, the IP code never runs. Thus, it never removes packets from its queue (ipintrq), which fills up, and all subsequent received packets are dropped.
The system’s CPU resources are saturated because it discards each packet after a lot of CPU time has been invested in it at elevated IPL. This is foolish; once a packet has made its way through the device driver, it represents an investment and should be processed to completion if at all possible. In a router, this means that the packet should be transmitted on the output interface. When the system is overloaded, it should discard packets as early as possible (i.e., in the receiv-ing interface), so that discarded packets do not waste any resources.
6.4. Fixing the livelock problem
1
manipulations and software interrupt (or thread dispatch) . Once we decide to take a packet from the receiving interface, we try not to discard it later on, since this would represent wasted effort.
We also try to carefully ‘‘schedule’’ the work done in this thread. It is probably not possible to use the system’s real scheduler to control the handling of each packet, so we instead had this thread use a polling technique to efficiently simulate round-robin scheduling of packet process-ing. The polling thread uses additional heuristics to help meet our performance goals.
In the new system, the interrupt handler for an interface driver does almost no work at all. Instead, it simple schedules the polling thread (if it has not already been scheduled), recording its need for packet processing, and then returns from the interrupt. It does not set the device’s interrupt-enable flag, so the system will not be distracted with additional interrupts until the poll-ing thread has processed all of the pendpoll-ing packets.
At boot time, the modified interface drivers register themselves with the polling system, providing callback procedures for handling received and transmitted packets, and for enabling interrupts. When the polling thread is scheduled, it checks all of the registered devices to see if they have requested processing, and invokes the appropriate callback procedures to do what the interrupt handler would have done in the unmodified kernel.
The received-packet callback procedures call the IP input processing routine directly, rather than placing received packets on a queue for later processing; this means that any packet ac-cepted from the interface is processed as far as possible (e.g., to the output interface queue for forwarding, or to a queue for delivery to a process). If the system falls behind, the interface’s input buffer will soak up packets for a while, and any excess packets will be dropped by the interface before the system has wasted any resources on it.
The polling thread passes the callback procedures a quota on the number of packets they are allowed to handle. Once a callback has used up its quota, it must return to the polling thread. This allows the thread to round-robin between multiple interfaces, and between input and output handling on any given interface, to prevent a single input stream from monopolizing the CPU.
Once all the packets pending at an interface have been handled, the polling thread also invokes the driver’s interrupt-enable callback so that a subsequent packet event will cause an interrupt.
6.5. Results and analysis
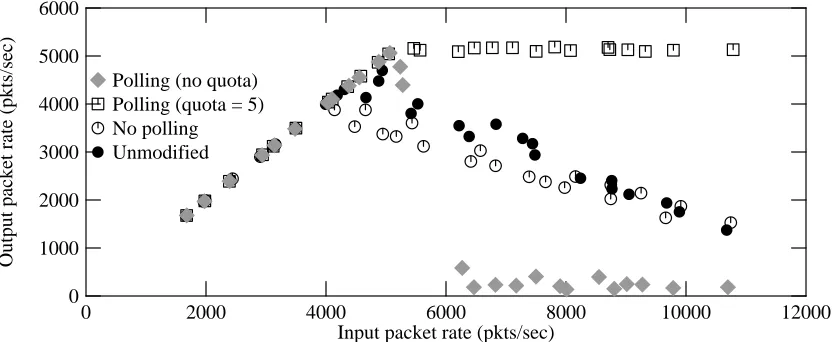
Figures 6-3 summarizes the results of our changes, when screend is not used. Several dif-ferent kernel configurations are shown, using difdif-ferent mark symbols on the graph. The modified kernel (shown with square marks) slightly improves the MLFRR, and avoids livelock at higher input rates.
0 2000 4000 6000 8000 10000 12000 Input packet rate (pkts/sec)
0 6000
1000 2000 3000 4000 5000
Output packet rate (pkts/sec)
[image:24.612.65.481.67.238.2]Unmodified No polling Polling (quota = 5) Polling (no quota)
Figure 6-3: Forwarding performance of modified kernel, without using screend
The modified kernel can be configured to act as if it were an unmodified system (shown with open circles), although this seems to perform slightly worse than an actual unmodified system (filled circles). The reasons are not clear, but may involve slightly longer code paths, different compilers, or unfortunate changes in instruction cache conflicts.
6.6. Scheduling heuristics
Figure 6-3 shows that if the polling thread places no quota on the number of packets that a callback procedure can handle, when the input rate exceeds the MLFRR the total throughput drops almost to zero (shown with diamonds in the figure). This livelock occurs because al-though the packets are no longer discarded at the IP input queue, they are still piling up (and being discarded) at the queue for the output interface. This queue is unavoidable, since there is no guarantee that the output interface runs as fast as the input interface.
Why does the system fail to drain the output queue? If packets arrive too fast, the input-handling callback never finishes its job. This means that the polling thread never gets to call the output-handling callback for the transmitting interface, which prevents the release of transmitter buffer descriptors for use in further packet transmissions. This is similar to the transmit star-vation condition identified in section 4.4.
The result is actually worse in the no-quota modified kernel, because in that system, packets are discarded for lack of space on the output queue, rather than on the IP input queue. The unmodified kernel does less work per discarded packet, and therefore occasionally discards them fast enough to catch up with a burst of input packets.
6.6.1. Feedback from full queues
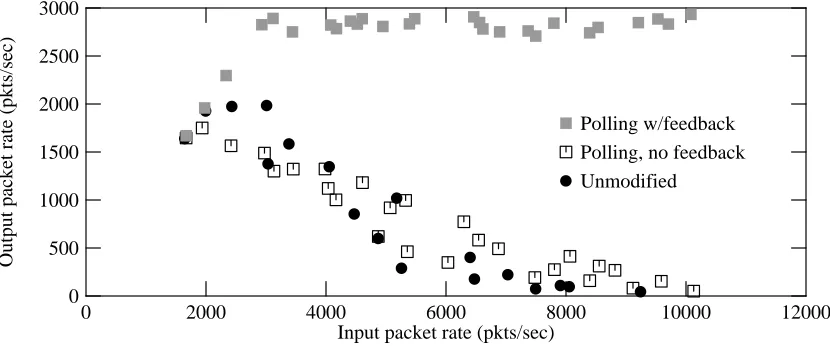
How does the modified system perform when the screend program is used? Figure 6-4 com-pares the performance of the unmodified kernel (filled circles) and several modified kernels.
0 2000 4000 6000 8000 10000 12000 Input packet rate (pkts/sec)
0 3000
500 1000 1500 2000 2500
Output packet rate (pkts/sec)
Unmodified
[image:25.612.101.516.67.240.2]Polling, no feedback Polling w/feedback
Figure 6-4: Forwarding performance of modified kernel, with screend
packets are dropped. screend never gets a chance to run to drain this queue, because the system devotes its cycles to handling input packets.
To resolve this problem, we detect when the screening queue becomes full and inhibit further input processing (and input interrupts) until more queue space is available. The result is shown with the gray square marks in figure 6-4: no livelock, and much improved peak throughput. Feedback from the queue state means that the system properly allocates CPU resources to move packets all the way through the system, instead of dropping them at an intermediate point.
In these experiments, the polling quota was 10 packets, the screening queue was limited to 32 packets, and we inhibited input processing when the queue was 75% full. Input processing is re-enabled when the screening queue becomes 25% full. We chose these high and low water marks arbitrarily, and some tuning might help. We also set a timeout (arbitrarily chosen as one clock tick, or about 1 msec) after which input is re-enabled, in case the screend program is hung, so that packets for other consumers are not dropped indefinitely.
The same queue-state feedback technique could be applied to other queues in the system, such as interface output queues, packet filter queues (for use in network monitoring) [14, 13], etc. The feedback policies for these queues would be more complex, since it might be difficult to determine if input processing load was actually preventing progress at these queues. Because the screend program is typically run as the only application on a system, however, a full screening queue is an unequivocal signal that too many packets are arriving.
6.6.2. Choice of packet-count quota
To avoid livelock in the non-screend configuration, we had to set a quota on the number of packets processed per callback, so we investigated how system throughput changes as the quota is varied. Figure 6-5 shows the results; smaller quotas work better. As the quota increases, livelock becomes more of a problem.
0 2000 4000 6000 8000 10000 12000 Input packet rate (pkts/sec)
0 6000
1000 2000 3000 4000 5000
Output packet rate (pkts/sec)
[image:26.612.64.482.67.240.2]quota = 5 packets quota = 10 packets quota = 20 packets quota = 100 packets quota = infinity
Figure 6-5: Effect of packet-count quota on performance, no screend
[image:26.612.64.482.312.492.2]to fill the screening queue with a burst of packets, the feedback mechanism probably hides any potential for improvement.
Figure 6-6 shows the results when the screend process is in use.
0 2000 4000 6000 8000 10000 12000
Input packet rate (pkts/sec) 0
3000
500 1000 1500 2000 2500
Output packet rate (pkts/sec)
quota = 5 packets quota = 10 packets quota = 20 packets quota = 100 packets quota = infinity
Figure 6-6: Effect of packet-count quota on performance, with screend
In summary, tests both with and without screend suggest that a quota of between 5 and 10 packets yields stable and near-optimum behavior, for the hardware configuration tested. For other CPUs and network interfaces, the proper value may differ, so this parameter should be tunable.
7. Guaranteeing progress for user-level processes
We verified this effect by running a compute-bound process on our modified router, and then flooding the router with minimum-sized packets to be forwarded. The router forwarded the packets at the full rate (i.e., as if no user-mode process were consuming resources), but the user process made no measurable progress.
Since the root problem is that the packet-input handling subsystem takes too much of the CPU, we should be able to ameliorate that by simply measuring the amount of CPU time spent handling received packets, and disabling input handling if this exceeds a threshold.
The Alpha architecture, on which we did these experiments, includes a high-resolution low-overhead counter register. This register counts every instruction cycle (in current implemen-tations) and can be read in one instruction, without any data cache misses. Other modern RISC architectures support similar counters; Intel’s Pentium is known to have one as an unsupported feature.
We measure the CPU usage over a period defined as several clock ticks (10 msec, in our current implementation, chosen arbitrarily to match the scheduler’s quantum). Once each period, a timer function clears a running total of CPU cycles used in the packet-processing code.
Each time our modified kernel begins its polling loop, it reads the cycle counter, and reads it again at the end of the loop, to measure the number of cycles spent handling input and output packets during the loop. (The quota mechanism ensures that this interval is relatively short.) This number is then added to the running total, and if this total is above a threshold, input dling is immediately inhibited. At the end of the current period, a timer re-enables input han-dling. Execution of the system’s idle thread also re-enables input interrupts and clears the run-ning total.
By adjusting the threshold to be a fraction of the total number of cycles in a period, one can control fairly precisely the amount of CPU time spent processing packets. We have not yet implemented a programming interface for this control; for our tests, we simply patched a kernel global variable representing the percentage allocated to network processing, and the kernel automatically translates this to a number of cycles.
0 2000 4000 6000 8000 10000
Input packet rate (pkts/sec) 0
80
10 20 30 40 50 60 70
Available CPU time (per cent)
threshold 25 %
threshold 50 %
[image:27.612.115.517.502.669.2]threshold 75 % threshold 100 %
Figure 7-1 shows how much CPU time is available to a compute-bound user process, for several settings of the cycle threshold and various input rates. The curves show fairly stable behavior as the input rate increases, but the user process does not get as much CPU time as the threshold setting would imply.
Part of the discrepancy comes from system overhead; even with no input load, the user process gets about 94% of the CPU cycles. Also, the cycle-limit mechanism inhibits packet input processing but not output processing. At higher input rates, before input is inhibited, the output queue fills enough to soak up additional CPU cycles.
Measurement error could cause some additional discrepancy. The cycle threshold is checked only after handling a burst of input packets (for these experiments, the callback quota was 5 packets). With the system forwarding about 5000 packets/second, handling such a burst takes about 1 msec, or about 10% of the threshold-checking period.
The initial dips in the curves for the 50% and 75% thresholds probably reflect the cost of handling the actual interrupts; these cycles are not counted against the threshold, and at input rates below saturation, each incoming packet may be handled fast enough that no interrupt batch-ing occurs.
With a cycle-limit imposed on packet processing, the system is subjectively far more respon-sive, even during heavy input overload. This improvement, however, is mostly apparent for local users; any network-based interaction, such as Telnet, still suffers because many packets are being dropped.
7.1. Performance of end-system transport protocols
The changes we made to the kernel potentially affect the performance of end-system transport protocols, such as TCP and the UDP/RPC/XDR/NFS stack. Since we have not yet applied our modifications to a high-speed network interface driver, such as one for FDDI, we cannot yet measure this effect. (The test system can easily saturate an Ethernet, so measuring TCP through-put over Ethernet shows no effect.)
The technique of processing a received packet directly from the device driver to the TCP layer, without placing the packet on an IP-level queue, was used by Van Jacobson specifically to improve TCP performance [8]. It should reduce the cost of receiving a packet, by avoiding the queue operations and any associated locking; it also should improve the latency of kernel-to-kernel interactions (such as TCP acknowledgements and NFS RPCs).
The technique of polling the interfaces should not reduce end-system performance, because it is done primarily during input overload. (Some implementations use polling to avoid transmit interrupts altogether [10].) During overload, the unmodified system would not make any progress on applications or transport protocols; the use of polling, queue-state feedback, and CPU cycle limits should give the modified system a chance to make at least some progress.
livelock because during overload the NFS threads may never get a chance to run. With queue-state feedback from the NFS server’s input queue, however, we should be able to avoid much of this problem. One could also use the CPU cycle-limit mechanism to reserve some resources for the NFS threads, although it might be difficult to find the ideal allocation.
NFS has typically used large UDP datagrams, and so causes frequent fragmentation of IP packets. Our kernel changes might reduce the tendency of the fragmentation reassembly mechanism to starve under transient overload conditions.
7.2. Measurements using traces of kernel execution
Although statistics showing the performance of a system under various loads enable one to compare the ultimate benefits of several approaches, these numbers do not provide a deep under-standing of the internal behavior of an operating system. We obtained traces of kernel execution to discover how the kernel is spending its time, and to measure the latency for several paths.
To obtain these traces, we used ATOM, an extremely flexible mechanism for instrumenting software [2, 3, 23]. ATOM takes a fully-linked binary program (even a Digital UNIX kernel) as input, and produces an instrumented binary as output. One also supplies to ATOM a module describing which points in the code to instrument, and a module containing analysis routines to execute at run-time.
Because ATOM allows the insertion of instrumentation at carefully chosen points in the ker-nel, it is possible to trace kernel paths without adding much overhead at all. On the DECstation 3000/300, a relatively slow Alpha system, tracing appeared to add about 1.5 usec per call or return. We did some trials in which almost all kernel procedures were traced, and others in which only a few were traced. The former trials provided insight into the precise code paths involved; the latter trials allowed us to obtain relatively accurate timing information.
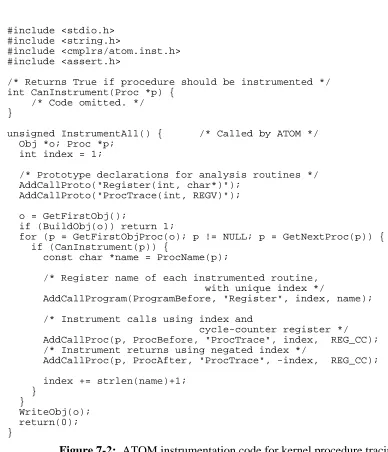
Figure 7-2 shows most of the instrumentation code, except for some routines for determining which functions to instrument, and figure 7-3 shows all of the analysis code. The instrumen-tation module instructs ATOM to instrument calls to and returns from a selected set of procedures. The ProcTrace() function in the analysis module is then called at run-time, for each instrumented call or return, to record the current value of the cycle counter and a compact iden-tifier for the procedure involved.
An additional user-mode program (not shown) is used to extract the trace buffer from the kernel’s memory, and to format it for later processing. This program is also used to reset the trace buffer at the beginning of a trial.
7.3. Traces of single-packet activity
We started by instrumenting almost all kernel procedures, except for a few low-level proce-dure that ATOM cannot currently trace and a small set of short but frequently invoked auxiliary procedures. Tables 7-1 and 7-2 briefly describe the procedures that appear in these traces.
#include <stdio.h> #include <string.h>
#include <cmplrs/atom.inst.h> #include <assert.h>
/* Returns True if procedure should be instrumented */ int CanInstrument(Proc *p) {
/* Code omitted. */ }
unsigned InstrumentAll() { /* Called by ATOM */ Obj *o; Proc *p;
int index = 1;
/* Prototype declarations for analysis routines */ AddCallProto("Register(int, char*)");
AddCallProto("ProcTrace(int, REGV)"); o = GetFirstObj();
if (BuildObj(o)) return 1;
for (p = GetFirstObjProc(o); p != NULL; p = GetNextProc(p)) { if (CanInstrument(p)) {
const char *name = ProcName(p);
/* Register name of each instrumented routine, with unique index */
AddCallProgram(ProgramBefore, "Register", index, name); /* Instrument calls using index and
cycle-counter register */ AddCallProc(p, ProcBefore, "ProcTrace", index, REG_CC); /* Instrument returns using negated index */
AddCallProc(p, ProcAfter, "ProcTrace", -index, REG_CC); index += strlen(name)+1;
} }
[image:30.612.59.447.45.497.2]WriteObj(o); return(0); }
Figure 7-2: ATOM instrumentation code for kernel procedure tracing
procedure calls and returns nest, using the relative ‘‘stack level’’ to display the nesting. (Where the actual call stack includes uninstrumented procedures, the plotted stack level does not include calls through these procedures.)
Figure 7-4 shows a timeline for the modified kernel with polling disabled, which should ap-proximate the behavior of an unmodified kernel. Figure 7-5 shows a timeline for the kernel with polling enabled. Each call is marked with the name of the procedure and the time at which the call was made, in microseconds since the start of the timeline. Returns are not individually marked, but one may deduce them from the decreases in stack level. Interrupts appear as if they were normal procedure calls.
#include "kptracets.h" /* Defines SharedAtomData type */ SharedAtomData satom;
/*
* Stores procedure name in buffer; caller uses buffer * offset as unique index value.
*/
void Register(int index, char *name) { char *pc = &satom.buffer[index]; while(*pc++ = *name++)
; } /*
* Called for each traced event. Stores procedure index * and current cycle counter in parallel arrays.
*/
void ProcTrace(int index, int cycles) { if (satom.nextTrace < TRACE_SIZE) {
satom.Procindex[satom.nextTrace] = index; satom.cycles[satom.nextTrace++] = cycles; }
[image:31.612.99.446.94.309.2]}
Figure 7-3: ATOM analysis code for kernel procedure tracing
In figure 7-4, with polling disabled, we see the following interesting events (marked with dots on the timelines):
0 usec. A packet has arrived, and lnintr() is called to begin handling the interrupt from the receiving LANCE Ethernet chip. (Several microseconds have passed between in-terrupt assertion and the invocation of lnintr().)
19 usec. lnrint() is called to handle a received-packet interrupt.
29 usec. lnrint() calls lnread() to begin packet processing, which includes copying the packet to an mbuf structure.
77 usec. lnread() calls ether_input() to queue the received packet on the ipintr queue; ether_input() then calls netisr_input() to schedule a software interrupt.
142 usec. lnintr() finishes its execution at device IPL.
191 usec. After some thread-switching, ipinput() is invoked as a software interrupt.
264 usec. The IP-layer processing has determined that this packet should be forwarded, has chosen a next-hop destination, and now calls ip_output() to send the packet along.
327 usec. The LANCE driver has decided to send the packet, and calls lnput() to hand the buffer chain to the device.
444 usec. IP-layer processing is complete, and the software interrupt handler exits.
522 usec. The packet has been transmitted and the output interface has interrupted, causing a call to lnintr().
544 usec. lntint() is called to handle the transmit interrupt.
633 usec. lntint() exits, completing all activity related to this packet.
Procedure Description
Thread scheduling
thread_wakeup_prim Used by thread scheduler to unblock a waiting thread. thread_run Switches between running threads.
assert_wait_mesg_head Used by a thread to block on an event.
netisr_input Notifies scheduler that the network software interrupt service routine should be running.
Polling facility
lanpoll_isr* Handler for software interrupt; polls devices with service requirements. lanpoll_intsched* Informs polling facility that an interrupt requires service.
LANCE (Ethernet) driver
lnintr Interrupt entry point for LANCE driver.
lnrint, Original (non-polling) receiver and transmitter interrupt service functions. lntint
lnrintpoll*, New (for polling) receiver and transmitter interrupt service functions. lntintpoll*
lnintena* Called to re-enable LANCE interrupts. lnread Converts received packet buffer to mbuf chain. lnoutput, Initiates packet transmission.
lnstart
lnput Converts outgoing mbuf chain to packet buffer.
Ethernet layer
ether_input Parses MAC-level header of received packet. ether_output Adds MAC-level header to outgoing packet.
IP layer
ipintr Software interrupt handler for IP packet input. ipinput Parses IP header and dispatches received IP packet. ip_output Creates IP header for outgoing packet.
ip_forward Forwards packets when host acts as a router.
Clock interrupts
hardclock, Periodic (1024 Hz) clock interrupt handler clock_tick
[image:32.612.65.517.73.582.2]*New routines added to support polling.
Table 7-1: Description of important procedures shown in timeline traces
0 usec. A packet has arrived, and again lnintr() is called to begin handling the interrupt from the receiving LANCE chip.
21 usec. lanpoll_intsched() is called to schedule a poll for this event.
Procedure Description
thread_setrun, Thread scheduling and memory management thread_continue,
thread_block, switch_context, pmap_activate, get_thread_high
malloc, Memory allocation
free
m_leadingspace, Mbuf manipulation m_freem,
m_free, m_copym
lninitdesc, LANCE (Ethernet) driver lnget
arpresolve_local ARP layer ip_forwardscreen, IP layer in_canforward,
in_broadcast, gw_forwardscreen
bzero, Bulk memory operations
[image:33.612.100.552.71.367.2]bcopy
Table 7-2: Description of boring procedures shown in timeline traces
97 usec. After some thread-switching, lanpoll_isr() is called as a software interrupt hand-ler, and begins its polling loop.
112 usec. lnread() is called from lnrintpoll().
160 usec. ether_input() determines that this is an IP packet, and does not place it on a queue.
166 usec. ipinput() is called directly from ether_input().
235 usec. The IP-layer processing calls ip_output() to send the packet along.
294 usec. The LANCE driver calls lnput() to hand the buffer chain to the device.
407 usec. IP-layer processing is complete, and control returns to the polling loop.
430 usec. lanpoll_isr() calls lnintena() to re-enable interrupts from this device.
454 usec. The packet has been transmitted and the output interface has interrupted, causing a call to lnintr(), which requests service for this event.
492 usec. lanpoll_isr() is called without any thread-switching overhead, since this is still the current thread.
544 usec. lntintpoll() is called to handle the transmit event.
586 usec. lanpoll_isr() calls lnintena() to re-enable interrupts from this device.
597 usec. lanpoll_isr() exits, completing all activity related to this packet.
over-0 50 100 150 200 250 300 350 Time in usec
0 14 2 4 6 8 10 12 Stack level lnintr 0 lnrint 19 lnread 29 lnget 40
malloc 45 bcopy 64
ether_input 77
netisr_input 85
thread_wakeup_prim 93
thread_setrun 102
thread_run 153
pmap_activate 159 switch_context 164 thread_continue 176
ipintr 190
ipinput 191
ip_forwardscreen 210
gw_forwardscreen 214
ip_forward 217
in_canforward 223 m_copym 234 malloc 239 bcopy 251
ip_output 264
in_broadcast 271 ether_output 284
arpresolve_local 289 m_leadingspace 305 lnoutput 318
lnstart 321
lnput 327
bcopy 333
350 400 450 500 550 600 650
Time in usec 0 14 2 4 6 8 10 12 Stack level bzero 351 bcopy 371 m_freem 407 m_free 410 free 415
assert_wait_mesg_head 451 thread_block 458
get_thread_high 465 pmap_activate 476 switch_context 484 thread_continue 496
lnintr 522
lntint 544
bcopy 549 bcopy 559 m_freem 568
m_free 569
free 575
lninitdesc 589
[image:34.612.59.530.62.473.2]bzero 595 bcopy 606 bcopy 618 lnstart 626
Figure 7-4: Timeline forwarding a single packet, polling disabled
head confuses the situation somewhat, so we built another kernel just instrumenting the calls to lnintr() and ipinput(), and then ran a series of trials in order to obtain a statistically useful sample of the latency between these two points in the code. Each trial resulted in at least 10,000 packet receptions, almost all of which were short ICMP Echo packets.
E LIMINATING R ECEIVE L IVELOCK IN AN I NTERRUPT-DRIVEN K ERNEL 0 350 50 100 150 200 250 300
Time in usec
lnintr 0 lanpoll_intsched 21 thread_wakeup_prim 26 thread_setrun 34 thread_run 61 pmap_activate 67 switch_context 73 thread_continue 84 lanpoll_isr 97 lnrintpoll 101 lnread 112 lnget 123 malloc 128 bcopy 145 ether_input 160 ipinput 166
ip_forwardscreen 184 gw_forwardscreen 185 ip_forward 190 in_canforward 195 m_copym 205 malloc 209 bcopy 221 ip_output 235 in_broadcast 242 ether_output 254 arpresolve_local 259 m_leadingspace 272 lnoutput 284 lnstart 288
lnput 294 bcopy 299 bzero 314 bcopy 334 650 400 450 500 550 600
Time in usec
m_freem 368 m_free 374 free 379 lnintena 430 lnintr 454 lanpoll_intsched 473 lanpoll_isr 492 lntintpoll 497 bcopy 501 bcopy 511 m_freem 519 m_free 522
free 527 lninitdesc 540 bzero 546 bcopy 556 bcopy 569 lnstart 577 lnintena 586 Figure 7-5:
Timeline forwarding a single packet, polling enabled
80 140 90 100 110 120 130
Path length in usec
0 0.2 0.4 0.6 0.8 1
Cumulative fraction of events
(Polling) 87 usec
[image:35.612.109.747.92.570.2](No polling) 100 usec
Figure 7-6:
Distribution of latencies from lnintr() to ipinput()
7.4. Traces of packet bursts
0 200 400 600 800 1000 1200
[image:36.612.56.532.71.297.2]Time in usec 0 12 2 4 6 8 10 Stack level lnintr 0 lnrint 16 lnread 36 ether_input 68 netisr_input 78 thread_wakeup_prim 92 lnread 137 ether_input 159 netisr_input 166 lnintr 233 lnrint 257 lnread 266 ether_input 286 netisr_input 293 thread_run 332 ipintr 350 ipinput 355 ip_forward 382 ip_output 416 ether_output 432 lnoutput 457 lnput 462 ip_forward 549 ip_output 571 lnintr 590 lntint 608 ether_output 661 lnoutput 677 lnput 682 ip_forward 753 ip_output 777 ether_output 788 lnintr 802 lntint 819 hardclock 849 clock_tick 868 lnoutput 944 lnput 949 assert_wait_mesg_head 1027 lnintr 1077 lntint 1095
Figure 7-7: 3-packet burst latency, polling disabled
In section 4.3, we discussed how the unmodified kernel added extra latency to the processing of packets received in bursts. Figure 4-1 showed measurements of this effect on an ULTRIX kernel. With the ATOM tools, we can repeat this kind of measurement using our current test system. However, since ATOM cannot directly measure the assertion of the hardware interrupt signal, we do not include the kernel’s initial interrupt latency. We believe this missing time amounts to less than 10 microseconds.
Figure 7-7 shows a traced timeline for the non-polling kernel handling a burst of 3 short pack-ets to be forwarded. (We instrumented only the more interesting procedures for this trace, to reduce the clutter somewhat.) This trace starts with a call to lnintr(), which calls lnread() to queue the first packet, and then finds another waiting packet before calling lnread() again and dismissing the interrupt. Almost immediately, the third incoming packet causes another invoca-tion of lnintr() and thus lnread().
The scheduler then invokes the software interrupt handler, which eventually calls ipinput(), which processes the first queued packet and eventually calls lnput() to place the forwarded packet in a buffer for transmission by the output interface. This happens 462 usec. after lnintr() is first called.
0 200 400 600 800 1000 1200 Time in usec
0 12 2 4 6 8 10 Stack level lnintr 0 lanpoll_intsched 28 thread_wakeup_prim 38 thread_run 68 lanpoll_isr 86 lnrintpoll 95 lnread 123 ether_input 182 ipinput 212 ip_forward 257 ip_output 295 ether_output 320 lnoutput 357 lnput 366 lnread 489 ether_input 515 lnintr 534 lanpoll_intsched 554 ipinput 572 ip_forward 586 ip_output 616 ether_output 627 lnread 691 ether_input 717 ipinput 724 ip_forward 737 ip_output 765 ether_output 775
lnintena 842 lntintpoll 852 lnput 897 hardclock 944
clock_tick 954
lnput 977
lnintena 1022 lnintr 1048
lanpoll_intsched 1065
lnintr 1078
lanpoll_intsched 1094
lanpoll_isr 1114
lnrintpoll 1118 lnintena 1126 lntintpoll 1136 lnintena 1177
[image:37.612.100.567.55.273.2]assert_wait_mesg_head 1198
Figure 7-8: 3-packet burst latency, polling enabled
The difference may also be affected, in either direction, by some variation in the number of cache misses, although the trials were run repeatedly in order to warm up the caches. We also carefully selected traces that included as few clock interrupts as possible.
7.4.1. Implications for other applications
Although our changes improve end-to-end latency for the first packet in a burst of forwarded packets, packet forwarding is an unusual application because almost all of the work can be done without blocking. Most other applications, whether in-kernel (such as NFS service), or user-mode, require received packets to be queued for processing by another thread. Do our changes improve latency for these applications?
We note that as long as the polling thread has complete control of the CPU resources, nothing else can happen. In particular, no other thread can start processing the first packet of a burst. We can see two ways to avoid this problem:
•Multiprocessing: if the number of polling threads is smaller than the number of CPUs, at least some CPU resources will be available to finish processing early pack-ets while the polling thread (or threads) continues to receive later packpack-ets.
•CPU-time limits: in section 7 we described how our polling mechanism can set a limit on the fraction of CPU time spent in the polling thread. We implemented this by disabling polling after the thread has used m milliseconds out of an n millisecond period. This has the side-effect of limiting first-packet latency (as seen by the next consumer after the polling thread) to approximately m milliseconds, unless the burst starts while polling is inhibited because of overload.