M E T H O D
Open Access
Transcriptome assembly from long-read
RNA-seq alignments with StringTie2
Sam Kovaka
1,2, Aleksey V. Zimin
2,3, Geo M. Pertea
2,3, Roham Razaghi
2,3, Steven L. Salzberg
1,2,3,4and
Mihaela Pertea
2,3*Abstract
RNA sequencing using the latest single-molecule sequencing instruments produces reads that are thousands of nucleotides long. The ability to assemble these long reads can greatly improve the sensitivity of long-read analyses. Here we present StringTie2, a reference-guided transcriptome assembler that works with both short and long reads. StringTie2 includes new methods to handle the high error rate of long reads and offers the ability to work with full-length super-reads assembled from short reads, which further improves the quality of short-read assemblies. StringTie2 is more accurate and faster and uses less memory than all comparable short-read and long-read analysis tools.
Keywords:Transcriptome assembly, RNA-seq, Long-read sequencing, Gene expression
Background
Measuring the abundances of transcripts in an RNA-sequencing (RNA-seq) dataset is a powerful way to understand the workings of a cell. Simply aligning reads to a reference genome can provide rough esti-mates of the average expression of genes and hint at differential use of splice sites [1], but to create an ac-curate picture of gene activity, one must assemble collections of reads into transcripts. Alternative spli-cing is very common in eukaryotes, with an estimated 90% of human multi-exon protein-coding genes and 30% of non-coding RNA (ncRNA) genes having mul-tiple isoforms [2, 3]. While the number of annotated human protein-coding genes has remained more or less constant over the last decade, the number of ncRNA genes and protein-coding isoforms has contin-ued to increase [4].
Second-generation sequencers, such as those from Illumina, can produce hundreds of millions of short (~ 100 bp) RNA-seq reads. Reads of this length usually span no more than two exons, except in cases of very small exons. By assembling the short reads, we can
reconstruct full-length transcripts and identify novel genes and gene isoforms. There are two main ap-proaches to transcriptome assembly: de novo and reference-guided. De novo transcriptome assemblers such as Trinity [5] and Oases [6] find overlaps be-tween reads and attempt to chain them together into full transcripts, without aligning the reads to a genome. This task is complicated by the presence of paralogous genes and transcripts with many isoforms that largely overlap one another, and as a result, this approach produces highly fragmented and error-prone transcriptomes. Reference-guided assemblers such as Cufflinks [7], Bayesembler [8], StringTie [9], Trans-Comb [10], and Scallop [11] take advantage of an existing genome to which the RNA-seq reads are first aligned using a spliced aligner such as HISAT [12] or STAR [13]. These assemblers can then build splice graphs (or other data structures) based on the align-ments and then use those graphs to construct individ-ual transcripts. Some reference-guided assemblers can also use the exon-intron annotation of known tran-scripts as an optional guide, allowing them to favor known genes where possible. A recent study [14] found that StringTie outperforms both Cufflinks and Bayesembler, by assembling more transcripts correctly and at a higher precision, while the original Scallop study [11] showed that on some datasets, Scallop can
© The Author(s). 2019Open AccessThis article is distributed under the terms of the Creative Commons Attribution 4.0 International License (http://creativecommons.org/licenses/by/4.0/), which permits unrestricted use, distribution, and reproduction in any medium, provided you give appropriate credit to the original author(s) and the source, provide a link to the Creative Commons license, and indicate if changes were made. The Creative Commons Public Domain Dedication waiver (http://creativecommons.org/publicdomain/zero/1.0/) applies to the data made available in this article, unless otherwise stated. * Correspondence:[email protected]
2
Center for Computational Biology, Whiting School of Engineering, Johns Hopkins University, Baltimore, MD 21205, USA
3Department of Biomedical Engineering, Johns Hopkins University, Baltimore,
MD 21218, USA
achieve higher sensitivity and precision than StringTie (version 1.3) and TransComb.
StringTie and other transcriptome assemblers esti-mate transcript abundance based on the number of aligned reads assigned to each transcript. More re-cently, alternative methods such as Sailfish [15], Salmon [16], and Kallisto [17] demonstrated that one can estimate abundances by assigning reads to known transcripts based on exact k-mer matching, which produces dramatic gains in speed by dropping the re-quirement for precise base-level read alignment. However, these alignment-free methods are not able to detect novel genes or isoforms, and they show poorer per-formance in quantifying low-abundance and small RNAs compared to alignment-based pipelines [18].
The original release of StringTie proposed a method to use a limited version of de novo transcriptome as-sembly via the construction of super-reads, which were originally developed for whole-genome assembly [19]. Conceptually, super-reads are constructed by ex-tending each end of a short read as long as there is a unique extension based on a k-mer lookup table. This creates a collection of synthetic long reads with the low error rate of short reads. Because they are longer, they are more likely to align uniquely to the genome, which in turn might simplify the splice graph of a gene. Super-reads were used in a limited capacity in StringTie 1.0 (henceforth StringTie1), only filling in the gap between paired-end reads. In that limited im-plementation, a super-read was used to replace a pair of reads, allowing it to be treated like a single, un-paired read. One difficulty in using super-reads is that the algorithm used to create them for genome assem-bly includes an error correction step, which in the context of RNA-seq assembly can over-write k-mers from low-abundance transcripts. Another complica-tion is that a full super-read may contain many short reads, and thus, it cannot be counted as a single read during the quantification step. We have therefore de-veloped an expectation-maximization (EM) algorithm to distribute read coverage between super-reads.
While second-generation sequencers produce very large numbers of reads, their read lengths are typically quite short, in the range of 75–125 bp for most RNA-seq experiments. These short reads often align to more than one location, and we designate such reads as “ multi-mapping.”Short reads also suffer the limitation that they rarely span more than two exons, making the splice graph difficult and sometimes impossible to traverse ac-curately for genes with multiple exons and many diverse isoforms, no matter how deeply they are sequenced. These issues can be alleviated by third-generation se-quencing technologies such as those from Pacific Biosci-ences (PacBio) and Oxford Nanopore Technologies
(ONT). These long-read technologies, which can pro-duce read lengths in excess of 10,000 bp, have dramatic-ally improved whole-genome assemblies [20], and when used for RNA-seq experiments, they offer the potential for large gains in the accuracy of isoform identification and discovery [21–23]. While some reads produced by third-generation sequencers cover the full length of RNA transcripts, many will inevitably capture only par-tial transcripts. This happens for a variety of reasons, e.g., (1) RNA degrades quickly and may be shorter than full length by the time it is captured for sequencing; (2) long molecules can break during library preparation; or (3) in cDNA sequencing, the reverse transcription step may fail to capture the full RNA molecule. Thus, com-putational tools that only consider reads which fully cover a transcript will be forced to discard many reads, possibly causing a substantial reduction in sensitivity. To date, though, long reads have not been widely adopted for transcriptome assembly, in part because they have a much higher error rate (typically 8–10% or higher), mak-ing alignment difficult [24, 25], and also because long-read sequencers have much lower throughput, which makes accurate quantification of all but the highest-expressed genes impossible.
Various tools have recently been developed to correct errors and/or extract full-length transcripts from gen-ome alignments of long RNA-seq reads. Tools that process full-length transcripts from PacBio Iso-Seq reads, including ToFU [26], TAPIS [27], and SQANTI [28], cannot assemble reads that only partially cover transcripts into full-length transcripts, nor can they be applied to ONT reads due to their reliance on identify-ing 5′ and 3′ ends based on PacBio-specific adapters. TranscriptClean [29] corrects mismatches, indels, and non-canonical splice-sites in long-read alignments, but does not attempt to identify full-length transcripts. FLAIR [30] corrects splice-sites based on known, user-provided annotation and outputs transcripts from the annotation that are fully covered by “high-confidence” reads. As an alternative to these approaches, which de-pend on known transcripts, one can assemble long-read fragments using the same methods used for short-read transcriptome assembly. In addition to finding novel transcripts, the assembly approach can more readily handle fragments that match multiple isoforms, and it can correct alignment errors by forming a consensus from multiple reads. Traphlor [31] is the only previously described system designed to assemble high-error long reads, although we show it performs relatively poorly on both simulated and real data.
datasets demonstrate that StringTie2 is more accurate than Scallop, the next-best performing transcriptome as-sembler of those currently available. The use of super-reads also consistently improves both the sensitivity and precision of StringTie2 assemblies. When applied to long reads, StringTie2 assembles the reads substantially more accurately, faster, and using less memory than FLAIR, the next-best performing tool for long-read analysis. As opposed to FLAIR, StringTie2 can also identify novel transcripts from the long-read data, even when no refer-ence annotation is provided.
Results
Transcriptome assembly of short RNA-seq reads
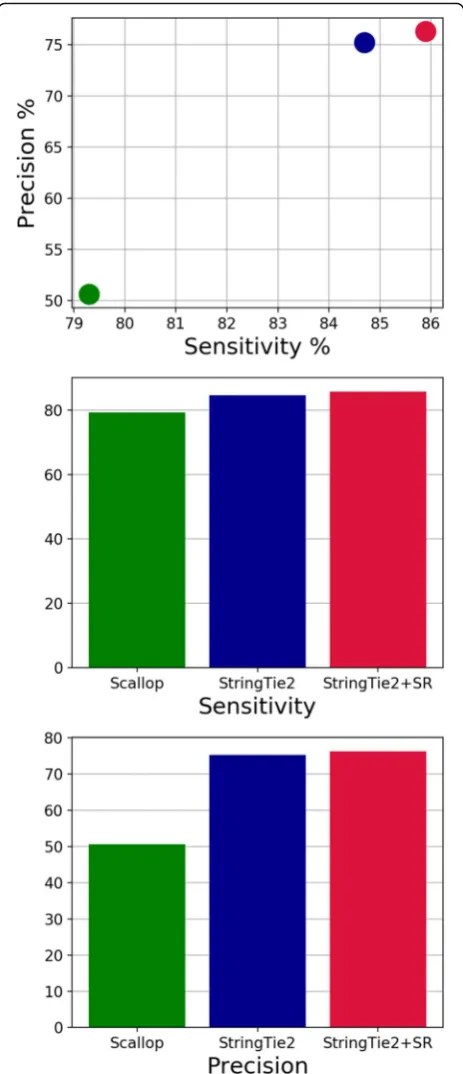
We first used simulated human data to compare the sen-sitivity and precision of StringTie2, with and without super-reads, to that of Scallop (Fig. 1), one of the most recent transcriptome assemblers for short RNA-seq data, which was shown on some data to yield an improvement in assembly accuracy over StringTie1 [11].
We define sensitivity as the percent of expressed tran-scripts that match a transcript predicted (or output) by each tool and precision (equivalently called positive pre-dictive value) as the percent of predicted transcripts that match an expressed transcript. We tuned the default pa-rameters of StringTie2 to have approximately the same precision as StringTie1 (version 1.3) on this simulated data. StringTie2, with default parameters, is both more sensitive and more precise than Scallop on this data, and the use of super-reads increases both the sensitivity and precision of StringTie2 compared to using short-read alignments alone. Note that on this data, StringTie2 is also more sensitive and more precise than StringTie1 (Additional file 1: Figure S1). We also computed the Spearman correlation coefficients of the expression levels predicted by each tool compared to the true ex-pression levels on simulated data (Table1). StringTie2’s estimates of expression levels have a higher correlation than Scallop over all predicted and expressed transcripts, and the use of super-reads improves this correlation further.
We next evaluated performance on real short-read data, which is considerably more complex than simu-lated data. For the real data, we cannot know with cer-tainty which transcripts were expressed in each dataset, nor can we know their precise expression levels. How-ever, it is generally safe to assume that an assembler is more sensitive if it assembles more transcripts matching known annotations (i.e., transcripts from a published database of known genes), and that it is more precise if the known transcripts represent a higher proportion of all the transcripts that are output by the assembler. Therefore, for each sample, we calculate sensitivity and precision by considering the number of assembled
transcripts that match annotations as correct ones (i.e., true positives), and counting all additional transcripts as incorrect (also see the“Methods”section).
[image:3.595.306.538.87.625.2]We ran StringTie2 and Scallop on 23 short-read data-sets from human, five from Arabidopsis thaliana, and five from Zea mays (see the “Methods” section). Note that our datasets included all ten human samples that were used by Shao and Kingsford to show that Scallop is more sensitive than StringTie while maintaining the
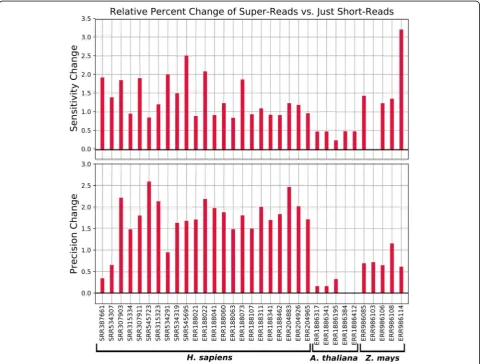
[image:4.595.56.292.155.210.2]same level of precision [11]. StringTie2 obtained both better sensitivity and precision than Scallop on all 23 human datasets tested and 9/10 plant datasets (Fig. 2 and Additional file2: Table S1). On average, StringTie2 obtained a relative increase over Scallop of 3.9% in sen-sitivity and 47.3% in precision. On the one Zea mays dataset (ERR986114) where Scallop had slightly higher precision than Stringtie2 (17.4% vs 16.3%), StringTie2 obtained a 24% relative increase in sensitivity (Fig. 2). Close inspection of the read alignments from this sam-ple in IGV [32] revealed that there were many gaps in coverage within individual transcripts, possibly due to the highly repetitive nature of the Z. mays genome. Examining finer-grained statistics revealed that the intron-level precision of StringTie2 was higher than Scallop on this dataset (Additional file 2: Table S2), suggesting that the reduced transcript-level precision could be due to split transcripts caused by drops in Table 1Spearman correlation coefficients for the performance
of Scallop, StringTie2, and StringTie2 with super-reads on simulated short-read data.“Spearman predicted”only includes transcripts that each tool assembled. For non-assembled transcripts in“Spearman all,”the predicted expression was set to zero
Spearman all Spearman predicted
Scallop 0.726 0.828
StringTie2 0.781 0.925
StringTie2+SR 0.788 0.930
Fig. 2Relative change in sensitivity and precision of StringTie2 vs. Scallop on 23 real short-read RNA-seq datasets from human, five datasets from
[image:4.595.57.537.320.693.2]coverage, which would result in fewer full-length tran-script matches while leaving most introns intact. In fact, adjusting corresponding parameters in StringTie2 and Scallop to allow for larger gaps in coverage (see the
“Methods” section) resulted in higher sensitivity and precision for StringTie2 on all Zea mays datasets (Additional file2: Table S3).
StringTie2 is not only more accurate than Scallop, but also more time and memory efficient. Averaging over all real short-read datasets, StringTie2 ran 1.8 times faster than Scallop and used 17 times less memory (Additional file2: Table S4).
The use of super-reads increased both the sensitivity and precision of StringTie2 on all human datasets and all but three plant datasets (Fig. 3). Among those three, StringTie2 had an increase in precision but no change in sensitivity on oneZ. maysdataset, and an increase in sen-sitivity but no change in precision on two Arabidopsis datasets.
Transcriptome assembly of third-generation RNA-seq long reads
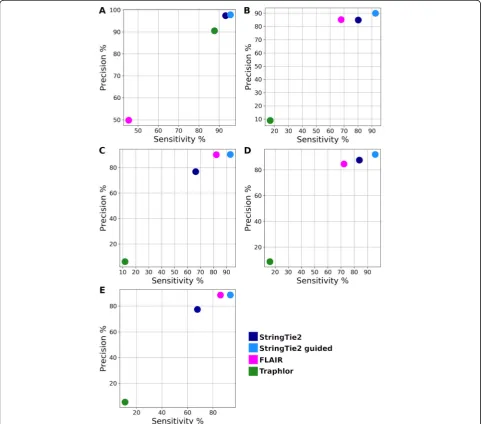
We next compared StringTie2’s performance on long-reads with that of FLAIR and Traphlor, the only other systems that can process both PacBio and ONT long-read RNA sequencing data. Because we cannot know the true transcripts that are present in real RNA-seq data sets, we first used simulated data to assess the accuracy of all tested tools. We obtained five simulated datasets generated by [33], who used the DNA simulator PBSIM [34] tuned to mimic the characteristics of either PacBio or ONT RNA-seq data. These datasets consist of a Saccharomyces cerevisiae PacBio run, two Drosophila melanogaster runs (one PacBio, one ONT), and two hu-man chromosome 19 runs (one PacBio, one ONT). We ran StringTie2, FLAIR, and Traphlor on these simulated datasets and computed sensitivity and precision as be-fore. FLAIR requires gene annotation as a guide to align-ment, so we also ran StringTie2 with the same guide
[image:5.595.58.539.331.695.2]annotation in order to make a direct comparison. Re-sults are shown in Fig.4.
Traphlor had lower sensitivity and precision than StringTie2 and FLAIR on all datasets except for the S. cerevisiae PacBio data (Fig. 4a). Note that only 4.4% of the simulated transcripts in theS. cerevisiaePacBio data-set contain multiple exons, a much smaller proportion than the other datasets, which may explain why Traphlor performed relatively well on this data while performing poorly on the human and Drosophila data. StringTie2 with annotation as a guide outperformed FLAIR on all datasets, and in some cases, StringTie2 without guide annotation performed equally well. Because this was simulated data, the guide annotation included all transcripts that were present in the sample,
even if not all of them were expressed. Real datasets are likely to contain unannotated transcripts and may lack many known, annotated genes entirely.
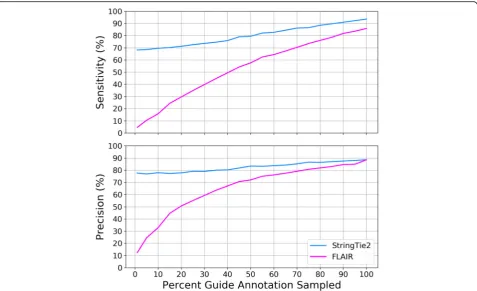
To demonstrate the performance of each tool when transcripts are missing from the guide annotation, we ran StringTie2 and FLAIR on the human chromosome 19 ONT data using random samples of the chromosome 19 annotation, which we varied to contain from 1 to 100% of the transcripts. Results are shown in Fig.5. The sensitivity and precision of FLAIR decreases rapidly as the amount of annotation is reduced, e.g., when only 20% of the annotation is provided, FLAIR’s sensitivity and precision dropped to 30% and 50% respectively. In contrast, with that same amount of annotation, String-Tie2’s results were far better, 74% and 80%. This result
Fig. 4Sensitivity and precision of StringTie2 (with and without guide annotation), FLAIR, and Traphlor on long read simulated data fromaPacBio
[image:6.595.57.540.277.701.2]demonstrates FLAIR’s strong reliance on the guide an-notation and StringTie2’s contrasting ability to assemble transcripts that are not present in the annotation.
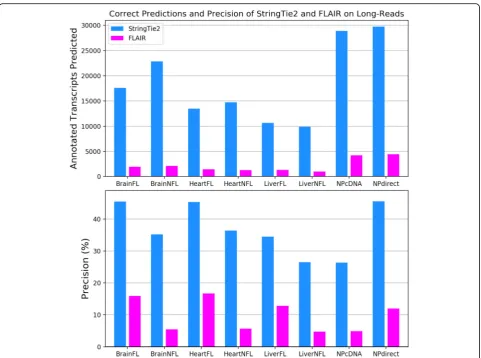
We next ran StringTie2, FLAIR, and Traphlor on eight real human long-read datasets: three PacBio datasets enriched for full-length transcripts (PacBioFL), three PacBio datasets containing transcript fragments (Pac-BioNFL), one Nanopore cDNA dataset (NPcDNA), and one Nanopore direct RNA-seq dataset (NPDirect). Traphlor failed to produce any transcripts on the NPcDNA dataset and had drastically worse precision and sensitivity compared to StringTie2 on all other data-sets (Additional file 2: Table S5). Averaging across all datasets on which Traphlor was able to run, StringTie2 correctly assembled 9564 transcripts, 2.6 times more than Traphlor’s 3708 correct assemblies. Compared to FLAIR, StringTie2 with guide annotation correctly iden-tified 16,000 more transcripts on average, with precision that ranged from about three to six times higher (Fig.6, Additional file 2: Table S5). FLAIR performed the best on the Nanopore direct RNA-seq dataset, where it correctly identified 4442 transcripts matching the anno-tation. By comparison, StringTie2 correctly assembled 29,744 transcripts, 6.7 times more than FLAIR. Even without using guide annotation, StringTie2 substantially
outperformed FLAIR on all of the real datasets (Add-itional file2: Table S5). Finally, StringTie2 with annota-tion runs 68 times faster than FLAIR and uses 9 times less memory, averaged over all real long-read datasets. Without annotation, StringTie2 is 93 times faster than FLAIR and uses 27 times less memory (Additional file2: Table S6).
Discussion
The new StringTie2 system focuses on extending String-Tie1’s capacity to handle long-read data, mostly by cleaning noise from the read alignments and by imple-menting more efficient data structures (see the
[image:7.595.60.538.87.378.2]split by drops in read coverage, which can create two in-correct transcripts. An examination of intron-level ac-curacy revealed that StringTie2 was more accurate than Scallop on all data sets at that level (Additional file 2: Table S2). We also found that adjusting the parameters for both StringTie2 and Scallop for Z. mays improved the performance of both systems on that data, demon-strating that default parameters may not be optimal for all datasets. A systematic process for tailoring parame-ters to a particular dataset was recently explored for both Scallop and StringTie [35].
Its ability to use super-reads introduces partial de novo assembly into StringTie2, which provides modest im-provements in sensitivity, precision, and abundance esti-mation on real and simulated data.
The high error rates of long reads generated by third-generation sequencers present distinct challenges that make identifying the exact exon-structure of a
[image:8.595.58.540.85.443.2]easily run as a single command, unlike tools such as FLAIR which consist of a series of scripts that may each rely on other tools. StringTie2 is also multi-threaded, which allows it to be run in parallel on multi-processor computers and can significantly re-duce the “wall clock” runtime of assembly.
It is worth noting that StringTie2 and FLAIR had higher accuracy on the ONT direct RNA dataset than on the cDNA dataset, despite the fact that both data-sets were sequenced from the same sample. Direct RNA sequencing currently produces lower yields than cDNA sequencing; however, both datasets combined reads from multiple flowcells resulting in high cover-age for each. The decreased accuracy is likely due to slightly lower read accuracy for the cDNA (85%) ver-sus RNA (86%) data and to the smaller average frag-ment lengths in the cDNA dataset [36]. We also observed that 22% of the transcripts assembled by StringTie2 from the cDNA data were fully contained within introns, versus only 4% of the assemblies from the direct RNA data, suggesting the presence of a greater number of incompletely processed transcripts in the cDNA.
Further development of long-read RNA-seq technolo-gies will increase the usefulness of StringTie2. In the case of ONT reads, improvements to basecalling will im-prove alignment quality, which will further imim-prove StringTie2’s assemblies. As third-generation sequencers increase their throughput, researchers will also be able to use long-read RNA-seq for accurate transcript-level quantification, which currently requires the higher throughput of short read (i.e., Illumina) sequencers. ONT direct RNA sequencing has additional unique cap-abilities which are only beginning to be explored, such as the ability to identify RNA base modifications and secondary structure from the raw signal [36]. Better transcriptome assemblies will aid these efforts because these read-level features can then be associated with the full transcripts.
Conclusions
We have demonstrated that StringTie2 can assemble RNA-seq data into full-length transcripts using both high-accuracy short reads and high-error long reads. StringTie2 outperforms all comparable tools in both transcriptome quality and computational performance. The ability to as-semble noisy long reads enables greater sensitivity in downstream analyses and will become increasingly useful as long-read RNA sequencing technologies mature.
Methods
Reference genomes and annotations
All human RNA-seq reads were mapped to the main chromosomes of GRCh38, not including the“alternate”
and “random” scaffolds. The annotation used to com-pute the accuracy of transcriptome assemblies and to create the human short-read simulated data and the annotation-guided assemblies contains all full-length protein and long non-coding RNA transcripts from RefSeq, release GRCh38.p8. The A. thaliana RNA-seq reads were aligned to the TAIR10 assembly, and the full corresponding annotation was used for determining ac-curacy [37]. TheZ. mays reads were aligned to the B73 RefGen assembly, and the full corresponding annota-tion was obtained from MaizeGDB [38].
Simulated data
A short-read RNA-seq dataset containing 150 million 75-bp paired-end reads was generated using Flux Simulator [39] with all protein-coding and lncRNA transcripts on the main chromosomes of GRCh38. The parameters for the simulation were the ones rec-ommended for Homo sapiens in Additional file 2: Table S4 from [39]. Long read simulated data for S. cerevisiae S288 (baker’s yeast), D. melanogaster r6 (fruit fly), and GRCh38.p7 was obtained from [33]. The long reads were simulated using either PacBio (one dataset for yeast, fruit fly, and human each) or MinION ONT profiles (one data set for fruit fly and one for human).
Alignment and assembly parameters
All short-read datasets were aligned using HISAT2 [40] with default parameters. The PacBio and ONT datasets were aligned with minimap2 [41] (version 2.12) using the “-splice” option, which enables spliced alignment of noisy long reads. Super-reads were aligned using GMAP [42] because their error profile more closely resembles that of EST sequences, which aligners like minimap2 are not designed for.
All assemblies in Additional file 2: Table S1 were run using default parameters for both StringTie2 (ver-sion 2.0.0) and Scallop (ver(ver-sion 0.10.2). The Z. mays samples in Additional file 2: Table S3 were run with the “-t -g 200” options in StringTie2 and the “--min_ bundle_gap 200” option in Scallop. This increases the maximum allowable gap between reads within a tran-script from the default 50 to 200 bp for both tools and disables trimming of transcripts when the read coverage drops below a given threshold at the 5′ or 3′ ends for StringTie2 (no corresponding option ex-ists for Scallop). StringTie2 was run using the “-L” parameter for all long-read datasets. Three FLAIR sub-commands were run in sequence to obtain the GTF of covered transcripts: “align,” “correct,” and
Accuracy metrics
Similarly to previous studies (e.g., [14]), we used the fol-lowing metrics to report the accuracy of the transcrip-tome assemblies:
Sensitivity¼TP=ðTPþFNÞ
Precision¼TP=ðTPþFPÞ
where TP (or true positives) are correctly assembled transcripts, FP (or false positives) are transcripts that are assembled but do not match the reference annotation, and FN (or false negatives) are transcripts in the refer-ence annotation that are missing from the assembly. Note that FP is not a true measure of false positives for real (as opposed to simulated) data, because the refer-ence annotation is incomplete for essentially all eukaryotic genomes today. Thus, transcripts that do not match the annotation might nonetheless be correct, and a more accurate term might be “additional transcript predictions.” However, for the purposes of comparison between methods, and for consistency with previous studies, we retain this definition. Sensitivity and preci-sion were determined by runninggffcompare[43]. At the transcript level, an assembled transcript was consid-ered correct if, in comparison to an annotated transcript, it shared all splice site boundaries exactly and the ter-minal exons ended within 100 bp of each other. Intron-level accuracy, shown in Additional file 2: Table S2, was calculated similarly, where an intron was considered cor-rect if both ends precisely matched an annotated intron.
Relative percent change in sensitivity (Sr) and precision
(Pr) of StringTie2 versus another method was computed
as Sr¼100S1S−2S2, and Pr¼100P1P−2P2, where S1and P1are the sensitivity and precision of StringTie2, andS2 and P2 are the sensitivity and precision of the method which we compare it to (e.g., Scallop or FLAIR). For ex-ample, a 10% absolute increase in sensitivity from S2= 20% toS1= 30% would be reported as a relative increase of 50%.
For real datasets, we have no way to determine exactly what transcripts were truly present in the sample. There-fore, for the purpose of comparison, we defined the set of reference or “true” transcripts to be the union of all annotated transcripts correctly predicted by each tool on a given sample. This metric will overestimate the abso-lute sensitivity if there are transcripts that no tool pre-dicts, but the relative sensitivity comparison will be accurate because the denominator is the same between samples and therefore cancels out.
New data structures in StringTie2 compared to StringTie1
StringTie2 builds on our previously developed String-Tie1 system, which introduced several key innovations, notably (1) a novel network flow algorithm to
reconstruct transcripts and quantitate them simultan-eously and (2) an assembly method to merge read pairs into full fragments in the initial phase [9]. StringTie2 maintains the same general framework for the assembly and quantification of transcripts but implements much more efficient data structures that overall lead to faster run times and much lower memory usage (see the “ Re-sults”section). It includes additional techniques designed to handle very long reads, including high error-rate reads produced by the third-generation sequencers, as well as the longer reads that result from the pre-assembly of short reads.
There are three main differences in the way StringTie2 stores aligned reads compared to StringTie1. The first difference is that instead of storing every read individu-ally, StringTie2 collapses reads aligned to the identical location on the genome and keeps a count of how many alignments were collapsed. This simple change has a big impact on the memory required to store input data, be-cause very highly expressed transcripts can sometimes reach a coverage of hundreds of thousands of reads per base. (see for instance Additional file1: Figure S5, which illustrates the very high level of expression for the COL1A1 gene in sample SRR534291 that was collected from fetal lung fibroblasts.) However, implementing this change was quite complex, because it also required us to create a different method for storing the pairings be-tween reads, as reads aligned at the same place do not necessarily have their “mates” (the second read in each pair) sharing the same alignments. Previously, for each read, StringTie1 stored a pointer to its pair. StringTie2 must instead store an array of pointers to all paired read alignments that are present in the data.
StringTie2 also differs from StringTie1 in its more ag-gressive strategy for identifying and removing spurious spliced alignments. If a spliced read is aligned with more than 1% mismatches, keeping in mind that Illumina se-quencers have an error rate < 0.5%, then StringTie2 re-quires 25% more reads than usual (the default is 1 read per bp) to support that particular spliced alignment. In addition, if a spliced read spans a very long intron (more than 100,000 bp), StringTie2 accepts that alignment (and the intron) only if a larger anchor of 25 bp (10 bp is the default) is present on both sides of the splice site. Here the term “anchor” refers to the portion of the read aligned within the exon beginning at the exon-intron boundary.
between reads and the splice graph. In order to maximize the efficiency of such searches, StringTie1 uses a bit-vector representation of the splice graph, where the first n bits (0 to n-1) correspond to all nodes in the splice graph, and bit n*i + j corresponds to a possible edge between nodesiandjin the splice graph, where n is the number of nodes in the graph andi < j(Additional file 1: Figure S6). Thus, there are n*(n-1)/2 bits for the possible edges. A read or a paired read will therefore be represented by a vector of bits where only the bits that represent the nodes or edges spanned by the read and its pair are set to 1. Because in general many of the nodes in the splice graph are not connected by edges, most bits in this bit-vector representation will be 0; therefore, StringTie2 replaces it with a sparse bit-vector data structure, where the bits can only correspond to a node or an edge appearing in the splice graph. Building more efficient data structures in StringTie2 greatly re-duced the memory footprint of the StringTie system. On the three datasets from this study that were also exam-ined in the original StringTie release, memory usage was reduced on average by a factor of 40 (Additional file 1: Figure S7).
Assembly of long RNA-seq reads
Third-generation sequencing technologies (i.e., from PacBio and Oxford Nanopore sequencing instruments) have an error profile that consists mostly of insertion and deletions, as opposed to second-generation errors that are mostly substitutions. Insertion and deletions are harder to correct than substitutions, and the accuracy of methods for correcting them is generally low [44]. Fur-ther complicating matters, aligning long reads correctly around splice sites is challenging, and mis-alignments lead to spurious edges in the splice graph, which in turn leads to incorrect transcript predictions [23].
To handle the high error rates in the long reads, we implemented two new techniques in StringTie2. First, we correct potentially wrong splice sites by checking all the splice sites present in the alignment of a read with a high-error alignment rate. If a splice site is not sup-ported by any low-error alignment reads, then we try to find a nearby splice site (within 10 bp, by default) that is supported by the most alignments among all nearby splice sites. If we can find such a splice site, then we ad-just the read alignment to match it. While this technique greatly reduces the false alignments around the splice sites, it does not eliminate the presence of spurious false exons introduced by random sequencing insertion er-rors. Pruning edges that are not supported by a mini-mum number of spliced reads, as described above, eliminates some of the false-positive edges. However, in regions of very high within-transcript sequence coverage, there may still be too many spurious nodes and edges in
the splicing graph, which in turn may cause StringTie1 to hang indefinitely. To improve StringTie2’s efficiency in such cases, we designed and implemented a pruning algorithm that reduces the size of the splicing graph to a more realistic size (see Additional file 1: Algorithm S1). This algorithm removes edges in the graph starting from the edge least supported by reads to the most supported edge, until the number of nodes in the splicing graph falls under a given threshold (by default 1000 nodes). Pruning edges in the splicing graph will also change the internal representation of the long reads affected by the pruning. For instance, a long read that spans a node that is no longer part of the splicing graph might be repre-sented as an interrupted read instead of a one continu-ous read, similar to how two paired reads are represented (see Additional file1: Figure S6b).
Super-read construction and quantification
Super-reads were constructed using code adapted from the MaSuRCA assembler [19]. MaSuRCA builds ak-mer lookup table out of every sequence of length k(k-mers) in the input reads. It uses this to create “k-unitigs,” which are defined as sequences of maximal lengths such that every k-mer except the first and last has a unique preceding and following k-mer. Super-reads are then constructed by matching eachk-mer at the ends of each short read to a uniquek-unitig, effectively extending the short read as far as there is a unique extension. Note that it is possible for a super-read to contain multiple short reads, and for a short read to be contained in mul-tiple super-reads. Not all short reads are assigned to a super-read, so both super-reads and unassigned short reads are used for assembly.
Prior to the construction of the k-mer lookup table, MaSuRCA uses QuorUM [45] to correct errors in the short reads. The built-in parameters that it uses for gen-ome assembly are not optimal for transcriptgen-ome assem-bly. For example, these parameters include a minimum number of times a k-mer must appear to be considered high quality, which is appropriate for genome assembly where all sequences should be covered uniformly, but not for transcriptome assembly, where some transcripts may have coverage as low as a single read. Therefore, we modified these routines to remove the minimum k-mer count thresholds used for error correction. There are also certain cases where the first and/or lastk-1bases of a super-read can extend into alternatively spliced exons, which could mislead the assembly process. To alleviate this problem, StringTie2 ignores the first and last k-1 bases of aligned super-reads.
estimate coverage, we first find every super-read con-taining each short read by matching the k-unitigs. A read is assigned to a super-read if its k-unitigs are con-tained in the super-read in the same continuous order (or reverse order for the opposite strand), which hap-pens if and only if the read (or its reverse complement) is an exact substring of the super-read. During this step, we only consider super-reads that have been aligned to the reference genome. After read assignment, we use an expectation-maximization algorithm to estimate cover-age for each super-read. The initial estimate sums the coverage of each read or fragment uniquely assigned to one super-read. Each iteration then recomputes coverage for every super-read by distributing coverage from each read proportionally to the previous super-read coverage estimate. This is analogous to how StringTie2 distributes coverage between transcripts. We report the computed coverage for each super-read using a special tag in the SAM output file, which is then merged with an aligned short-read SAM file for input to StringTie2, which uses the super-reads to weight the paths that they match in the splice graph.
Supplementary information
Supplementary informationaccompanies this paper athttps://doi.org/10. 1186/s13059-019-1910-1.
Additional file 1: Algorithm S1.Splicing graph pruning algorithm.
Figure S1.Sensitivity and precision of StringTie2 versus StringTie1 on simulated data.Figure S2.An IGV snapshot of aligned ONT direct RNA reads in the region of gene C1orf174.Figure S3.An IGV snapshot of aligned simulated PacBio RNA reads from transcript uc060qvn.1.Figure S4.An IGV snapshot of aligned simulated PacBio RNA reads from transcript uc284pkq.1.Figure S5.An IGV snapshot of a extremely highly expressed transcript in the COL1A1 gene.Figure S6.a) Bit
vector representations of a splice graph, an assembled transcript, and a fragment with two paired reads sequenced. b) Example of a long read aligning to the splice graph.Figure S7. Memory usage for StringTie1 and StringTie2.
Additional file 2: Table S1.Short-read accuracy.Table S2.Increased gap corn.Table S3.Short-read profiling.Table S4.Long-read accuracy.
Table S5. Long-read profiling.
Additional file 3.Review history
Acknowledgements
Not applicable.
Review history
The review history is available as Additional file3.
Peer review information
Barbara Cheifet was the primary editor on this article and managed its editorial process and peer review in collaboration with the rest of the editorial team.
Authors’contributions
SK designed and implemented the super-read module with the help from AVZ. SK ran all the programs, evaluated their performance on all data sets, and tuned their parameters. SK and RR evaluated the performance of StringTie2 on long-read data. MP designed the new algorithms in StringTie2. MP and GMP implemented the new algorithms in StringTie2. SLS gave feedback on experimental design and
on StringTie2’s performance. SK, MP, and SLS wrote the paper. MP supervised the entire project. All authors read and approved the final manuscript.
Funding
This work was supported in part by grants DBI-1458178 and DBI-1759518 from the National Science Foundation and grants R01-HG006677 and R35GM130151 from the US National Institutes of Health.
Availability of data and materials
StringTie2 is implemented in C++ and is freely available as open-source soft-ware under the MIT license athttps://github.com/gpertea/stringtie[46]. Ten of the short-read RNA-seq datasets used in this study were also used by Shao and Kingsford in their evaluation of Scallop [11] and can be found on the Sequence Read Archive under the following accessions: SRR307903, SRR315323, SRR315334, SRR534307, SRR545723, SRR307911, SRR387661, SRR534291, SRR534319, and SRR545695. Three of these ten—SRR534291, SRR534319, and SRR545695—were used in the original StringTie study [9], which described StringTie1. We also examined 13 short-read samples randomly selected from the GEUVADIS dataset [47] that can be found on the European Nucleotide Archive under the following accessions: ERR188021, ERR188022, ERR188041, ERR188060, ERR188063, ERR188073, ERR188107, ERR188311, ERR188341, ERR188462, ERR204883, ERR204926, and ERR204965. The fiveArabidopsis thalianadatasets were obtained from [48] and can be found on the European Nucleotide Archive: ERR1886195, ERR1886317, ERR1886341, ERR1886384, and ERR1886412. The fiveZ. maysdatasets were obtained from [49] and can be found on the European Nucleotide Archive: ERR986085, ERR986103, ERR986106, ERR986108, and ERR986114. The“full length”and“not full length”PacBio datasets were downloaded fromhttp:// datasets.pacb.com.s3.amazonaws.com/2014/Iso-seq_Human_Tissues/list.html. The ONT direct RNA-seq and cDNA datasets are from the NA12878 RNA se-quencing consortium [36].
Ethics approval and consent to participate
Not applicable.
Consent for publication
Not applicable.
Competing interests
The authors declare that they have no competing interests.
Author details
1Department of Computer Science, Johns Hopkins University, Baltimore, MD
21218, USA.2Center for Computational Biology, Whiting School of
Engineering, Johns Hopkins University, Baltimore, MD 21205, USA.
3Department of Biomedical Engineering, Johns Hopkins University, Baltimore,
MD 21218, USA.4Department of Biostatistics, Bloomberg School of Public
Health, Johns Hopkins University, Baltimore, MD 21205, USA.
Received: 10 September 2019 Accepted: 2 December 2019
References
1. Li B, Dewey CN. RSEM: accurate transcript quantification from RNA-Seq data with or without a reference genome. BMC Bioinformatics. 2011;12:323. 2. Wang ET, Sandberg R, Luo S, Khrebtukova I, Zhang L, Mayr C, et al.
Alternative isoform regulation in human tissue transcriptomes. Nature. 2008; 456:470–6.
3. Cabili MN, Trapnell C, Goff L, Koziol M, Tazon-Vega B, Regev A, et al. Integrative annotation of human large intergenic noncoding RNAs reveals global properties and specific subclasses. Genes Dev. 2011;25:1915–27. 4. Pertea M, Shumate A, Pertea G, Varabyou A, Breitwieser FP, Chang Y-C, et al.
CHESS: a new human gene catalog curated from thousands of large-scale RNA sequencing experiments reveals extensive transcriptional noise. Genome Biol. 2018;19:208.
5. Grabherr MG, Haas BJ, Yassour M, Levin JZ, Thompson DA, Amit I, et al. Full-length transcriptome assembly from RNA-Seq data without a reference genome. Nat Biotechnol. 2011;29:644–52.
7. Trapnell C, Williams BA, Pertea G, Mortazavi A, Kwan G, van Baren MJ, et al. Transcript assembly and quantification by RNA-Seq reveals unannotated transcripts and isoform switching during cell differentiation. Nat Biotechnol. 2010;28:511–5.
8. Maretty L, Sibbesen JA, Krogh A. Bayesian transcriptome assembly. Genome Biol. 2014;15:501.
9. Pertea M, Pertea GM, Antonescu CM, Chang T-C, Mendell JT, Salzberg SL. StringTie enables improved reconstruction of a transcriptome from RNA-seq reads. Nat Biotechnol. 2015;33:290–5.
10. Liu J, Yu T, Jiang T, Li G. TransComb: genome-guided transcriptome assembly via combing junctions in splicing graphs. Genome Biol. 2016;17:213. 11. Shao M, Kingsford C. Accurate assembly of transcripts through
phase-preserving graph decomposition. Nat Biotechnol. 2017;35:1167–9. 12. Kim D, Langmead B, Salzberg SL. HISAT: a fast spliced aligner with low
memory requirements. Nat Methods. 2015;12:357–60.
13. Dobin A, Davis CA, Schlesinger F, Drenkow J, Zaleski C, Jha S, et al. STAR: ultrafast universal RNA-seq aligner. Bioinformatics. 2013;29:15–21. 14. Voshall A, Moriyama EN. Next-generation transcriptome assembly: strategies
and performance analysis. In: Abdurakhmonov IY, editor. Bioinformatics in the Era of Post Genomics and Big Data; 2018. p. 15–36.
15. Patro R, Mount SM, Kingsford C. Sailfish enables alignment-free isoform quantification from RNA-seq reads using lightweight algorithms. Nat Biotechnol. 2014;32:462–4.
16. Patro R, Duggal G, Love MI, Irizarry RA, Kingsford C. Salmon provides fast and bias-aware quantification of transcript expression. Nat Methods. 2017; 14:417–9.
17. Bray NL, Pimentel H, Melsted P, Pachter L. Near-optimal probabilistic RNA-seq quantification. Nat Biotechnol. 2016;34:525–7.
18. Wu DC, Yao J, Ho KS, Lambowitz AM, Wilke CO. Limitation of alignment-free tools in total RNA-seq quantification. BMC Genomics. 2018;19:510. 19. Zimin AV, Marçais G, Puiu D, Roberts M, Salzberg SL, Yorke JA. The
MaSuRCA genome assembler. Bioinformatics. 2013;29:2669–77.
20. Zimin AV, Puiu D, Luo M-C, Zhu T, Koren S, Marçais G, et al. Hybrid assembly of the large and highly repetitive genome of Aegilops tauschii, a progenitor of bread wheat, with the MaSuRCA mega-reads algorithm. Genome Res. 2017;27:787–92.
21. Au KF, Sebastiano V, Afshar PT, Durruthy JD, Lee L, Williams BA, et al. Characterization of the human ESC transcriptome by hybrid sequencing. Proc Natl Acad Sci. 2013;110:E4821–30.
22. Tilgner H, Grubert F, Sharon D, Snyder MP. Defining a personal, allele-specific, and single-molecule long-read transcriptome. Proc Natl Acad Sci. 2014;111(27):9869–74.https://doi.org/10.1073/pnas.1400447111. 23. Kuosmanen A, Norri T, Mäkinen V. Evaluating approaches to find exon
chains based on long reads. Brief Bioinform. 2018;19:404–14.
24. Roberts RJ, Carneiro MO, Schatz MC. The advantages of SMRT sequencing. Genome Biol. 2013;14:405.
25. Jain M, Fiddes I, Miga KH, Olsen HE, Paten B, Akeson M. Improved data analysis for the MinION nanopore sequencer. Nat Methods. 2015;12:351–6. 26. Gordon SP, Tseng E, Salamov A, Zhang J, Meng X, Zhao Z, et al. Widespread
polycistronic transcripts in fungi revealed by single-molecule mRNA sequencing. PLoS One. 2015;10:e0132628.
27. Abdel-Ghany SE, Hamilton M, Jacobi JL, Ngam P, Devitt N, Schilkey F, et al. A survey of the sorghum transcriptome using single-molecule long reads. Nat Commun. 2016;7:11706.
28. Tardaguila M, de la Fuente L, Marti C, Pereira C, Pardo-Palacios FJ, Del Risco H, et al. SQANTI: extensive characterization of long-read transcript sequences for quality control in full-length transcriptome identification and quantification. Genome Res. 2018.https://doi.org/10.1101/gr.222976.117. 29. Wyman D, Mortazavi A. TranscriptClean: variant-aware correction of indels,
mismatches and splice junctions in long-read transcripts. Berger B, editor. Bioinformatics. 2019;35:340–2.
30. Tang AD, Soulette CM, van Baren MJ, Hart K, Hrabeta-Robinson E, Wu CJ, et al. Full-length transcript characterization of mutation in chronic lymphocytic leukemia reveals downregulation of retained introns. bioRxiv; 2018. Available from:http://biorxiv.org/lookup/doi/10.1101/410183. Accessed 6 Sept 2018.
31. Kuosmanen A, Sobih A, Rizzi R, Mäkinen V, Tomescu AI. On using longer RNA-seq reads to improve transcript prediction accuracy: proceedings of the 9th International Joint Conference on Biomedical Engineering Systems and Technologies. Rome: SCITEPRESS - Science and and Technology Publications; 2016. p. 272–7.
32. Robinson JT, Thorvaldsdóttir H, Winckler W, Guttman M, Lander ES, Getz G, et al. Integrative genomics viewer. Nat Biotechnol. 2011;29:24–6. 33. KrižanovićK, Echchiki A, Roux J,ŠikićM. Evaluation of tools for long read
RNA-seq splice-aware alignment. Bioinformatics. 2018;34:748–54. 34. Ono Y, Asai K, Hamada M. PBSIM: PacBio reads simulator—toward accurate
genome assembly. Bioinformatics. 2013;29:119–21.
35. DeBlasio D, Kim K, Kingsford C. More accurate transcript assembly via parameter advising. bioRxiv; 2019. Available from:http://biorxiv.org/lookup/ doi/10.1101/342865. Accessed 30 Apr 2019.
36. Workman RE, Tang AD, Tang PS, Jain M, Tyson JR, Zuzarte PC, et al. Nanopore native RNA sequencing of a human poly(A) transcriptome. Nat Methods. 2019.https://doi.org/10.1038/s41592-019-0617-2.
37. Lamesch P, Berardini TZ, Li D, Swarbreck D, Wilks C, Sasidharan R, et al. The Arabidopsis information resource (TAIR): improved gene annotation and new tools. Nucleic Acids Res. 2012;40:D1202–10.
38. Portwood JL, Woodhouse MR, Cannon EK, Gardiner JM, Harper LC, Schaeffer ML, et al. MaizeGDB 2018: the maize multi-genome genetics and genomics database. Nucleic Acids Res. 2019;47:D1146–54.
39. Griebel T, Zacher B, Ribeca P, Raineri E, Lacroix V, Guigó R, et al. Modelling and simulating generic RNA-Seq experiments with the flux simulator. Nucleic Acids Res. 2012;40:10073–83.
40. Kim D, Paggi JM, Park C, Bennett C, Salzberg SL. Graph-based genome alignment and genotyping with HISAT2 and HISAT-genotype. Nat Biotechnol. 2019;37:907–15.
41. Li H. Minimap2: pairwise alignment for nucleotide sequences. Bioinformatics. 2018;34:3094–100.
42. Wu TD, Watanabe CK. GMAP: a genomic mapping and alignment program for mRNA and EST sequences. Bioinformatics. 2005;21:1859–75.
43. Pertea M, Kim D, Pertea GM, Leek JT, Salzberg SL. Transcript-level expression analysis of RNA-seq experiments with HISAT, StringTie and Ballgown. Nat Protoc. 2016;11:1650–67.
44. Allam A, Kalnis P, Solovyev V. Karect: accurate correction of substitution, insertion and deletion errors for next-generation sequencing data. Bioinformatics. 2015;31:3421–8.
45. Marçais G, Yorke JA, Zimin A. QuorUM: an error corrector for Illumina reads. PLoS One. 2015;10:e0130821.
46. Kovaka S, Zimin AV, Pertea GM, Razaghi R, Salzberg SL, Pertea M: StringTie2. GitHub; 2019.https://github.com/gpertea/stringtie. Accessed 30 July 2019. 47. Lappalainen T, Sammeth M, Friedländer MR, 't Hoen PAC, Monlong J, Rivas
MA, et al. Transcriptome and genome sequencing uncovers functional variation in humans. Nature. 2013;501:506–11.
48. James AB, Syed NH, Bordage S, Marshall J, Nimmo GA, Jenkins GI, et al. Alternative splicing mediates responses of the Arabidopsis circadian clock to temperature changes [W]. Plant Cell. 2012;24:961–81.
49. Wang B, Tseng E, Regulski M, Clark TA, Hon T, Jiao Y, et al. Unveiling the complexity of the maize transcriptome by single-molecule long-read sequencing. Nat Commun. 2016;7:11708.
Publisher’s Note