Electrical Properties of NiO-GDC20
Nanocomposite Anode Supported SOFC
M.Narsimha Reddy1, P.Vijaya Bhaskar Rao2, R.K.Sharma3, S. Rajkumar4
1
Department of Physics, Gurunanak Group of Institutions Technical campus, JNTU Hyderabad, Telangana, India 2
Department of Physics, St. Mary’s Engineering College, JNTU Hyderabad, Telangana, India
3 Department of Physics, Visvesvaraya College of Engineering and Technology, JNTU Hyderabad, Telangana, India 4 Department of Physics, National Institute of Technology, Warangal, Telangana, India
Abstract: In the present work, for anode supported solid oxide fuel cell (SOFC), nano Composite Anodes were synthesized as X (NiO) +1-X (Ce0.8Gd0.2O2-δ ) where (X = 30& 40 wt. %) for low temperature operating solid oxide fuel cells. The NiO synthesized
by sol-gel citrate method. For anode materials, NiO and GDC20 nano powders were mechanically mixed and pelletized, samples were sintered at 1300oC . Systematic study of structure, purity, phase and structural parameters of as-synthesized NiO-GDC20 anode samples were carried out by XRD and SEM . A.C Conductivities at grain interior and grain boundaries were measured using complex impedance data. The A.C conductivity and their activation energies of the Anode sample (compositions X = 30& 40 wt.%) were computed from RT to 500 oC with the impedance data and the conductivities are found 1.30x10⁻³ S/cm and 2.53 x10⁻³ S/cm respectively at 500 oC (frequency 1.33MHz) . The activation energies of A.C conductivity have observed that decrease with increase in frequencies.
Keywords: SOFC, Nano Composite Anode, A.C Conductivity, Activation Energy, Impedance.
I. INTRODUCTION
Solid oxide fuel cells (SOFC) are energy conversion devices that directly convert chemical fuel to electrical energy via an electro chemical reaction [1]. In recent years, more focussed on Solid oxide fuel cells (SOFC) is to develop the intermediate or low temperature (LT/IT) SOFCs, which has the potential to reduce the cost of cell fabrication and also overcome the issues related to thermal aging and thermal mismatch within the cell components would be at its minimum.
Anodic supported SOFC’s are best candidate to operate at Low or Intermediate temperatures(LT/IT) i.e. from 773oK to 973oK, consequently improve the performance, reliability and long operational life[1-2]. The anode performance is depending on its composition and the resulting microstructure; hence it has great interest to investigate the proper composition of anode material [3]. For an anodic supported SOFC, anode must have the high electronic and ionic conductivity, catalytic activity for fuel oxidation, proper porosity at the microstructure in reduced environment at operating temperature [3-6]. In NiO–GDC (or CeO2) composite anode material, NiO acts as the best catalyst for oxygen activation and provides good electronic conductivity whereas GDC mainly act as a matrix to support the catalyst and prohibit the Ni metal from agglomeration under operating conditions and also they are an ideal match with GDC electrolyte at Operating temperatures [4]. The requirement of anode of SOFC is that, it should be electronically as well as ionically conducting. The cermet conductivity arises through two mechanisms that is ionic (through the GDC phase) and electronic (through the metal nickel phase) [7]. In the present study, as synthesized NiO nano powder by sol-gel method and Ce0.8Gd0.2O2-δ (GDC20) nano powders were mechanically mixed for homogeneous, crystalline and un-agglomerated
multi component oxide ceramic powders for anode composite.
II. EXPERIMENTAL
In the present work, NiO nano powder was prepared by sol-gel citrate method. In NiO synthesis, nickel nitrate Ni(NO3)3.6H2O (purity: 99.8%) and Citric acid were taken in suitable molar ratio . Nickel nitrate acts as an oxidiser and citric acid acts as a fuel to enable combustion reaction in sol-gel process.
The anode composites were prepared by mixing as X (NiO) + (1-X)Ce0.8Gd0.2O2-δ (where x = 30, 40 wt.%) of NiO and GDC20
The structure and surface morphology of the samples were studied by using XRD and SEM (ZEISS) respectively[9]. Impedance spectroscopy is used characterizing the electrical properties of the samples such as AC conductivity, activation energies and impedance.
[image:3.612.160.468.216.310.2]The impedance spectroscopy is an ideal and well developed tool for studying the electrical properties and to separate out the bulk (grain), grain boundary and grain-electrode contributions to the total conductivity. Impedance measurement is used to compute ac electrical conductivity and observe the explicit behaviour of the real part (Z1) and imaginary part of impedance (Z11) with the frequency. As synthesized anode compositions code sintered at 13000C is shown in table (I). Complex impedance data on anode composite samples was recorded using impedance analyzer in the range of room temperature to 500OCfrom the frequency 1Hz To 10MHz.
Table 1: Sample identification
The crystal structure, lattice parameters and crystallite size of the NiO powder and anode samples A1 and A2 determined by means of the X-ray diffraction (Phillips-3710 powder XRD) using CuKα1 radiation ( λ=1.5406Ao ) over the range 20-80o of 2θ with the scanning rate 2o/min. The relative densities of anode samples A1 and A2 are 91.8% and 94% respectively at sintering temperature 1300 oC calculated by using Archimedes method.
III.EXPERIMENTALRESULTSANDDISCUSSION
A. XRD Analysis
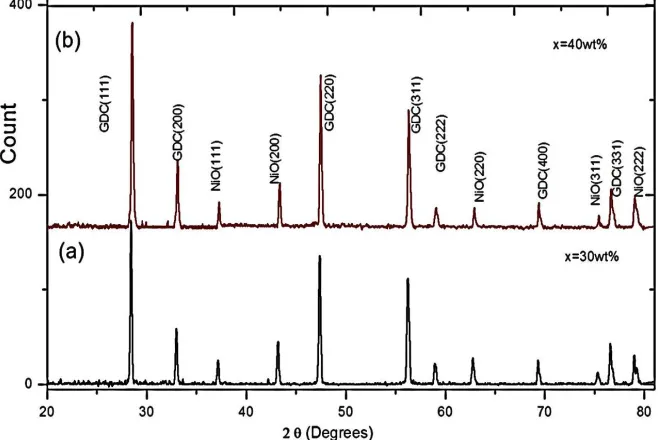
XRD patterns of NiO –GDC20 composite shown in fig.1 were compared and indexed accordingly with the standard JCPDS file no# 01-075-0162 for GDC20 and JCPDS file no.# 01-089-7130 for NiO are shown in Fig.1. It reveals that GDC has fluorite structure (Fm-3m), NiO has the cubic structure (Fm-3m group) and also the NiO –GDC20 composites A1 and A2 has the multiphase.
[image:3.612.137.466.477.697.2]
The avg. crystallite size of anode composites were calculated by using equation (1) and shown in Table 2. and observed that the NiO content increasing in anode compositions, density of the samples increasing and decrease in lattice parameters has been observed in the sintered anode composites from 1100 oC to 1300oC. Since Ni atoms are smaller than the Gadolinium (Gd) and Cerium (Ce), it occupies interstitial positions of crystal structure consequently lattice parameters of anode composites A1 to A2 slightly decreasing in NiO and GDC20 and also observed that average crystallite size of NiO has been increased more than the GDC20 with the increasing sintering temperatures.
The avg. crystallite size of the anode composites were calculated by Scherrer’s formula
[image:4.612.52.534.494.715.2]Where D is the crystallite size in nm, λis the radiation wavelength Cu Kα = 0.15406nm, θ isdiffraction angle and β is the full width half maximum.
TABLE 2: Lattice Parameters & Crystallite Size
B. Impedance Characteristics
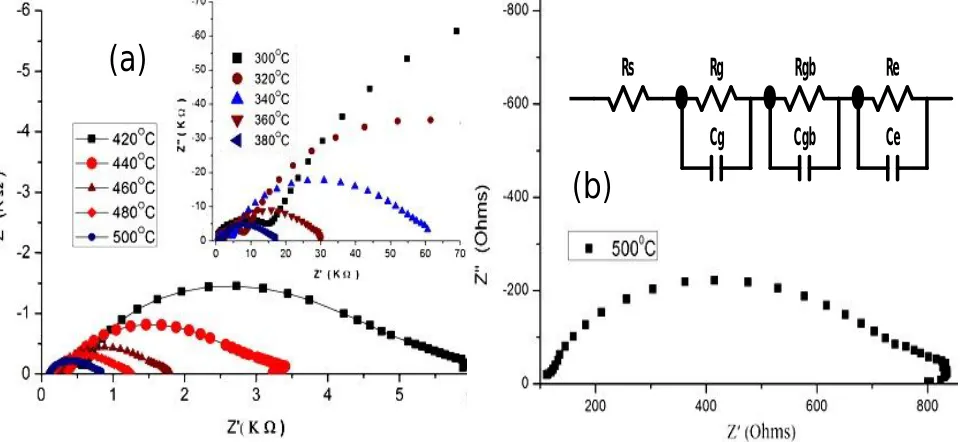
In an anode composites A1 and A2 electrical properties such as bulk electrical conduction, grain boundaries conduction and grain-electrode conduction were investigated by the complex impedance data plots with an imaginary part of impedance(Z11) as a function of the real and purely resistive part(Z1) at different temperatures ( Z1 vs. Z11). The impedance data were analysed by impedance analysis software (ZView version 3.5) which is used to find the grain interior (Rg) and grain boundary (Rgb) and electrode (Re) impedance and the values obtained from the analysis is shown in tables( 3) and (4). The display of impedance data in the complex plane that is Nyquist (Cole- Cole) plots appear in the form of a succession of semicircles attributed to the contribution of grain, grain boundary and grain –electrode interface of a material. Hence in complex impedance plane, each semicircle could represent by a single RC combination and whose centres lie on a line below the real axis.
Fig.2: Cole - Cole (Z’ vs. Z”) Plots (a) Anode A1 at different temperatures (b) Equivalent model circuit fit at 500OC.
Rs
Rg
Cg
Rgb
Cgb
Re
Ce
(a)
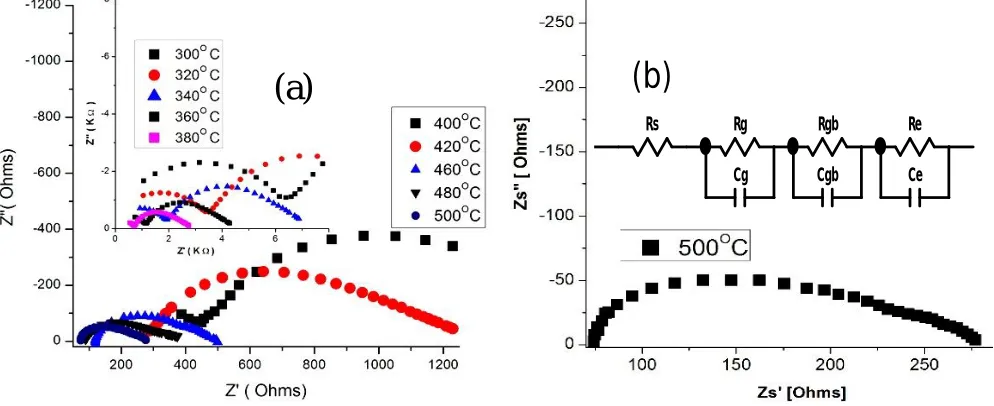
The electrical contributions of the microstructural inhomogeneity’s can be separated by assigning the values of resistive “R” and capacitance ‘C” to each of them in equivalent circuit fit from 300OC to 500OC from the model shown in the inset of the figure 3(b).At lower temperature below 280OC there is a linear response in Z11, this trend indicates the insulating behaviour in the sample. As the temperature increases above 300OC the linear response gradually changes to semicircle in nature. The single arc found in the samples A1 and A2 from 300OC to 500OC can be resolved into three semicircles, these semicircles can be represented by the equivalent three parallel RC elements which are in series shown in Fig 2(b) and 3(b) as the equivalent circuit fit. A series resistor is added to account for the high frequency intersection of the first semicircle with the Z1 axis.
Fig. 3: Cole - Cole (Z’ vs. Z”) Plots (a) Anode A2 at different temperatures. (b) Equivalent circuit fit at 500OC
[image:5.612.49.546.170.373.2]The high frequency semicircle represents the bulk (grain) property of the material arising due to the parallel combination of bulk resistance Rb and bulk capacitance Cb of the material, another semicircle in the intermediate frequency domain of the impedance spectra is due to the grain boundary effect, which is equivalent to the parallel combination of the Rgb and Cgb and at low frequency domain of the impedance spectra is due to the grain –electrode effect, which is equivalent to the parallel combination of the Re and Ce. The semicircle passes through a maximum at a frequency,f max (relaxation frequency) , the peak of the semicircle allows us to calculate relaxation times with the relation ωmaxτ = 1.
Table 3: Resistances (Rg, Rgb, Re ) and Conductivities (σg ,σgb, σe ) of Anode composite A1 Temperature
(OC )
Rg(Ω) Rgb(Ω) Re(Ω) (S/cm) (S/cm) (S/cm)
300 1.21 x10⁵
1.20x10⁵ 4.60 x10⁴ 4.43 x10⁻⁷ 4.47 x10⁻⁷ 1.20 x10⁻⁶
340 3.03 x10⁴
2.09 x10⁴ 7.32 x10³ 1.77 x10⁻⁶ 2.57 x10⁻⁶ 7.33 x10⁻⁶
380 8.57 x10³
5.30 x10³ 1.44 x10³ 6.27 x10⁻⁶ 1.01 x10⁻⁶ 3.72 x10⁻⁵
420 2.65 x10³
1.77 x10³ 6.78 x10³ 2.03 x10⁻⁵ 3.04 x10⁻⁵ 7.91 x10⁻⁵
460 8.06 x10²
5.27 x10³ 1.60 x10³ 6.66 x10⁻⁵ 1.02 x10⁻⁵ 3.36 x10⁻⁴
480 5.35 x10²
3.85 x10² 1.12 x10³ 1.00 X10⁻⁴ 1.39 x10⁻⁴ 4.81 x10⁻⁴
500 3.89 x10²
2.62 x10² 7.86 x10³ 1.38 X10⁻⁴ 2.05 x10⁻⁴ 6.83 x10⁻⁴
The conductivity across GDC (ionic) and NiO grains (electronic holes) would add different responses to impedance spectra.
The three semicircles corresponding to grain interior, grain boundary and electrode contributions appear different electrical responses due to grains of two kind NiO and GDC20 and grain contacts of three kinds GDC-NiO, GDC-GDC and NiO-NiO.
Table 4: Resistances (Rg, Rgb, Re ) and Conductivities (σg ,σgb, σe ) of Anode composite A2 Temperature
(OC )
Rg (Ω) Rgb (Ω) Re (Ω) (S/cm) (S/cm) (S/cm)
300 7.71x10³ 6.33x10³ 1.989x10³ 7.82x10⁻⁶ 9.52 x10⁻⁶ 3.03 x10⁻⁵ 340 2.19x10³ 2.13x10³ 7.62x10² 2.75x10⁻⁵ 2.83 x10⁻⁵ 7.90 x10⁻⁵ 380 1.07x10³ 7.10x10² 2.40x10² 5.60x10⁻⁵ 8.50 x10⁻⁵ 2.50 x10⁻⁴ 420 4.46x10² 3.43x10² 1.26X10² 1.35x10⁻⁴ 1.76 x10⁻⁴ 4.80 x10⁻⁴ 460 1.57x10² 1.30x10² 6.96x101 3.84X10⁻⁴ 4.65 x10⁻⁴ 8.65 x10⁻⁴ 480 1.29x10² 9.06x101 3.63x101 4.70x10⁻⁴ 6.65 x10⁻⁴ 1.66 x10⁻³ 500 1.01x10² 6.43x101 3.24x101 5.99 x10⁻⁴ 9.37 x10⁻⁴ 1.86 x10⁻³
As the temperature increases the Rgb is found to be less than Rg and Re shown in table(3), revealing that the conductive part is through grain boundary and grain –electrode contact and also grain conductance σg is found to be less than σgb .
From the equivalent circuit fit of the samples A1, found that resistances Rg, Rgb and Re are decreasing with increasing temperature from 300OC to 500OC as a result conductivities σg ,σgb, and σe increases .
It is evident from the table (3 ) that the conduction mechanism is basically dominated by grain boundary conduction through hopping electrons created due to oxygen vacancies and grain- electrode conduction through the space charges, as a result total conductivity of the samples increases mainly by grain boundary conduction and grain- electrode conduction.
[image:6.612.74.531.357.520.2]The substantial drop in the grain boundary resistance (Rgb ) with the rise in temperature and also observed that the Rgb decreases with the increase of NiO content in the ceramic shown in table( 4). This indicates the lowering of barrier at the grain boundaries for the flow of charge.
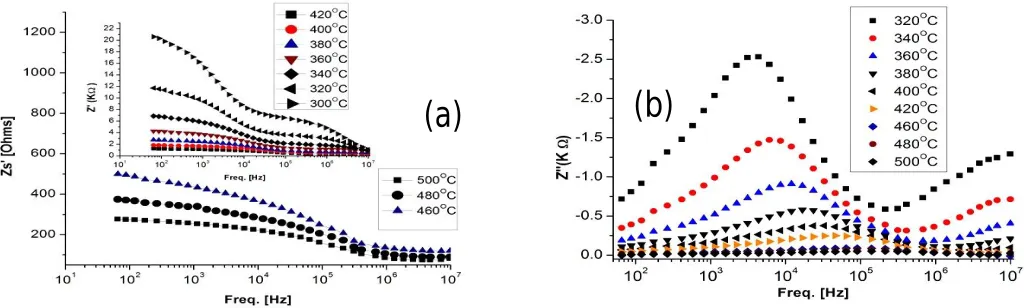
Fig. 4: Anode A1 (a) Frequency Vs. Z′ (real part) (b) Frequency Vs. Z״ ( Imaginary part).
Fig. 5: Anode A2 (a) Frequency Vs. Z′ (real part) (b) Frequency Vs. Z״ ( Imaginary part).
(a)
(b)
(a)
[image:6.612.39.551.564.718.2]As the frequency increases real part of impedance Z1 decreases and reaches minimum value with the temperature increase shown in figures 4(a) and 5(a) and merge at high frequency. As the frequency increases Z11 increases, this trend continues upto a particular frequency which Z11 occupies a maximum value is a characteristic frequency (ωmax) which is dependent on temperature, this behaviour of impedance pattern arises possibly due to the presence of space charge in the material. The peak position shifts to higher frequencies with the increasing temperature indicating multiple relaxations from the figures 4 and 5. Since the space charge polarization is reduced with increasing frequency, all the curves appear to merge at higher frequencies. The asymmetric peaks suggest that the presence of electrical processes in the composite samples with the spread of relaxation time. The relaxation time τ
can be calculated using the relation 2Πfmτ =1. The frequency peak appears from the temperature 300OC and their shifting
towards higher temperature with increase of frequency indicating thermally activated Debye type relaxation behaviour in the sample [11]. This type of relaxation process has been observed to occur at very high temperatures and can be attributed to the relaxation of hopping charged species between the adjacent neighbouring lattice sites due to the relaxation of charged defects at grain boundaries and sample-electrode interfaces. In the frequency dependence of the imaginary part of impedance (Z״ ) usually indicates the presence of space charges. The electrical behaviour of space charges also depends on the frequency.
C. Electrical conductivity
The a.c conductivity is thermally activated and frequency dependent process and hence a.c conductivities of grain , grain boundary and grain-electrode interface were calculated by the obtained resistances Rg, Rgb and Re respectively in the temperature range 300OC to 500OC and the frequencies from 1Hz to 10MHz through the equivalent circuit fit of Nyquist plots and observed that conductivities are increased with the increase of temperature and frequency.
The a.c electrical conductivity was obtained by the following relation: σac =
[image:7.612.52.534.390.534.2]Where l is the thickness, S is the surface area of the sample and Z1 = impedance on the real axis(= Rg or Rgb or Re)
Fig. 6: Arrhenius plots of (a) Anode A1 Composite (b) Anode A2 Composite .
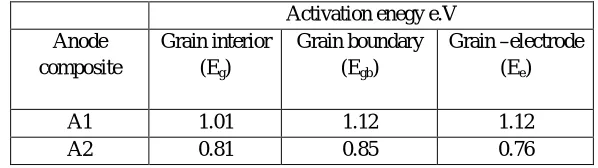
The activation energies of grain, grain boundary and grain-electrode of anode composites A1 and A2 were calculated from the slope of the Arrhenius plots by linear fit shown in Fig.6. The measured a.c activation energies of grain ( Eg) , grain boundary ( Egb) and electrode (Ee) of anode composite A1 and A2 shown in the table (4) and observed that activation energies of A2 decreases due to the NiO content increase .
Table 4 : Activation Energies of A1 and A2 from Equivalent Circuit Fit Activation enegy e.V
Anode composite
Grain interior (Eg)
Grain boundary (Egb)
Grain –electrode (Ee)
A1 1.01 1.12 1.12
[image:7.612.155.454.649.733.2]It is observed that in the anode A1, the activation energy for conduction at grain boundary and electrode – sample interface is higher than that of grain conduction activation energy. The main reason for the less ionic conductivity in the grain boundary layer is due to the high migration energy required for conduction across grain boundaries due to the less ordered ionic arrangement in the boundary layers causing very irregular coulombic potentials, which hinders the migration of charged species across the grain boundaries and also because excess energy required to liberate the conducting species which are trapped by the defects present across the grain boundary is the less ionic conductivity at sample-electrode interface compared to grain boundary and grain conductivity may be due to the trapping of charge carriers by defects present at the sample-electrode interfaces. The variation of real part of a.c conductivity ) with the 0K is shown in fig.7 at different frequencies. The nature of variation shows almost linear over wide range temperatures obeys the Arrhenius relation.
= σ0 exp ( ) --- (2) Where is the activation energy of conduction.
Fig.7: Arrhenius plots of A.C conductivity ( a) A1 (x=30 wt.%) (b) A2 (x=40wt.%)
The activation energies (Ea)were estimated using Arrhenius plots by linear fitting from 10Hz to 5MHz frequencies at temperature above 3200C (which may be the intrinsic region) and the values are tabulated in table V. At lower temperatures, the complexes formed are immobile ions and doesn’t contribute much to the conductivity. As the temperature increases, impurity-defect complexes start to dissociate there by contributing to conductivity.
The activation energy for total conduction of samples comes from three sources that is the enthalpy of migration of oxygen ions
(ΔHm),the association enthalpy of complex defects( ΔHa ) and the activation energy for the grain boundary conduction . But in the
low temperature range (<4000c) these three sources simultaneously limit the total conductivity.
For low NiO content, NiO is distinctly distributed throughout the composite and NiO, GDC connectivity is poor. Hence ionic conductivity is dominated over the electronic, but the activation energy less than 1eV implies that NiO contributed to the electronic conductivity, for further NiO additions, NiO and GDC are homogeneously distributed thereby forming three dimensional connectivity and the activation energies are decreased with increase in frequency.
TABLE: 5 Activation Energies in Total AC Conductivity Frequency
(Hz)
Activation Energy (Ea ) (eV ) Anode A1 (x=30wt. %)
(320 to 5000C)
Anode A1 (x=30wt. %) (320 to 5000C)
100 1.16 0.82
578 1.09 0.80
1.1K 1.02 0.78
90K 0.76 0.74
250K 0.80 0.76
484K 0.84 0.77
950K 0.90 0.78
1.33M 0.88 0.76
3.6M 0.86 0.71
5.0 M 0.85 0.68
With increasing temperature, the grain boundary effect and the association enthalpy of complex defects gradually disappears, as a
result only the enthalpy of migration of oxygen ions (ΔHm) plays a major role in limiting the total electrical conductivity and thus the
activation energy at higher temperatures could be smaller.
The total a.c conductivity of anode composites A1 and A2 are obtained 1.853x10⁻³ S/cm and 2.69 x10⁻³ S/cm respectively at 500 oC ( at frequency 5 MHz) and observed that a.c conductivity is increasing with the increasing variation of NiO in the Anode composites and the conclusion of conductivity remain the optimum variation of NiO in the analysis of further research which may decisive of suitable anode composite for anode supported SOFC’s .
IV.CONCLUSION
The anode composites A1 and A2 crystallite sizes of NiO and GDC20 are increasing with temperature and variation of NiO and subsequently density increased . The complex impedance analysis is used to study extensively the anode composites with the effective variation of NiO. The substantial drop in the grain boundary resistance (Rgb ) and sample-electrode resistance with the rise in temperature and also observed that the Rgb and Re decreases with the increase of NiO content in the ceramic. This indicates the lowering of barrier at the grain boundaries for the flow of charge. The total A.C Conductivities of samples A1 and A2 are obtained 1.8530x10⁻³ S/cm and 2.69 x10⁻³ S/cm respectively at 500 oC and the activation energies of anode A1 and A2 are 0.85 and 0.68 eV at 5MHz.
V. ACKNOWLEDGMENTS
The authors are thankful to the Department of Physics O.U Hyderabad and Department of Metallurgical Engineering and Material science, IIT Bombay for providing central-facility for Broad band dielectric spectrometer experimental support.
REFERENCES [1] B.C.H Steele, Solid State Ionics 129(2000)95.
[2] A.U.Chavan, et.al, Effect of variation of NiO on properties of NiO/GDC Nano composite, Ceremic.Int.(2012), doi:10.1016/j.ceramint . 2011.12.023 [3] Shaow zha, William Rauch, Ni - Ce0.9Gd0.1O1.95 anode for GDC electrolyte based low temperature SOFCs Solid state Ionics 166(2004) 241-250.
[4] J.Chrstopher , M.P.Sridhar Kumar ,C.s Swamy Thermal studies on high temperature oxidation behavior of Ni containing Ab, type inter metallics Thermochemical Acta 161(1990)207-205.
[5] C. Ding H.lin K.Sato Improvement of electro chemical performance of anode supported SOFCs by NiO-Ce0.9Gd0.1O1.95 solid state Ionics 181(2010)1238-1243
[6] R.V Wandekar , M.Ali, B.N. Wani, S.R Bharadwaj, Physiochemical studies of NiO-GDC composites, Material Chemistry and Physics 99(2006)289-294. [7] M.Narsimha Reddy,P.Vijaya Bhaskar Rao, and R.K.Sharma, Synthesis, characterization and mechanical properties of NiO - GDC20 Nano composite anode
for solid oxide fuel cells; AIP Conf. Proc. 1728, 020634-1–020634-5; doi: 10.1063/1.4946685.
[8] H.A Taroco, J.A.F.santos.R.z.Domingues, T.Matencio, ceramic materials for solid oxide fuel cells ,advances in Ceramics-synthesis and characterization, processing and specific applications (2011)423-446}.
[9] M.Narsimha Reddy, P.Vijaya Bhaskar Rao, R.K.Sharma, S. Rajkumar, Structural, Morphological and Electrical Properties of NiO –GDC20 Nano composite Anode for SOFC, International Journal of Innovative Research in Science, Engineering and Technology ,Vol. 6,issue 10( 2017) 20950- 20957 doi :10.15680/IJIRSET.2017.0610201
[10] L.D.Jadhav, M.G.Chourashiya, A.P.Jamale, A.U.Chavan and S.P.Patil ,synthesis and characterization of nano-crystalline Ce1-xGdxO2-x/2 Solid solutions,Journal
of Alloys and Compounds,vol.506,no.2,pp.739-744,2010.
[11] K.Srinivas, P . Sarah and S.V .Suryanarayana, Impedance spectroscopy study of polycrystalline Bi6Fe2Ti3O18,Bull.Mater.sci.Vol 26(2003) pp.247-253
[12] A.K. Jonscher, Nature 253 (1975) 717.