Industrial Paint Defect Inspection and Detection
Based On Artificial Intelligence and Computer
Vision
Maheshwar Airsang1, Naveen Kumar. G.N2
1
M.Tech student, 2Assistant Professor, Department of Electronics & Communication Engineering CMRIT Bengaluru 560037, Karnataka, India
Abstract: Here the idea is to make automation of paint defect scanning and detection in the industries where automatic paint process will be done on vehicles. With the manual inspection we cannot achieve good time management and quality of product. The SIFT features are extracted and used to train the Supervised Machine Learning algorithm called SVM, the features of both defected and non-defected images are written in an excel sheet as array of data and are labelled as 1 and -1 respectively. This project is trained to identify the defects like air bubble, paint drop and extra paint on the vehicle surface. The SIFT features are very use full for identification of objects in the images and to compare two images by examining the features, the system will get trained by both image features which are labelled to differentiate between defective and non-defective images. Once the SVM is trained then we can build a classifier model which will classify or identifies defects on images. The Python programming language is used and necessary libraries packages are installed to get done this project. The experimental results are obtained by providing the two defective and two non-defective images to the classifier model, where the output can viewed on Pycharm screen.
I. INTRODUCTION
Many car, bus and vehicle industrial sector in which end products are coated with different paints coats. The industry should ensure high quality control of their product, this is critical in automotive industry.
The painting process is done automatically, while product is in movement passing through different steps. Paint coats are done by spraying under controlled temperature, humidity and air speed. The paint defects appear because of person mistake or temperature variation etc. and defect shows up at the present coat layer.
The defects are more visible at the end of process as other paint layers are repeatedly applied on. It is very important to detect the defects when they appear in present layer in order to reduce the paint cost and energy.
If defects are not detected before vehicle reaches final step of production, then cost of repairing would be high and customer satisfaction is very important as well as image of the company, after final coating if there is any paint bubble etc. then it requires repairing steps like, removing paint defect, polishing surrounding area, putti filling and polishing rough surface then at final painting id done, these many steps are required to correct the paint defect after the final step of product.
Instead of this if we found paint defect early coat then correcting of defect would be very cheaper as compared to end product. This project presents design and implementation of automatic paint defect detection system based on computer vision and machine learning concept. In this approach first system should get trained to identify the defected images, to train the system, image features are extracted from defected images and to identify non-defective image the non-defective image features are extracted and both image features are written in a excel sheet. Now the excel sheet will be having both image features, each feature have 128 values means 128 columns in excel sheet, the number of features is depends on images an image may contain only one or two features and other image may contain hundreds of features, both image features are in same excel sheet so to differentiate each other the index labelling is done for defected and non-defected features as 1 and -1 respectively. The machine learning algorithm uses this excel sheet feature values and based on index the algorithm will work.
At this stage the system will be trained as it can know or analyse the defected image feature and non-defected image features, next one model is created called classifier to this model trained system file will be included.
We can provide as many as input images to the classifier model to identify paint defected images. If there is no defect in the input image then classifier will show negative result, for defected image it will show positive result. Based on the input image features the classifier model will give the appropriate results.
II. IMPLEMENTAION
A. Software requirement
1) Python: Python is a programming language which is used for general purpose programming, the Guido Van Rossm is a creator of python language. The code readability is very easy and understandable, programmers can write syntax in very less code as compared to C++ or Java. Also python supports for object oriented and functional programming, and it is manages memory automatically. Python contains large standard libraries, garbage collector for memory management and another good feature of python is name resolution, while program execution it will bind the method and variable names.
2) Pycharm: Pycharm is Integrated Development Environment (IDE) used for computer python programming. Its features are code analysis, graphical developer, integrated unit tester and also supports for web development. Pycharm can also suitable for MacOS, Linux versions, and syntax error handling, quick fixes, project and code navigation, easy jump between files.
3) Numpy mkl: Numpy is a package used for all purpose array operations, it is designed purposely for manipulate large multi-dimensional array, it helps to achieve speed of large array works. Numpy created on the numeric code base, and has ability to create array of arbitrary type.
4) Scipy: Scipy is a python library which will help to scientific and technical operations, it contains many modules as optimization, linear algebra, integration, interpolation, special functions, FFT, signals and image processing functions. The scipy comes on the top of the numpy array, any how it is part of numpy stack. It includes some tools like matplotlib, pandas and sympy and even we can expand some scientific computing libraries.
5) Open-CV contrib python: Open-CV contrib, these are the modules contributes the functionality to the python platform. These modules will not come with python because new modules do not have stable operation and they may not well tested, therefore they release as a part of Open-CV extensions. And it try to give correct functionality. When the Open-CV contrib becomes popular then it will moved to open-cv repository. In this project open-cv contrib is used for SIFT (Scale-Invariant Feature Transform) feature functionality.
6) Xlrd: This is another python package which is used in project, this package is used for Excel files andit will read or write the Excel file. These are fast reliable and simple.
III.METHODOLOGY
A. Supervised machine learning system
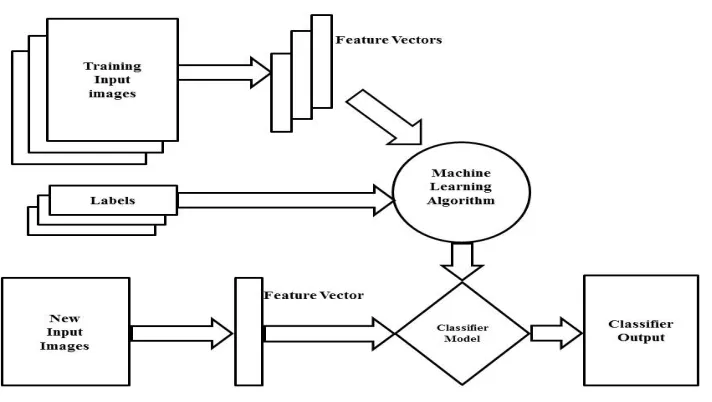
The below block diagram shows a supervised machine learning system. Machine learning can successfully used to improve the efficiency of systems and the designs of machines. The machine learning algorithms uses the same set of dataset features. The features like continuous, discrete or binary are fed to the system. If some inputs are given with correct labels then the system is called supervised, in other side unsupervised learning, where inputs are unlabelled. Machine learning is the action of learning a set of information from inputs, or as normally speaking, creating a classifier that can be used as generalized solution for new input. The selection of which accurate learning algorithm we should use is a difficult step. The classifier’s calculation is most often depends on prediction theory. Three types of techniques which are used to calculate a classifier’s accuracy, the first is used to split the training set by using two-thirds for training and the other third for evaluating performance of classifier. The second technique is used to cross-validation, the training data set is divided into mutually separation and equal-sized subsets and for each data subset the classifier is trained on the base of all the other subsets. The error rate average of each subset will estimate the error rate of the classifier. If the error rate estimation is not as expected, we must return back to a previous stage of the supervised Machine Learning process.
Figure 1: Block diagram
1) Feature Vector: Some objects are represent in terms of features which are stored in multi- dimensional vector, is used in pattern recognition and machine learning. Numerical representation of objects is very important to many algorithms in machine learning, it helps in processing and statistical analysis. When performing images operation, the feature values maybe correspond to the pixels values of an image, and when performing text operation the features maybe frequency of occurrence text terms. Combining feature vectors with weights by dot product to build a linear predictor function which is used to get a score for determining a prediction. We can acquire higher level feature from already available features and those are added to the vector. By using set of constructive operators we can get feature construction to a set of existing features, it will result into construction of new features.
2) SIFT Feature: The SIFT (Scale Invariant Feature Transform) algorithm will converts an image into set of local feature vectors. All of these feature vectors is supposed to be unique and never changing to any scaling, rotation or information of the image. In the main implementation, these features are used to find unique objects in different images and the algorithm can be used to match faces which are in the images. SIFT descriptor is calculated from the image intensities around required position in the image area which can be treated as required points, other option key points. These required points are taken from scale-space of differences of Gaussians (DoG) within a difference of Gaussians pyramid. A Gaussian pyramid is built from the given input image by iterated smoothing and subsampling, and a difference of Gaussians pyramid is calculated from the dissimilar between the adjacent levels of the Gaussian pyramid. Then, required points are taken from the points at which the difference of Gaussians values assumes with respect to both the spatial coordinates in the image domain and the scale level in the pyramid. 3) Machine Learning SVM: Machine Learning is known as a field of Artificial Intelligence (AI) and it is related with the
generation of techniques and procedure which allow the system to learn. In easy terms development of methods which allows the machine to learn and accomplish tasks and functions. Support vector machines (SVMs) is a group of supervised learning algorithms used for categorizing and regression, they belong to group of generalized linear classifiers. In different terms, Support Vector Machine is a categorization and regression prediction algorithm that uses machine learning principles to enlarge predictive precise while autonomously rejecting over fit to the data.
IV.ANALYSISANDRESULTS
A. Feature extraction of training images
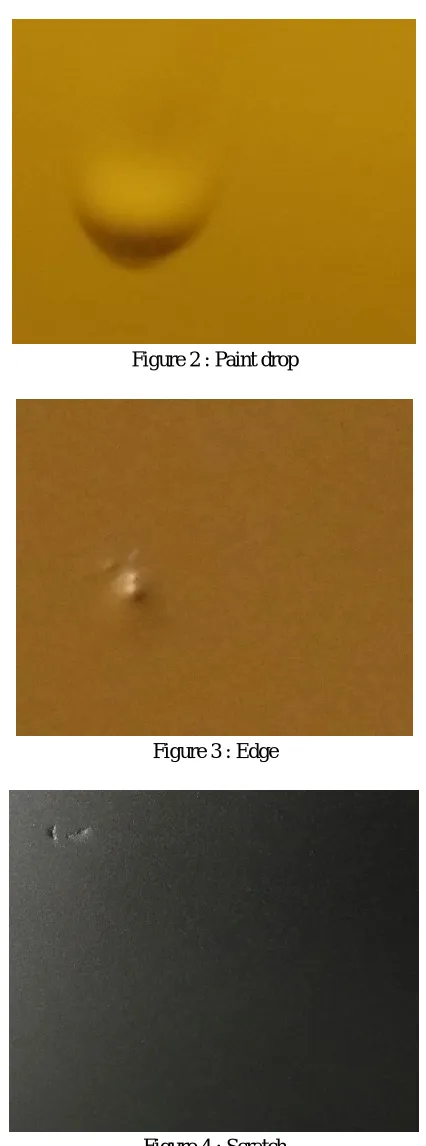
and good as it will boosts the system accuracy. The defects may vary or defects are different from one industry to other industry, it is depends on industry environment, temperature, and the awareness of employee. In this project concentration is on some defects like paint bubble, extra paint etc.
Figure 2 : Paint drop
Figure 3 : Edge
Figure 4 : Scratch
Workbook (File name)” and file name will be mentioned in the code only, if we want we can change the file name. Now excel file is created but we have to create worksheet by command “worksheet = workbook. add_ worksheet ()”.
To read the images from their folder, we have provide folder name as “image names = [line. rstrip
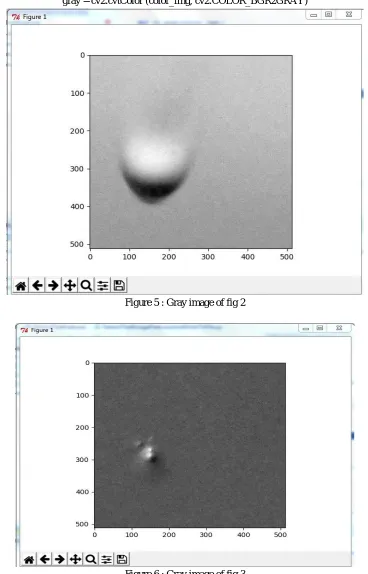
('\n') for line in open(trainConfig. filename)]” the filename is a text file which contains input images name and their format. Next we will convert RGB images into Gray images, by command
“gray = cv2.cvtColor (color_img, cv2.COLOR_BGR2GRAY)”
[image:6.612.121.489.147.721.2]Figure 5 : Gray image of fig 2
Figure 7 : Gray image of fig 4
All the above figures are Gray images of input training images, the RGB images have many color ranges in the image so it is complicated to process as compared to the gray level image, and it contains only gray scale range. Therefore we convert RGB images to gray images. Now the next step is extraction of SIFT features from the sample images, and is done by using command “octo_front_desc = gen_sift_features (octo_front_gray)” at this stage the image features are generated, now using command “np.vstack” we will make a stack or an array of image features.
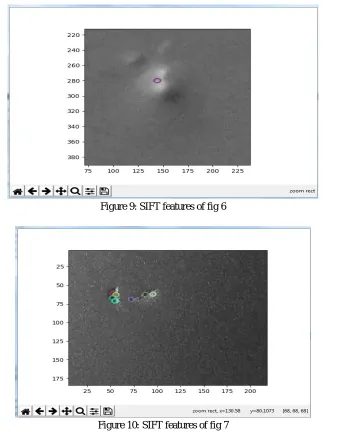
[image:7.612.142.467.440.714.2]Figure 9: SIFT features of fig 6
Figure 10: SIFT features of fig 7
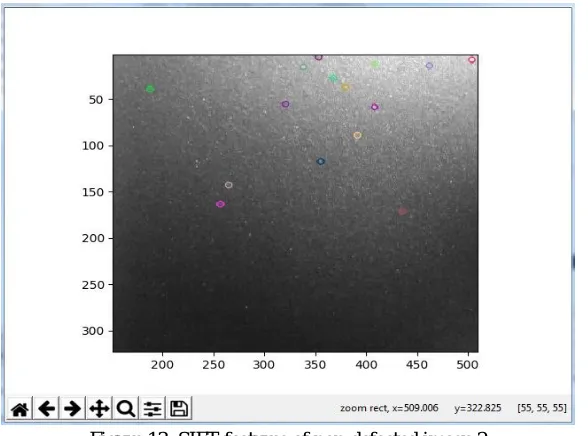
As we discussed the number of SIFT features are vary as compared to one image to other image, this can be observed in the above images, the features are look like circles.
The number Total numbers of features are 10, and these features are stored in Pycharm as shown in below figure.
Figure 12 SIFT features in Excel sheet
Till now we have performed operation on defected input images, and similar operation is performed on the non-defected input images, here also we will take gray images and SITF features of non-defected images and will create an array of features. Now we will see SIFT feature images of non-defected images directly.
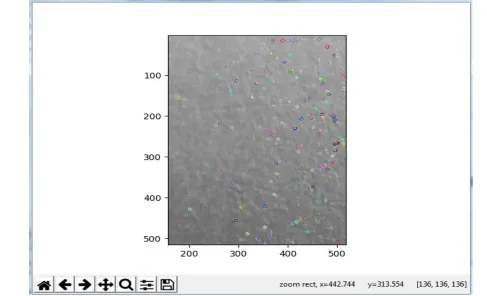
[image:9.612.55.542.427.723.2]Figure 13: SIFT features of non-defected image 2
Till here we prepared our data and trained the system by giving this data as input to the machine learning SVM. After running the SVM classifier we will get file “SVMclf.pkl” this file later imported in our classifier model.
B. Classifier model
The classifier model is brain of this project where it uses the data base which is there in the excel sheet. After extracting the SIFT features of both defected and non-defected images and while writing excel sheet we will assign labels to each features of both images. Now we open excel file by command “workbook = xlrd. open_ workbook(File name)” and to open the excel sheet this command is used “worksheet = workbook. sheet_by_index(0)”, creating a for loop to read each line of excel sheet is by “x = np. append(x, worksheet. cell (row, col).value)”. “SVMclf = joblib.load('SVMclf.pkl')” this command is used to analyse trained system, according to the data set training the classifier decides whether defect is present or not.The prediction is done based on the labels which we provide for each feature, the label 1 is used for defected image features and label -1 is used for non-defected image features. These labels are appended at last column of excel sheet which is 129th column.
Figure 14 Defected and non-defected image output
[image:10.612.53.486.474.674.2]successfully showing the correct output on the screen as we can see in the figure 14 two images are defected and other two are non-defected.
V. CONCLUSION
The product quality is very important as it directly affects the image of a company and customer satisfaction. In vehicle automatic paint process many paint defects will appears as air bubble, extra paint on the surface and paint drop. To detect the defects manual process will require more time to identify the defects and if at the end stage there is a defect then it will cost more to repair it as compared to previous stage repair, means after single coat of paint if defect is detected then it can be fixed before next paint coat is applied. So it is very good idea to reduce cost and time consumption. In bigger industries these manual repairs will consume around one month of time, so if do automatic paint defect detection product quality will also improve, to achieve this Machine Learning concept and computer vision is used and they have given best results as expected. The classifier model was built and tested success fully with new input images of both defective and non-defective and the output results are verified and got the best result as shown in the classifier output screen.
REFERENCES
[1] Leopoldo Armesto, Josep Tornero, Alvaro Herraer “Inspection system based on artificial vision for paint defect detection on car bodies” IEEE conference. [2] Parisa Kamani. Elaheh Noursadeghi “Automatic paint defect detection and classification of car body” IEEE conference.
[3] Valentin Borsu, Arjun Yogeswaran, Pierre Payeur “Automated surface deformations body panels” IEEE conference on auotomation Andreas, Rudolf Kruse “Classification of surface defects for quality control” IEEE conference Wall center hotel, Canada.
[4] Yun chan chung, Minho chang “Visualization of subtle defects of car body panels” SICE-ICASE International conference, Korea.
[5] A.Andersson “Evaluation and visualization of surface defects a numerical and experimental study on sheet metal parts” American Institute of Physics. [6] F.Puente, S.Kammel “Inspection of specular and painted surface with centralized fusion techniques” Germany.
[7] C.Boukouvalas, J.Kittler, R.Marik “Ceramic tile inspection for color and structural defects” University of Surrey. [8] science and engineering, Canada.