Gene expression response in target organ and whole blood varies as
a function of target organ injury phenotype
Edward K Lobenhofer
*
, J Todd Auman
†§§
, Pamela E Blackshear
‡
,
Gary A Boorman
§
, Pierre R Bushel
¶
, Michael L Cunningham
§
,
Jennifer M Fostel
¥#
, Kevin Gerrish
†
, Alexandra N Heinloth
†
,
Richard D Irwin
§
, David E Malarkey
**
, B Alex Merrick
#
, Stella O Sieber
†
,
Charles J Tucker
†
, Sandra M Ward
**
, Ralph E Wilson
**
, Patrick Hurban
*
,
Raymond W Tennant
¤
††
and Richard S Paules
¤
‡‡
Addresses: *Cogenics, a Division of Clinical Data, Inc., Morrisville, NC 27560, USA. †NIEHS Microarray Group, National Institute of
Environmental Health Sciences, National Institutes of Health, Research Triangle Park, NC 27709, USA. ‡Integrated Laboratory Systems, Inc.,
Research Triangle Park, NC 27709, USA. §National Toxicology Program, National Institute of Environmental Health Sciences, National
Institutes of Health, Research Triangle Park, NC 27709, USA. ¶Biostatistics Branch, National Institute of Environmental Health Sciences,
National Institutes of Health, Research Triangle Park, NC 27709, USA. ¥National Center for Toxicogenomics, National Institute of
Environmental Health Sciences, National Institutes of Health, Research Triangle Park, NC 27709, USA. #Laboratory of Respiratory Biology,
National Institute of Environmental Health Sciences, National Institutes of Health, Research Triangle Park, NC 27709, USA. **Laboratory of
Experimental Pathology, National Institute of Environmental Health Sciences, National Institutes of Health, Research Triangle Park, NC 27709, USA. ††Cancer Biology Group, National Institute of Environmental Health Sciences, National Institutes of Health, Research Triangle
Park, NC 27709, USA. ‡‡Environmental Stress and Cancer Group, National Institute of Environmental Health Sciences, National Institutes of
Health, Research Triangle Park, NC 27709. §§Current address: Institute for Pharmacogenomics and Individualized Therapy, University of North
Carolina at Chapel Hill, Chapel Hill, NC 27599, USA.
¤ These authors contributed equally to this work.
Correspondence: Edward K Lobenhofer. Email: [email protected]. Richard S Paules. Email: [email protected]
© 2008 Lobenhofer et al.; licensee BioMed Central Ltd.
This is an open access article distributed under the terms of the Creative Commons Attribution License (http://creativecommons.org/licenses/by/2.0), which permits unrestricted use, distribution, and reproduction in any medium, provided the original work is properly cited.
Hepatotoxin responses
<p>Histopathology, clinical chemistry, hematology and gene expression data were collected from the rat liver and blood after treatment with eight known hepatotoxins.</p>
Abstract
This report details the standardized experimental design and the different data streams that were collected (histopathology, clinical chemistry, hematology and gene expression from the target tissue (liver) and a bio-available tissue (blood)) after treatment with eight known hepatotoxicants (at multiple time points and doses with multiple biological replicates). The results of the study demonstrate the classification of histopathological differences, likely reflecting differences in mechanisms of cell-specific toxicity, using either liver tissue or blood transcriptomic data. Published: 20 June 2008
Genome Biology 2008, 9:R100 (doi:10.1186/gb-2008-9-6-r100)
Received: 16 December 2007 Revised: 28 February 2008 Accepted: 20 June 2008 The electronic version of this article is the complete one and can be
Background
The use of genomic approaches to better understand the adverse effects of environmental and xenobiotic exposures on human injury and disease processes engendered a great deal of early enthusiasm and excitement. This research initially focused on using gene expression alterations as measured by microarray analyses and is often referred to as 'toxicogenom-ics' [1]. Quite early on, investigators were able to demonstrate that exposure to different toxicants could be discriminated or classified in rodent model systems by microarray profiling of gene expression alterations in the target tissues, that is, tis-sues that display visible adverse effects in response to toxi-cant exposure [2-5].
Gene expression microarrays have developed over the past decade into a powerful tool for investigating biological, mech-anistic, and disease processes in addition to developing genomic classifiers. Recent standardization efforts by the Microarray Quality Control Consortium, the Toxicogenomics Resource Consortium as well as other groups have clearly demonstrated the reproducibility of transcript level data gen-erated using these approaches [6-9]. However, in most instances these studies have understandably been based on reference samples with little or no biological significance. The Microarray Quality Control Consortium did substantiate their findings by performing a cross-platform study using samples from a multi-agent rat toxicogenomics study at a sin-gle dose and time point and the Toxicogenomics Resource Consortium did perform a cross-laboratory, time course assessment using samples from a single toxic agent [10,11]. However, there are still open questions regarding the utility and applicability of the microarray technology in biological research and in particular with respect to understanding and classifying injury processes that arise as a consequence of exposures to various agents. For example, can gene expres-sion data distinguish similar biological responses that occur in different physiological regions within an organ (for exam-ple, necrosis within different zones of the liver lobule) or sim-ilar lesions that are the result of exposure to different compounds?
Linking gene expression changes with more traditional toxi-cological measurements of adverse biological responses to toxicants (for example, histopathology and clinical chemis-try), referred to as 'phenotypic anchoring', allowed investiga-tors to gain new insight into the processes involved in the adverse effects on target tissues [12-15]. In addition to analy-sis of target tissues, the use of whole blood as a tissue source for gene expression profiling is extremely appealing and already has been demonstrated for a variety of diseases and exposures [16-22]. This has tremendous potential in a thera-peutic setting - the use of blood as a surrogate for the primary tissue of interest greatly facilitates sample collection and analysis. The benefits would be realized in basic research studies as well. If transcript data in whole blood can function as a surrogate for the target organ, a researcher would be able
to collect serial time points from an animal as opposed to har-vesting tissue at a single time point after sacrifice. This would not only decrease the number of animals being used in a study, but would increase the amount and value of the data generated from a single animal as early transcriptional events could be phenotypically anchored to histopathological obser-vations or clinical chemistry data that were not observed until later time points within the same animal. The amount of total RNA required to perform microarray-based gene expression profiling from whole blood continues to decrease, thereby increasing the potential for practical applications. Thus, one question of interest is whether expression data from whole blood can serve as a surrogate for a target organ through either an ability to detect the same transcript changes or an ability to identify different transcript biomarkers with similar or enhanced classification utility.
While much progress has been made in the application of tox-icogenomics to the classification of toxicants and the investi-gation of mechanisms of toxicity, a full realization of its potential in a systems biology context, sometimes referred to as 'systems toxicology' [23], has yet to be accomplished. A pri-mary obstacle has been the lack of truly robust data sets that capture not only genome-wide gene expression measure-ments but also traditional biological and toxicological infor-mation associated with exposures that vary over dose and time. This need was recently highlighted in the National Research Council's report on toxicogenomics [24]. Here we present a comprehensive, public dataset of gene expression and accompanying data (histopathology, clinical chemistry, hematology) from a standardized study to serve as a resource to further advance the development of systems toxicology. The present report details the experimental design and the different data that were collected, and provides examples of how these data can be used to address important biological questions. This investigation of eight known hepatotoxicants was designed to evoke acute liver injury with similarities as well as differences in the type and location of injury that result.
not as well understood but is thought to be associated with depletion of UTP caused by the conversion of galactosamine to UDP-hexosamines and UDP-N-acetylhexosamines [31].
The work was performed in its entirety using standardized procedures for the in-life work and for the generation of gene expression microarray data (n = 1,704 hybridizations). Doses that ranged from 'sub-toxic' to 'toxic' exposures were selected. Additionally, gene expression profiling was performed on two commercially available platforms (Agilent and Affymetrix) for one of the tissues (liver), thereby providing an opportunity to corroborate findings across platforms. In-life observations were recorded and clinical chemistry, hematology, and liver histopathology were also assessed for all 426 animals. These additional data facilitate the phenotypic anchoring of the gene expression data and confirm that the goal of the study to evoke different types of liver injury was achieved. Gene expression levels in whole blood were also assayed to evaluate whether biomarkers of different types of liver damage could be identified in this readily accessible bio-fluid.
The analyses presented here further demonstrate the utility of using microarrays as a tool for gene expression profiling to address biological questions. Specifically, this experiment was designed to provide a means to generate mechanistic and predictive measures of toxicity by integrating multiple data streams that were recorded within this standardized study. These model chemical exposure studies also provide a com-prehensive data set with a well defined phenotypic anchor (liver injury) that is needed to assess the utility of gene expression profiling from whole blood samples. These data can now serve as a rich resource to the scientific community to test and validate these as well as other hypotheses, and have been made freely available in a public repository [32-34]. While the experimental design is based on a common model for toxicogenomics studies, the findings and/or the results of mining these data can be applied to other fields using microarrays as a research tool.
Results and discussion
Experimental design
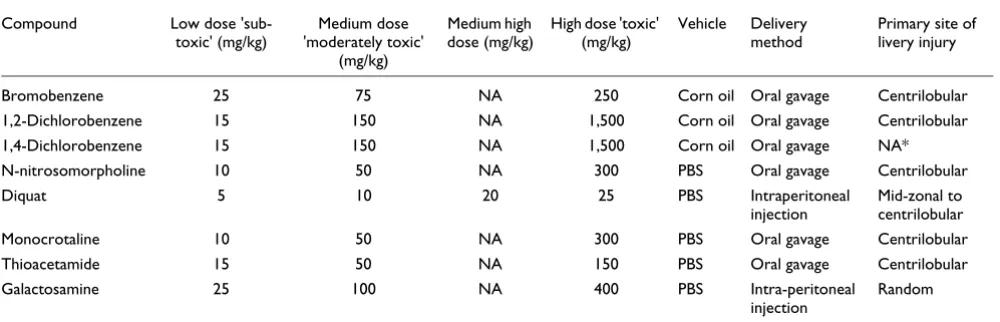
The motivation for this study was the need for a rich, public dataset consisting of multiple types of data (gene expression, histopathology, and so on) that could be interrogated to test hypotheses regarding the application of gene expression pro-filing data generated from microarrays. We therefore designed a study with multiple compounds (n = 8) that would induce a common phenotype (liver injury), while also differ-ing in the extent and/or severity of the injury and/or the co-occurrence of other noted histopathological observations, such as the type of inflammatory cell infiltrates, the presence of bile duct hyperplasia, and so on (Table 1). The selected compounds are acute hepatotoxicants, requiring only a single administration at a suitable dose to elicit a toxic response. All eight compounds are rapidly absorbed from the
gastrointesti-nal tract following administration, but are not direct acting in that they require biotransformation to toxic-reactive interme-diates within the liver. From a preliminary dose finding study, three doses were selected corresponding to a 'sub-toxic', 'moderately toxic' and 'toxic' dose for each compound (Table 2). Separate groups of four to six animals were treated with compound at each of these doses or with a vehicle control at time 0, and then sacrificed either 6, 24, or 48 hours later. Blood and liver were harvested at the time of sacrifice for clin-ical chemistry, hematology, histopathology and gene expres-sion profiling using standardized procedures across all compounds. Additional data file 1 details all of the measure-ments that were collected, except the gene expression profil-ing data, for all of the animals in this study. All data, includprofil-ing the gene expression data, are available through a publicly accessible website [34].
The expected result of exposure to both the moderately toxic and toxic doses of these compounds (except for 1,4-dichlo-robenzene) was necrosis within the liver lobule. For most compounds it was expected that the necrosis would be local-ized to the centrilobular region, whereas with diquat the dam-age was expected to extend into the midzonal region, and with galactosamine it was expected to be randomly distributed throughout the liver. The histopathology data confirmed these expectations; however, some individual animal varia-bility was observed (Table 1 and Additional data file 1). Vari-ability in the evoked phenotypic response is commonly observed in these types of in-life studies, despite conducting the experiments in an in-bred population using highly stand-ardized procedures. Although such variability can be confounding when the data are analyzed using dose, time, and compound to organize groups, here we consider this var-iability to be an asset in that it provided an opportunity to examine molecular responses and mechanisms not only according to the mode of action of the included compounds, but also according to the severity and character of the response irrespective of inducing compound. Furthermore, this variability in response provides an opportunity to iden-tify biomarkers that correlate with hyper- and hyposensitivity in individual animals.
Compound-specific responses
Previous work has demonstrated that toxicants can be classi-fied using gene expression data derived from the primary tar-get tissue [2,3,35,36]. The compounds in this study were chosen based on their ability to induce acute hepatotoxicity and the similarities and differences in the type and location of the damage resulting from exposure. Since the compounds in this study are acute hepatotoxicants resulting in hepatocyte necrosis, we wanted to corroborate these findings with chem-icals that could be considered closely related based on the damage they evoke.
ani-mals in each group (the additional dose for diquat was omit-ted from these analyses). A support vector machine (SVM) approach was used to identify compound-specific classifiers within each dose/time group for each tissue type (blood and liver). The resulting classifiers (Additional data file 2) were then used to group samples based on principal component analyses and hierarchical clustering to determine whether or not the classifiers functioned well at separating all of the ani-mals within a dose/time group into different compound groups.
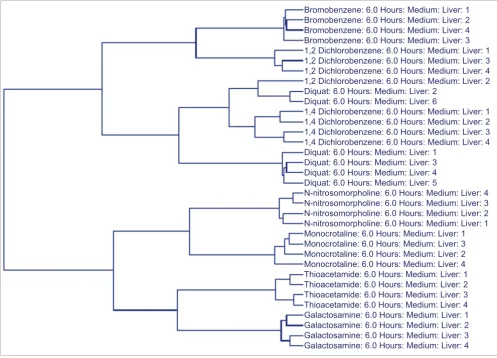
An SVM identified 160 transcripts for the classification of the 8 compounds within the liver profile data of animals treated with the medium ('toxic') dose and sacrificed at the 6 hour time point. When the expression level data for these tran-scripts were used to cluster the medium dose samples at the 6 hour time point, the classifiers separated the animals into the eight different compound groups, with the exception of three individual animals (two diquat animals (animals 2 and 6) and one 1,2-dichlorobenzene animal (animal 2); Figure 1). Inter-estingly, these animals had a noticeably different phenotypic response compared to the other individuals in their com-pound group or represent a comcom-pound group demonstrating significant diversity in the manifested phenotype. For exam-ple, three of the animals in the 1,2-dichlorobenzene group (animals 1, 3, and 4) had minimal levels of hepatocellular necrosis at this dose and time; however, the sample that did not cluster (animal 2) with these animals did not have any observable necrosis. The diquat treatment at this dose and time point resulted in variability in regards to the phenotypic response at the level of histopathology. Three of the six diquat treated animals had no apparent histopathological observa-tions, two had noted levels of glycogen depletion and one ani-mal did have miniani-mal levels of hepatocellular necrosis. While the grouping of the samples in the cluster does not perfectly reflect the three different levels of liver damage noted in this
compound group, the lack of grouping is consistent with the variability in regards to the treatment response. This con-firms that while transcript data from the primary target organ can effectively classify compounds, this is true only inasmuch as the treatment evokes a level of consistency in the response. In instances in which the response to a particular dose of a given compound is variable in regards to the phenotype that is evoked, the transcript expression levels are more reflective of the phenotype as opposed to the inducing compound. These findings underscore the importance of phenotypical anchoring.
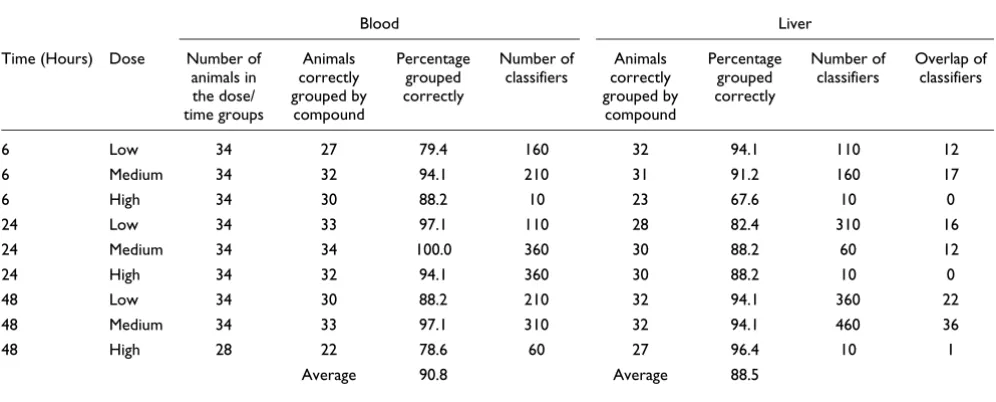
[image:4.612.54.554.120.281.2]When one considers the variability of the presence and sever-ity of necrosis and the infiltration of inflammatory cells, it is not surprising that gene expression data from a target organ would not accurately group all of the samples within a given compound. For this reason, the gene expression data gener-ated from whole blood were examined to determine if these data could more accurately group samples based on com-pound. Blood is a highly accessible bio-fluid, yet is not the pri-mary target tissue for compound toxicity. When the liver data were examined, the SVM-identified classifiers for each of the nine dose/time groups were not able to accurately group all of the individuals into the eight compound groups. In contrast, the classifiers that were generated using the blood data were able to accurately group all of the individuals according to the eight compounds in only one of the nine dose/time groups, but performed better than the liver data at grouping individ-uals into compound groups in six of the nine dose/time groups. Table 3 indicates the number of classifiers that were identified for each dose/time group for each tissue type (as well as the number of classifiers overlapping across the tissue types within a dose/time group) and indicates the accuracy each set of classifiers achieved in grouping all of the animals into compound groups. Interestingly, the SVM classifiers generated from blood data outperformed the SVM classifiers
Table 1
Hepatotoxicants studied
Compound Low dose 'sub-toxic' (mg/kg)
Medium dose 'moderately toxic'
(mg/kg)
Medium high dose (mg/kg)
High dose 'toxic' (mg/kg)
Vehicle Delivery method
Primary site of livery injury
Bromobenzene 25 75 NA 250 Corn oil Oral gavage Centrilobular 1,2-Dichlorobenzene 15 150 NA 1,500 Corn oil Oral gavage Centrilobular 1,4-Dichlorobenzene 15 150 NA 1,500 Corn oil Oral gavage NA* N-nitrosomorpholine 10 50 NA 300 PBS Oral gavage Centrilobular Diquat 5 10 20 25 PBS Intraperitoneal
injection
Mid-zonal to centrilobular Monocrotaline 10 50 NA 300 PBS Oral gavage Centrilobular Thioacetamide 15 50 NA 150 PBS Oral gavage Centrilobular Galactosamine 25 100 NA 400 PBS Intra-peritoneal
injection
Random
generated from liver data in six of the nine dose/time groups; the exceptions were the low dose, 6 hour group and the low and high dose groups for the 48 hour time point. Though the number of common classifiers across the tissue types within a given dose/time group were small, this was not an unex-pected finding considering that the target tissue is the site of the injury whereas the blood represents a readily available tis-sue source functioning as a surrogate (Table 3). Cumulatively, these findings reinforce the utility of performing gene expres-sion profiling experiments on blood as a suitable surrogate for the target organ.
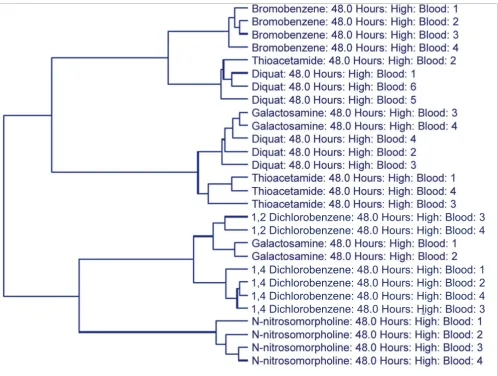
Transcript data from blood, however, were also unable to group individual animals in some instances in which the com-pound manifested different phenotypic responses across the animals of that particular dose/time group. At the high dose/ 48 hour time point, three of the compounds (diquat, thioa-cetamide, and galactosamine) demonstrated variability in regards to the extent of hepatocellular necrosis, the amount of inflammatory cell infiltrates and/or indications of hepatocel-lular repair (mitosis). Consistent with this observation, these are also the three compounds that did not separate perfectly in the dendrogram resulting from the hierarchical clustering of the blood gene expression data for the 60 SVM-identified classifiers for this dose/time group (Figure 2), suggesting that the phenotypic response resulting from exposure to a given compound was having a greater impact on the gene
expres-sion profile compared to a unified transcriptional response resulting merely from the exposure to the compound per se. Taken together, these results indicate that the details of the injury resulting from compound application are a more appropriate grouping than are the doses and time points of individual compounds when using gene expression data from the primary site of injury - in this case the liver - or when using gene expression data from a surrogate source such as whole blood.
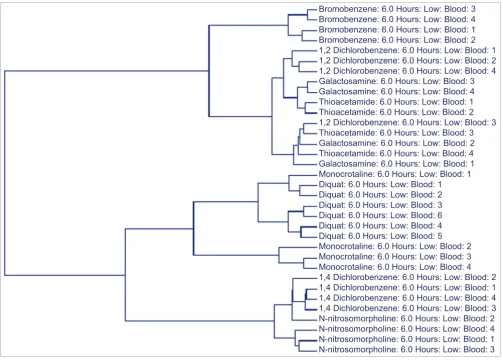
[image:5.612.55.551.127.407.2]Another illuminating trend in both liver and blood gene expression data was the grouping of galactosamine and thio-acetamide samples. For example, using the 160 SVM-identi-fied classifiers generated from the blood data for the low dose/6 hour samples, most of the samples within a given compound group clustered together (Figure 3). It was not sur-prising to observe several cases in which a specific animal did not group with the others from a compound group since vir-tually no histopathological phenotypes were observed at this time point after exposure to a low dose. In fact, in most instances this exposure dose did not elicit any injury at any of the time points. However, the galactosamine and thioaceta-mide samples grouped together. Interestingly, these are the only two compounds that evoked biliary hyperplasia in this study, albeit at a later time point (48 hours). Their grouping in the low dose/6 hour samples suggests that they activate similar transcriptional responses long before a common
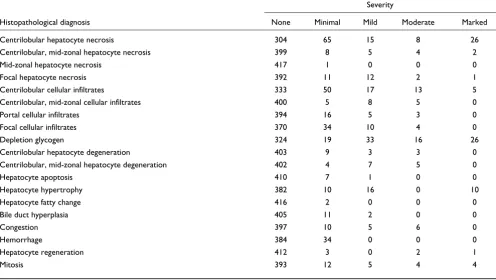
Table 2
Summary of histopathological diagnoses and severities
Severity
Histopathological diagnosis None Minimal Mild Moderate Marked
Centrilobular hepatocyte necrosis 304 65 15 8 26 Centrilobular, mid-zonal hepatocyte necrosis 399 8 5 4 2 Mid-zonal hepatocyte necrosis 417 1 0 0 0 Focal hepatocyte necrosis 392 11 12 2 1 Centrilobular cellular infiltrates 333 50 17 13 5 Centrilobular, mid-zonal cellular infiltrates 400 5 8 5 0 Portal cellular infiltrates 394 16 5 3 0 Focal cellular infiltrates 370 34 10 4 0
Depletion glycogen 324 19 33 16 26
Centrilobular hepatocyte degeneration 403 9 3 3 0 Centrilobular, mid-zonal hepatocyte degeneration 402 4 7 5 0
Hepatocyte apoptosis 410 7 1 0 0
Hepatocyte hypertrophy 382 10 16 0 10
Hepatocyte fatty change 416 2 0 0 0
Bile duct hyperplasia 405 11 2 0 0
Congestion 397 10 5 6 0
Hemorrhage 384 34 0 0 0
Hepatocyte regeneration 412 3 0 2 1
visible phenotype is observed, despite the fact that these com-pounds are not structurally related.
In order to assess the biological themes within each set of classifiers, a Gene Ontology (GO) enrichment analysis was performed on the classifiers for each tissue/time point/dose group using GoMiner [37,38]. The enrichment p-values for all GO categories that had at least five members measured by the microarray are detailed in Additional data file 3. The GO cat-egories that were found to be enriched in multiple tissue/time point/dose groups revealed some interesting aspects of the biology underlying the molecular response to the exposure to these acute hepatotoxicants. Not surprisingly, categories like 'response to chemical stimulus' and 'response to wounding' were found to be enriched in many of these groups. 'Taxis' and 'chemotaxis' were the most prevalently enriched GO catego-ries in both tissue types, which likely reflects the differential response with regards to the inflammatory cell infiltrates
across the compounds. 'Wound healing' was significantly enriched in many of the time point/dose groups in the liver, except at the time points associated with the high dose expo-sure, which is consistent with the histopathological observa-tions with the sub-toxic and moderately toxic doses. Interestingly, this category was enriched at the 24 and 48 hour time points for the high dose exposures in blood. Also surprising was the observation that classifiers annotated to 'wound healing' were different for each of these time points in blood, potentially suggesting that the differences in the iden-tity of the genes may represent some of the temporal responses to the healing and repair processes that occurred between the 24 and 48 hour time points.
Cumulatively, these results support the previous findings that toxicants can be classified and differentiated based on gene expression profiling data from the target organ [2,3,35,36], but extends our understanding by determining that such
[image:6.612.54.551.87.444.2]Hierarchical clustering of animals in the medium dose/6 hour group using SVM-derived classifiers
Figure 1
results can also be obtained using whole blood. Importantly, in instances where a specific dose of a compound resulted in variable severity of liver injury, it was found that the specifics of the injury were a more significant determinant of sion levels than were compound-specific patterns of expres-sion. This strongly reinforces the need to phenotypically anchor gene expression data in order to appropriately inter-pret the results.
Transcript profiles of toxicity in whole blood
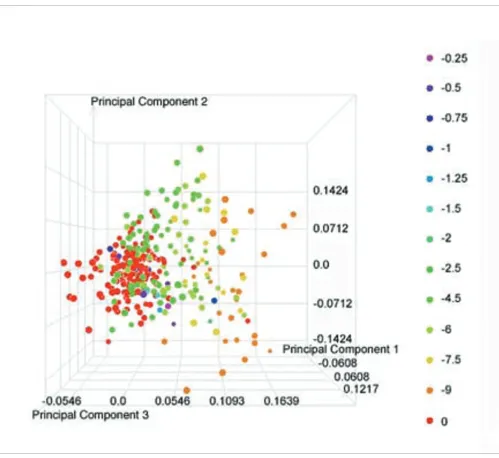
Having demonstrated the utility of performing gene expres-sion profiling on whole blood samples as an effective surro-gate for the target organ to classify compound exposures, we sought to further explore the utility of this readily available sample source by establishing whether blood transcript data could provide insights into the presence and severity of injury within a target organ upon toxicant exposure. In previously published work using these same in-life studies, we detailed an approach to compile histopathological diagnoses into common biological themes and to appropriately weigh and score these observations [39]. Using this approach, the diag-noses involving 'glycogen depletion', 'hypertrophy', 'fatty change', and 'necrosis' were combined in a 'Response to hepa-tocellular injury' category. For each individual animal in this study, a score was calculated for this category based on the absence or presence (and associated severity score) of the his-topathological observation comprising this category (Addi-tional data file 1). These scores were used as the factor level in a one-way analysis of variance (ANOVA) involving the gene expression data from whole blood. A total of 30 transcripts was found to vary significantly (p-value ≤ 1 × 10⁻⁷) across the
factor levels. Interestingly, over 60% of these transcripts (n = 19) overlap with the set of 3,659 transcripts that were identified using the same ANOVA approach with the liver
gene expression data [39]. The gene expression data from all 318 rats for this group of 30 transcripts were then used in a principal component analysis (PCA). The resulting visualiza-tion from this analysis (Figure 4) reveals that the variability contained in the first principal component (the combination of variables that explains the greatest amount of variation) provides good separation of the individuals based on their 'Response to hepatocellular injury' score as indicated by the increasing trend from left to right in the figure. The separation is not perfect, which is expected when one consid-ers that this is only a portion of the biological response to treatment that these animals undergo. However, this clearly illustrates the power to be able to detect not only the presence of liver injury, but also an indication of severity using tran-script data from whole blood.
Conclusion
[image:7.612.54.552.120.321.2]We have generated a data set that will be a unique and valua-ble resource for the environmental health and toxicological research community. The results of the study presented here demonstrate that, using this data set, differences in the phe-notypic manifestation of diverse hepatotoxicants can be resolved by microarray analysis. It was possible to classify histopathological differences, most likely reflecting differ-ences in mechanisms of cell-specific toxicity, using either liver tissue or blood. Such data may allow for mechanistic inference and lead to a more precise definition of the poten-tial hepatotoxicity of new compounds. In addition, the avail-ability of public access to the data derived from these studies provides a resource to other investigators pursuing these and related issues.
Table 3
SVM classifier accuracy
Blood Liver
Time (Hours) Dose Number of animals in the dose/ time groups
Animals correctly grouped by
compound
Percentage grouped correctly
Number of classifiers
Animals correctly grouped by
compound
Percentage grouped correctly
Number of classifiers
Overlap of classifiers
6 Low 34 27 79.4 160 32 94.1 110 12
6 Medium 34 32 94.1 210 31 91.2 160 17
6 High 34 30 88.2 10 23 67.6 10 0
24 Low 34 33 97.1 110 28 82.4 310 16
24 Medium 34 34 100.0 360 30 88.2 60 12
24 High 34 32 94.1 360 30 88.2 10 0
48 Low 34 30 88.2 210 32 94.1 360 22
48 Medium 34 33 97.1 310 32 94.1 460 36
48 High 28 22 78.6 60 27 96.4 10 1
Materials and methods
Animals and animal care
Male Fischer 344/N rats approximately 10-12 weeks old were obtained from Taconic laboratory animals (Germantown, NY, USA). The animals were acclimated for 14 days and observed for absence of disease. All studies were conducted at Inte-grated Laboratory Systems, Inc. (Research Triangle Park, NC, USA). The rats were kept two per polycarbonate cage (Lab Products, Inc., Maywood, NJ, USA) with Sani-Chips bedding (PJ Murphy Forest Products Corp., Montville, NJ, USA). The animal rooms were maintained at 17-25°C and 33-96% relative humidity with a 12 hour dark-light cycle and 10 room air changes per hour. Cages were changed twice per week and NTP-2000 diet and tap water were provided ad libitum.
In-life studies
Hepatotoxicants were identified based on published litera-ture and chosen due to their ability to injure different cell types and regions of the liver. Doses were determined with pilot experiments. For each chemical, doses that elicited a sub-toxic ('low'), a moderately toxic ('medium') or a overtly toxic ('high') response 24 hours after treatment were selected. The doses, vehicle, method for delivery, and primary site of liver damage for each of the eight compounds are detailed in Table 1. For each compound, control animal groups were treated with vehicle alone. All animals were fasted for 12-18 hours prior to exposure. Groups of four to six animals were dosed between 8:30 and 9:30 a.m.; thereafter, feed was pro-vided ad libitum. After 6, 24 or 48 hours of treatment, ani-mals were anesthetized by isoflurane anesthesia. Whole blood was collected via retro-orbital plexus for hematology
[image:8.612.57.555.84.459.2]Hierarchical clustering of animals in the high dose/48 hour group using SVM-derived classifiers
Figure 2
and gene expression analysis. Serum was collected for clinical chemistry. The animals were euthanized while under anesthesia by cervical dislocation and necropsied within 4 minutes of sacrifice. The left liver lobe was promptly removed and two defined cross sections were placed in 10% neutral buffered formalin for subsequent histopathology. The remainder of the left lobe was flash frozen for subsequent RNA isolation based on established methods [40]. Experi-ments were performed according to established guidelines and an approved Animal Study Protocol was on file prior to initiation of the study [41]. Additional data file 4 details the date of death, method of sacrifice, initial and final body weight along with gross findings/observations prior to and during necropsy for every animal. These data are also availa-ble in the Chemical Effects in Biological Systems (CEBS) knowledgebase under the CEBS ID# 001-00001-0020-000-4 [3001-00001-0020-000-4].
Histopathology
The cross sections that were fixed by immersion in 10% neu-tral buffered formalin (see 'In-life studies' section above) were transferred to histology grade alcohol for 18-24 hours after necropsy. Tissues were then processed, embedded in paraffin, sectioned at 5 microns, and stained with hematoxy-lin and eosin. A pathologist completed the initial microscopic evaluation of each liver sample for a given compound. Grad-ing criteria for each diagnosis are detailed in Additional data file 5. An independent pathology quality assessment review was performed by a second pathologist on the initial his-topathological findings. A third pathologist reviewed the quality assessment report and the slides and convened a con-sistent group of four to five pathologists (including the two mentioned above) to resolve any inconsistencies or discrep-ancies in diagnoses and grading for all studies. Additional data file 1 details the histopathological diagnoses and their associated severity scores for each animal in the study. These
[image:9.612.54.557.85.446.2]Hierarchical clustering of animals in the low dose/6 hour group using SVM-derived classifiers
Figure 3
data are also available in CEBS under the CEBS ID# 001-00001-0020-000-4 [34].
Clinical chemistry
At sacrifice, blood was collected in clotting tubes (BD Micro-tainer® Tubes, BD, Franklin Lakes, NJ, USA) and serum was
separated. Clinical chemistry analysis was performed on all rats using a COBAS MIRA (Roche Diagnostics, Montclair, NJ, USA) using commercially available reagents from Equal Diagnostics (Exton, PA, USA) for the following assays: total
protein, albumin, cholesterol, creatinine, direct bilirubin, total bilirubin, total bile acid, blood urea nitrogen and triglyc-erides. In addition, an enzymatic activity for the following proteins was measured: alanine aminotransferase, alkaline phosphatase, aspartate aminotransferase, lactate dehydroge-nase, and sorbitol dehydrogenase. Additional data file 1 details the clinical chemistry value for each of these parame-ters for every animal. These data are also available in CEBS under the CEBS ID# 001-00001-0020-000-4 [34].
[image:10.612.55.554.82.540.2]PCA of transcripts identified as differentially expressed across the 'Response to hepatocellular injury' category in blood
Figure 4
Hematology
Blood was collected in EDTA tubes (BD Microtainer® Tubes).
The samples were assayed using the Technicon H*1 hematol-ogy analyzer (Bayer Corporation, Tarrytown, NY, USA). The instrument performs white blood cell (WBC) counts by two independent methods. The values must have agreed within 10%. Manual counts and smear estimates were used to con-firm values, when necessary. To monitor red blood cell (RBC) parameters, spun microhematocrits were performed for each specimen for comparison with the automated hematocrit (which is calculated from the directly measured RBCs and the mean cell volume). Control products were assayed after every tenth specimen. For WBC differential data, smears were Wright-Giemsa stained using an Ames Hema-Tek II auto-mated slide stainer (Bayer Corporation, Ames Division, Elkhart, IN, USA) and manual WBC differential counts were performed on the first sample in each group. For reticulocyte counts, equal amounts of whole blood and New Methylene Blue stain were allowed to incubate at room temperature for at least 15 minutes. Smears were prepared and read to deter-mine the percent reticulocytes per 1,000 RBCs. The percent value is multiplied by the RBC count to determine the abso-lute number of reticulocytes per microliter. Additional data file 1 details the values for each of these parameters for every animal. These data are also available in CEBS under the CEBS ID# 001-00001-0020-000-4 [34].
RNA isolation and gene expression profiling
RNA was isolated from the flash frozen portion of the left lat-eral liver lobe using RNeasy Midi columns (Qiagen, Valencia, CA, USA) according to the manufacturer's protocol and also from whole blood using the PaxGene Blood RNA Kit (Qia-gen). The quantity and purity of the extracted RNA was eval-uated using a NanoDrop ND-1000 spectrophotometer (Nanodrop Technologies, Wilmington, DE, USA) and its integrity measured using an Agilent Bioanalyzer. For micro-array hybridizations performed on the Agilent platform, 1 μg of total RNA from the left liver lobe or whole blood from either an individual rat or a pooled sample representing time-matched, vehicle control animals was amplified and labeled with a fluorescent dye (either Cy3 or Cy5) using the Low RNA Input Linear Amplification Labeling kit (Agilent Technolo-gies, Palo Alto, CA, USA) following the manufacturer's proto-col. The amount and quality of the fluorescently labeled cRNA was assessed using a NanoDrop ND-1000 spectrophotometer and an Agilent Bioanalyzer. Equal amounts of Cy3- or Cy5-labeled cRNA were hybridized to the Agilent Rat Oligo Micro-array (Agilent Technologies) for 17 hours, prior to washing and scanning. Data were extracted from scanned images using Agilent's Feature Extraction Software (Agilent Technol-ogies). Fluorophore reversal hybridizations were performed for 318 treated rats against time-matched control pools for both tissue types (blood and liver) for a total of 1,272 hybrid-izations. For microarray hybridizations performed on the Affymetrix platform, 1 μg of total RNA from the left liver lobe of each individual rat was labeled using the GeneChip
One-Cycle Target Labeling kit (Affymetrix, Inc., Santa Clara, CA, USA) following the manufacturer's protocol. The amount and quality of the cRNA was assessed using a NanoDrop ND-1000 spectrophotometer and an Agilent Bioanalyzer. The cRNA was then fragmented and hybridized to the Rat Genome 230 2.0 Array (Affymetrix, Inc.) for 17 hours, prior to washing and scanning. Data were extracted from scanned images using GeneChip Operating Software (Affymetrix, Inc.). Hybridiza-tions were performed on all treated and control animals for each compound in addition to pooled control samples for two of the compounds for a total of 432 hybridizations. These data are also available in CEBS under the CEBS ID# 001-00001-0020-000-4 [34].
Data analysis
Gene expression data were loaded into the Rosetta Resolver®
Gene Expression Analysis System version 6.0.0.0.311. Fluor-ophore reversal hybridization data generated using the Agi-lent platform were combined using an error-weighted average for each individual animal. Data generated using the Affymetrix platform were loaded using the Rosetta error model for gene expression analysis [42]. Rosetta Resolver was used to perform SVM-based analysis using a Gaussian kernel function with three cross-validation loops, one-way error-weighted ANOVA (with Bonferroni multiple test cor-rection) and PCA. SVMs were used to identify compound-spe-cific classifiers on each tissue type (blood and liver) within a given dose/time group by randomly selecting two animals from each compound within a given dose/time group to which the SVM was performed to identify the classifiers. Therefore, each SVM was performed on a total of 16 animals (2 animals from each of the 8 compounds). A total of 18 SVMs were performed. The Agilent ProbeIDs for each of the classi-fiers that were identified in each of these SVMs are detailed in Additional data file 2. Hierarchical clustering was also per-formed in Rosetta Resolver using Ward's minimum variance hierarchical clustering with Euclidean distance as the similar-ity metric on ratios of gene expression data. GO enrichment analysis was performed using High-Throughput GoMiner [37,38].
Abbreviations
ANOVA, analysis of variance; CEBS, Chemical Effects in Bio-logical Systems; GO, Gene Ontology; PCA, principal compo-nent analysis; RBC, red blood cell; SVM, support vector machine; WBC, white blood cell.
Authors' contributions
GAB contributed to the analysis and interpretation of the data. EKL drafted the manuscript. PH, RSP, PRB, KG, SOS, PH, JMF, BAM, DEM critically reviewed the manuscript. All authors read and approved the final manuscript.
Additional data files
The following additional data are available with the online version of this paper. Additional data file 1 is a table detailing the histopathological scores as well as the clinical chemistry and hematology data that were generated for each animal in this project. Additional data file 2 is a table detailing the Agi-lent probe identifiers that resulted from the SVM analyses detailed in the Results section. Additional data file 3 is a table detailing the enrichment p-values that resulted from per-forming a GO enrichment analysis on the list of classifiers for each dose/time/tissue group. GO categories must have had at least five associated genes measured on the microarray in order to be included. Additional data file 4 is a table detailing all of the observations and measurements that were made during the in-life portion of the project. Additional data file 5 is a table detailing the scoring method that was used for the histopathological observations that were made in this project.
Additional data file 1
Histopathological scores and clinical chemistry and hematology data
Histopathological scores as well as the clinical chemistry and hematology data that were generated for each animal in this project.
Click here for file Additional data file 2 Agilent probe identifiers
Agilent probe identifiers that resulted from the SVM analyses detailed in the Results section.
Click here for file Additional data file 3 Enrichment p-values
Enrichment p-values that resulted from performing a GO enrich-ment analysis on the list of classifiers for each dose/time/tissue group. GO categories must have had at least five associated genes measured on the microarray in order to be included.
Click here for file Additional data file 4
Observations and measurements made during the in-life portion of the project
Observations and measurements made during the in-life portion of the project.
Click here for file Additional data file 5
Scoring method used for the histopathological observations made in this project
Scoring method used for the histopathological observations made in this project.
Click here for file
Acknowledgements
The authors would like to express their appreciation to the entire ToxPath team of the National Center for Toxicogenomics for stimulating discus-sions about the design of the study, the Investigational Genomics Group of Cogenics, a Division of Clinical Data, for performing all of the microarray work, and Drs Ivana Yang and Michael Humble for insightful comments and critical review of the manuscript. This research was supported in part by the Intramural Research Program of the National Institute of Health and the National Institute of Environmental Health Sciences and has been funded in part with Federal funds from the National Institute of Environ-mental Health Sciences, National Institute of Health, under Contract Number N01-ES-25497 and NIH-ES-33515.
References
1. Nuwaysir EF, Bittner M, Trent J, Barrett JC, Afshari CA: Microarrays and toxicology: the advent of toxicogenomics. Mol Carcinog 1999, 24:153-159.
2. Hamadeh HK, Bushel PR, Jayadev S, DiSorbo O, Bennett L, Li L, Ten-nant R, Stoll R, Barrett JC, Paules RS, et al.: Prediction of com-pound signature using high density gene expression profiling. Toxicol Sci 2002, 67:232-240.
3. Hamadeh HK, Bushel PR, Jayadev S, DiSorbo O, Bennett L, Li L, Ten-nant R, Stoll R, Barrett JC, Paules RS, Blanchard K, Afshari CA: Gene expression analysis reveals chemical-specific profiles. Toxicol Sci 2002, 67:219-231.
4. Steiner G, Suter L, Boess F, Gasser R, de Vera MC, Albertini S, Ruepp S: Discriminating different classes of toxicants by transcript profiling. Environ Health Perspect 2004, 112:1236-1248.
5. Waring JF, Jolly RA, Ciurlionis R, Lum PY, Praestgaard JT, Morfitt DC, Buratto B, Roberts C, Schadt E, Ulrich RG: Clustering of hepato-toxins based on mechanism of toxicity using gene expression profiles. Toxicol Appl Pharmacol 2001, 175:28-42.
6. Bammler T, Beyer RP, Bhattacharya S, Boorman GA, Boyles A, Brad-ford BU, Bumgarner RE, Bushel PR, Chaturvedi K, Choi D, Cunning-ham ML, Deng S, Dressman HK, Fannin RD, Farin FM, Freedman JH, Fry RC, Harper A, Humble MC, Hurban P, Kavanagh TJ, Kaufmann WK, Kerr KF, Jing L, Lapidus JA, Lasarev MR, Li J, Li YJ, Lobenhofer EK, Lu X, et al.: Standardizing global gene expression analysis between laboratories and across platforms. Nat Methods 2005, 2:351-356.
7. Irizarry RA, Warren D, Spencer F, Kim IF, Biswal S, Frank BC,
Gabri-elson E, Garcia JG, Geoghegan J, Germino G, Griffin C, Hilmer SC, Hoffman E, Jedlicka AE, Kawasaki E, Martínez-Murillo F, Morsberger L, Lee H, Petersen D, Quackenbush J, Scott A, Wilson M, Yang Y, Ye SQ, Yu W: Multiple-laboratory comparison of microarray platforms. Nat Methods 2005, 2:345-350.
8. Larkin JE, Frank BC, Gavras H, Sultana R, Quackenbush J: Independ-ence and reproducibility across microarray platforms. Nat Methods 2005, 2:337-344.
9. MAQC Consortium, Shi L, Reid LH, Jones WD, Shippy R, Warrington JA, Baker SC, Collins PJ, de Longueville F, Kawasaki ES, Lee KY, Luo Y, Sun YA, Willey JC, Setterquist RA, Fischer GM, Tong W, Dragan YP, Dix DJ, Frueh FW, Goodsaid FM, Herman D, Jensen RV, Johnson CD, Lobenhofer EK, Puri RK, Schrf U, Thierry-Mieg J, Wang C, Wil-son M, et al.: The MicroArray Quality Control (MAQC) project shows inter- and intraplatform reproducibility of gene expression measurements. Nat Biotechnol 2006, 24:1151-1161.
10. Beyer RP, Fry RC, Lasarev MR, McConnachie LA, Meira LB, Palmer VS, Powell CL, Ross PK, Bammler TK, Bradford BU, Cranson AB, Cunningham ML, Fannin RD, Higgins GM, Hurban P, Kayton RJ, Kerr KF, Kosyk O, Lobenhofer EK, Sieber SO, Vliet PA, Weis BK, Wolfin-ger R, Woods CG, Freedman JH, Linney E, Kaufmann WK, Kavanagh TJ, Paules RS, Rusyn I, et al.: Multicenter study of acetaminophen hepatotoxicity reveals the importance of biological end-points in genomic analyses. Toxicol Sci 2007, 99:326-337. 11. Guo L, Lobenhofer EK, Wang C, Shippy R, Harris SC, Zhang L, Mei
N, Chen T, Herman D, Goodsaid FM, Hurban P, Phillips KL, Xu J, Deng X, Sun YA, Tong W, Dragan YP, Shi L: Rat toxicogenomic study reveals analytical consistency across microarray platforms. Nat Biotechnol 2006, 24:1162-1169.
12. Gottschalg E, Moore NE, Ryan AK, Travis LC, Waller RC, Pratt S, Atmaca M, Kind CN, Fry JR: Phenotypic anchoring of arsenic and cadmium toxicity in three hepatic-related cell systems reveals compound- and cell-specific selective up-regulation of stress protein expression: implications for fingerprint pro-filing of cytotoxicity. Chem Biol Interact 2006, 161:251-261. 13. Hamadeh HK, Knight BL, Haugen AC, Sieber S, Amin RP, Bushel PR,
Stoll R, Blanchard K, Jayadev S, Tennant RW, Cunningham ML, Afshari CA, Paules RS: Methapyrilene toxicity: anchorage of patho-logic observations to gene expression alterations. Toxicol Pathol 2002, 30:470-482.
14. Paules R: Phenotypic anchoring: linking cause and effect. Envi-ron Health Perspect 2003, 111:A338-339.
15. Powell CL, Kosyk O, Ross PK, Schoonhoven R, Boysen G, Swenberg JA, Heinloth AN, Boorman GA, Cunningham ML, Paules RS, Rusyn I: Phenotypic anchoring of acetaminophen-induced oxidative stress with gene expression profiles in rat liver. Toxicol Sci 2006, 93:213-222.
16. Baird AE: The blood option: transcriptional profiling in clinical trials. Pharmacogenomics 2006, 7:141-144.
17. Burczynski ME, Dorner AJ: Transcriptional profiling of periph-eral blood cells in clinical pharmacogenomic studies. Pharma-cogenomics 2006, 7:187-202.
18. Fannin RD, Auman JT, Bruno ME, Sieber SO, Ward SM, Tucker CJ, Merrick BA, Paules RS: Differential gene expression profiling in whole blood during acute systemic inflammation in lipopoly-saccharide-treated rats. Physiol Genomics 2005, 21:92-104. 19. Forrest MS, Lan Q, Hubbard AE, Zhang L, Vermeulen R, Zhao X, Li
G, Wu YY, Shen M, Yin S, Chanock SJ, Rothman N, Smith MT: Dis-covery of novel biomarkers by microarray analysis of periph-eral blood mononuclear cell gene expression in benzene-exposed workers. Environ Health Perspect 2005, 113:801-807. 20. Lampe JW, Stepaniants SB, Mao M, Radich JP, Dai H, Linsley PS, Friend
SH, Potter JD: Signatures of environmental exposures using peripheral leukocyte gene expression: tobacco smoke. Can-cer Epidemiol Biomarkers Prev 2004, 13:445-453.
21. Talwar S, Munson PJ, Barb J, Fiuza C, Cintron AP, Logun C, Tropea M, Khan S, Reda D, Shelhamer JH, Danner RL, Suffredini AF: Gene expression profiles of peripheral blood leukocytes after endotoxin challenge in humans. Physiol Genomics 2006, 25:203-215.
22. Bushel PR, Heinloth AN, Li J, Huang L, Chou JW, Boorman GA, Malar-key DE, Houle CD, Ward SM, Wilson RE, Fannin RD, Russo MW, Watkins PB, Tennant RW, Paules RS: Blood gene expression sig-natures predict exposure levels. Proc Natl Acad Sci USA 2007, 104:18211-18216.
24. Toxicology CoAoTTtP: Applications of Toxicogenomics Technologies to Predictive Toxicology and Risk Assessment Washington, DC: The National Academies Press; 2007.
25. Hissink AM, Van Ommen B, Kruse J, Van Bladeren PJ: A physiolog-ically based pharmacokinetic (PB-PK) model for 1,2-dichlo-robenzene linked to two possible parameters of toxicity. Toxicol Appl Pharmacol 1997, 145:301-310.
26. Jarman M, Manson D: The metabolism of N-nitrosomorpholine by rat liver microsomes and its oxidation by the Fenton system. Carcinogenesis 1986, 7:559-565.
27. Nedelcheva V, Gut I, Soucek P, Frantik E: Cytochrome P450 cata-lyzed oxidation of monochlorobenzene, 1,2- and 1,4-dichlo-robenzene in rat, mouse, and human liver microsomes. Chem Biol Interact 1998, 115:53-70.
28. Ramaiah SK, Apte U, Mehendale HM: Cytochrome P4502E1 induction increases thioacetamide liver injury in diet-restricted rats. Drug Metab Dispos 2001, 29:1088-1095.
29. Reid MJ, Lame MW, Morin D, Wilson DW, Segall HJ: Monocrota-line metabolism and distribution in Fisher 344 and Sprague-Dawley rats. Comp Biochem Physiol B Biochem Mol Biol 1997, 117:115-123.
30. Rikans LE, Cai Y, Kosanke SD, Venkataraman PS: Redox cycling and hepatotoxicity of diquat in aging male Fischer 344 rats. Drug Metab Dispos 1993, 21:605-610.
31. Gujral JS, Farhood A, Jaeschke H: Oncotic necrosis and caspase-dependent apoptosis during galactosamine-induced liver injury in rats. Toxicol Appl Pharmacol 2003, 190:37-46.
32. Waters M, Boorman G, Bushel P, Cunningham M, Irwin R, Merrick A, Olden K, Paules R, Selkirk J, Stasiewicz S, Weis B, Van Houten B, Walker N, Tennant R: Systems toxicology and the Chemical Effects in Biological Systems (CEBS) knowledge base. EHP Toxicogenomics 2003, 111:15-28.
33. Xirasagar S, Gustafson S, Merrick BA, Tomer KB, Stasiewicz S, Chan DD, Yost KJ 3rd, Yates JR 3rd, Sumner S, Xiao N, Waters MD: CEBS object model for systems biology data, SysBio-OM. Bioinfor-matics 2004, 20:2004-2015.
34. Chemical Effects in Biological Systems [http:// cebs.niehs.nih.gov]
35. Bushel PR, Hamadeh HK, Bennett L, Green J, Ableson A, Misener S, Afshari CA, Paules RS: Computational selection of distinct class- and subclass-specific gene expression signatures. J Biomed Inform 2002, 35:160-170.
36. Ellinger-Ziegelbauer H, Stuart B, Wahle B, Bomann W, Ahr HJ: Com-parison of the expression profiles induced by genotoxic and nongenotoxic carcinogens in rat liver. Mutat Res 2005, 575:61-84.
37. Zeeberg BR, Feng W, Wang G, Wang MD, Fojo AT, Sunshine M, Nar-asimhan S, Kane DW, Reinhold WC, Lababidi S, et al.: GoMiner: a resource for biological interpretation of genomic and pro-teomic data. Genome Biol 2003, 4:R28.
38. Zeeberg BR, Feng W, Wang G, Wang MD, Fojo AT, Sunshine M, Nar-asimhan S, Kane DW, Reinhold WC, Lababidi S, Bussey KJ, Riss J, Bar-rett JC, Weinstein JN: High-Throughput GoMiner, an 'industrial-strength' integrative gene ontology tool for inter-pretation of multiple-microarray experiments, with applica-tion to studies of Common Variable Immune Deficiency (CVID). BMC Bioinformatics 2005, 6:168.
39. Lobenhofer EK, Boorman GA, Phillips KL, Heinloth AN, Malarkey DE, Blackshear PE, Houle C, Hurban P: Application of visualization tools to the analysis of histopathological data enhances bio-logical insight and interpretation. Toxicol Pathol 2006, 34:921-928.
40. Foley JF, Collins JB, Umbach DM, Grissom S, Boorman GA, Heinloth AN: Optimal sampling of rat liver tissue for toxicogenomic studies. Toxicol Pathol 2006, 34:795-801.
41. Council NR: Guide for the Care and Use of Laboratory Animals Washing-ton: National Academy Press; 1996.