Volume 4, Issue 7, 2017
21 Available online at www.ijiere.com
International Journal of Innovative and Emerging
Research in Engineering
e-ISSN: 2394 – 3343 p-ISSN: 2394 – 5494
Multi-objective Optimization of CNC Plasma Arc Machining
on SS 316L using NSGA-II
1
Karthik Rajan,
2Dr. Brijesh Paul,
3Dr. Shajan Kuriakose
1Production and Industrial Engg, Department of Mechanical Engg., KTU, Kerala 2,3Department of Mechanical Engg., KTU, Kerala
Abstract— In this work the investigation is done on SS 316L for identifying the best CNC plasma arc machining parameter settings. Optimization is very useful to reduce cost and time for machining. The approach is based on Taguchi‘s design of experiments. Material removal rate and surface roughness are the output responses selected for the study. Analysis of variance (ANOVA) is used to find out which machining parameters significantly affect the performance characteristics. Multi-objective optimization is also done using non dominated sorted genetic algorithm - II (NSGA II) after obtaining regression models of output responses using multiple linear regression. Pareto optimal solutions are sorted out and this provides flexibility to the manufacturing industries to choose the best setting depending on applications or during the design of a new equipment. In NSGA II, the best parameter settings between the experimental bounds can be sorted out, i.e., the pareto optimal solutions.
Keywords— Multi-objective optimization, Non dominated sorted genetic algorithm II (NSGA II), Multiple linear
regression, Pareto optimal solutions, SS 316L
I. INTRODUCTION
Non-conventional methods are preferred whenever we require fast material removal rate at a considerable cut quality tolerances. Also the development of hard and advanced materials and alloys, and the difficulties in their machining have influenced the development of non-conventional machining techniques.
When coming to the manufacturing sector, faster cutting of materials with the required cut quality and reduction in material loss, enhances the productivity, quality and decreases the economy of production.
Keeping these in mind, the present study is an investigation of CNC Plasma Arc Machining Parameters on SS 316L. The focus of this project is to obtain the optimum parameter settings to maximize the material removal rate and minimize the surface roughness.
Plasma arc machining is a fast process which can be placed between Oxy-acetylene cutting and the Laser machining process in terms of cut quality. It is a fast machining process and is also economical compared to other sheet metal fabrication processes like laser machining, Abrasive water jet machining and flame cutting. Cutting of profiles using laser machining of sheet metals can be uneconomical while dealing with heavy duty applications. Usage of abrasive water jet is also not applicable because of the cost of production and the speed of machining. Conventional flame cutting leads to the formation of very high heat affected zone in the work material and also completely oxidizes the cut front of the material.
II. EXPERIMENTATION
A. Design of Experiments
Though many types of design of experiment techniques are available in literature, Taguchi design gives more accurate results with minimum number of experiments. Thus whenever there are costs and time constraints, researchers often go for the Taguchi DOE. After performing the experiments, statistical methods are used to analyse the obtained the results. Here L16 orthogonal array is used for optimizing the process parameters gas pressure, arc current, traverse speed and standoff distance for output responses material removal rate and surface roughness for SS 316L material of 6mm thick plate.
B. Experiment Details
Volume 4, Issue 7, 2017
22 exceptional corrosion resistance. These are low carbon steels. The chemical composition of SS 316L is shown in table 1.
Table 1
Chemical Composition of SS 316L
Grade C Mn Si P S Cr Mo
316L Min 0.00 0.00 0.00 0.00 0.00 16.0 2.00
Max 0.03 2.0 0.75 0.045 0.03 18.0 3.00
There are 4 levels fixed for the experimental purpose from literature survey as well as pilot study.
Table 2
Control factors and levels used in experiments
SL NO: PARAMETERS LEVEL 1 LEVEL 2 LEVEL 3 LEVEL 4
1
PLASMA GAS PRESSURE
(bar) 4 5 6 7
2
ARC
CURRENT (A) 40 70 100 130
3
TRAVERSE SPEED
(mm/min) 600 800 1000 1200
4
STANDOFF DISTANCE
(mm) 2 4 6 8
With the help of Mitutoyo SJ-201 and digital weighing balance, the responses are calculated. The experimental values are obtained as as shown in table 3.
Table 3
Experimental measured values of MRR and Ra
SI No.
PARAMETERS OUTPUT RESPONSES
Plasma Gas Pressure (bar)
Arc Current (ampere)
Traverse Speed (mm/min)
Standoff Distance (mm)
Surface Roughness (μm)
MRR
(g/sec)
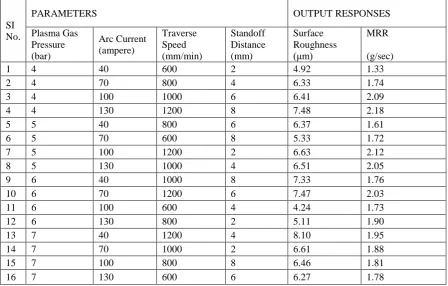
1 4 40 600 2 4.92 1.33
2 4 70 800 4 6.33 1.74
3 4 100 1000 6 6.41 2.09
4 4 130 1200 8 7.48 2.18
5 5 40 800 6 6.37 1.61
6 5 70 600 8 5.33 1.72
7 5 100 1200 2 6.63 2.12
8 5 130 1000 4 6.51 2.05
9 6 40 1000 8 7.33 1.76
10 6 70 1200 6 7.47 2.03
11 6 100 600 4 4.24 1.73
12 6 130 800 2 5.11 1.90
13 7 40 1200 4 8.10 1.95
14 7 70 1000 2 6.61 1.88
15 7 100 800 8 6.46 1.81
16 7 130 600 6 6.27 1.78
Volume 4, Issue 7, 2017
23 SURFACE ROUGHNESS
Lower the better criterion of signal to noise ratio is used.
Table 4
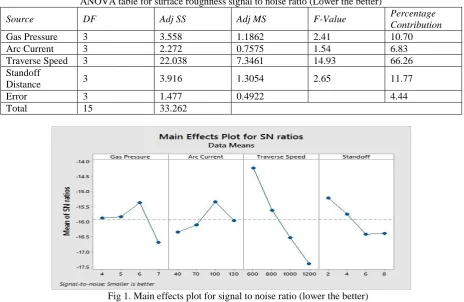
ANOVA table for surface roughness signal to noise ratio (Lower the better)
Source DF Adj SS Adj MS F-Value Percentage
Contribution
Gas Pressure 3 3.558 1.1862 2.41 10.70
Arc Current 3 2.272 0.7575 1.54 6.83
Traverse Speed 3 22.038 7.3461 14.93 66.26
Standoff
Distance 3 3.916 1.3054 2.65 11.77
Error 3 1.477 0.4922 4.44
Total 15 33.262
Fig 1. Main effects plot for signal to noise ratio (lower the better)
From the ANOVA table, it was concluded that Traverse speed is the most influencing parameter of the machining process followed by standoff distance, gas pressure and arc current respectively.
Table 5
Response table for signal to noise ratio (lower the better)
Level Gas Pressure Arc Current Traverse Speed Standoff Distance
1 -15.87 -16.35 -14.22 -15.21
2 -15.83 -16.11 -15.62 -15.75
3 -15.37 -15.33 -16.53 -16.41
4 -16.68 -15.97 -17.39 -16.38
Delta 1.31 1.02 3.17 1.20
Rank 2 4 1 3
From the response table the optimal parameters for surface roughness can be predicted as gas pressure (6bar), arc current (100A), Traverse speed (600mm/min) and standoff distance (2mm)
MATERIAL REMOVAL RATE
Table 6
ANOVA table for signal to noise ratio (higher the better)
Source DF Adj SS Adj MS F-Value Percentage
Contribution Plasma Gas
Pressure 3 0.2026 0.06754 0.26 1.17
Arc Current 3 5.8557 1.95189 7.64 33.86
Traverse Speed 3 10.0127 3.33756 13.06 57.89
Standoff
Distance 3 0.4560 0.15200 0.59 2.64
Error 3 0.7669 0.25563 4.44
Volume 4, Issue 7, 2017
24 From the ANOVA able it was concluded that here also Traverse speed is the most influencing parameter followed by arc current, standoff distance and plasma gas pressure respectively.
Table 7
Response table for signal to noise ratio (higher the better)
Level Plasma Gas
Pressure Arc Current Traverse Speed Standoff Distance
1 5.115 4.331 4.239 5.015
2 5.402 5.289 4.919 5.402
3 5.349 5.711 5.758 5.424
4 5.361 5.897 6.312 5.386
Delta 0.287 1.566 2.072 0.409
Rank 4 2 1 3
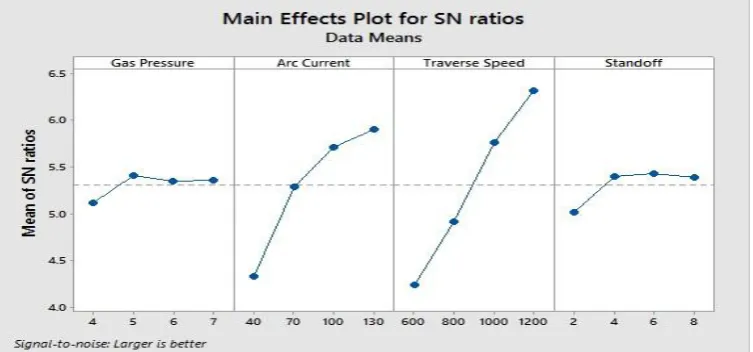
From the response table the optimal combination for MRR can be predicted as gas pressure (5bar), arc current (130A), traverse speed (1200mm/min) and standoff distance (6mm).
After finding this, the next approach is to find the regression equation, i.e., the general linear model followed by multi-objective optimization. There are more than one result means the pareto optimal solutions are found out using evolutionary optimization technique called non dominated sorting genetic algorithm. All the non-dominated solutions are sorted and a parameter named crowding distance is used for ranking in order to preserve the diversity of the solution thereby helping to prevent the convergence of the solutions into a particular area.
Fig 2. Main effects plot for signal to noise ratio (larger the better)
D. REGRESSION MODEL
General linear model was created for both the responses by multiple linear regression analysis. Regression equation for surface roughness:
Ra = 1.913 + (0.155 x Plasma Gas Pressure) - (0.00504 x Arc Current) + (0.003669 x Traverse Speed) + (0.1416 x Standoff Distance)
Regression equation for MRR:
MRR = 0.829 + (0.0040 x Plasma Gas Pressure) + (0.003467 x Arc Current) + (0.000735 x Traverse Speed) + (0.00950 x Standoff Distance)
E. MULTI-OBJECTIVE OPTIMIZATION
Volume 4, Issue 7, 2017
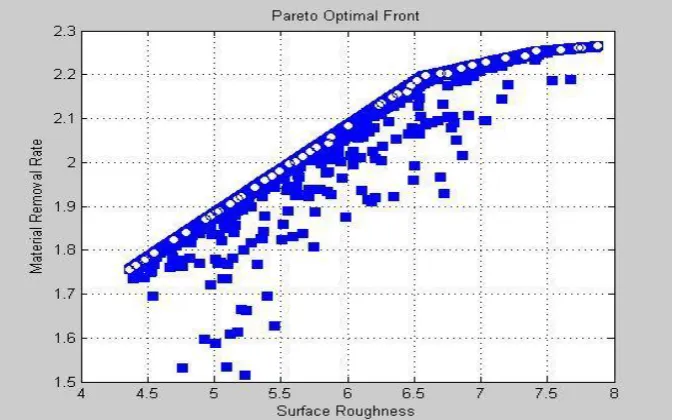
25 Fig 3. Pareto graph between MRR and Ra
The red points are the non-dominated solutions which are being obtained and all the solutions are equally important as pareto optimal solutions are equal in importance because there is no weightage assigned for both output responses. Here the crossover probability is given as 0.8 and mutation probability is 0.4 and mutation rate is assigned as 0.02. These operators are conventional genetic algorithm operators used for the production of new offspring. The objective function is assigned with the help of equation generated by multiple linear regression and the analysis is done within the bounds of experimentation.
Fig. 4 Pareto optimal front with optimisms (round) and generations (square)
Table 8
Non-dominated sorting genetic algorithm results
SL. NO
Objective function values Optimal parametric combinations MRR
(g/sec)
Ra
(μm)
Plasma Gas Pressure
(bar)
Arc Current
(ampere)
Traverse Speed
(mm/min)
Standoff Distance
(mm)
1 1.76 4.36 4.00 130.00 0600.00 2.00
2 2.27 7.88 7.00 130.00 1200.00 8.00
3 2.08 6.01 4.01 130.00 1043.59 2.13
4 2.13 6.24 4.01 130.00 1107.04 2.10
Volume 4, Issue 7, 2017
26
6 1.79 4.55 4.01 130.00 0651.15 2.00
7 1.87 4.93 4.00 130.00 0754.79 2.02
8 1.94 5.30 4.00 130.00 0856.03 2.00
9 2.06 5.88 4.00 130.00 1010.02 2.08
10 2.24 7.18 4.13 130.00 1200.00 6.24
11 2.25 7.41 4.00 130.00 1200.00 8.00
12 2.23 7.03 4.00 130.00 1200.00 5.31
13 2.24 7.34 5.06 130.00 1200.00 6.28
14 1.98 5.49 4.01 130.00 0904.83 2.04
15 1.90 5.12 4.01 130.00 0800.79 2.16
16 1.92 5.20 4.01 130.00 0827.77 2.02
17 2.21 6.86 4.01 130.00 1196.87 4.14
18 1.96 5.38 4.01 130.00 0876.72 2.00
19 1.82 4.70 4.00 130.00 0691.95 2.00
20 2.19 6.52 4.00 130.00 1187.37 2.00
21 2.20 6.59 4.01 130.00 1200.00 2.18
22 2.15 6.33 4.01 130.00 1136.72 2.00
23 2.04 5.77 4.00 130.00 0979.62 2.07
24 2.01 5.66 4.01 130.00 0946.93 2.18
25 2.22 6.93 4.01 130.00 1198.82 4.64
26 2.04 5.86 4.09 130.00 0985.02 2.48
27 2.00 5.57 4.01 130.00 0926.58 2.03
28 2.17 6.47 4.00 130.00 1166.37 2.22
29 2.02 5.72 4.01 130.00 0962.70 2.19
30 1.97 5.43 4.01 130.00 0888.78 2.05
31 2.20 6.75 4.00 130.00 1188.91 3.62
32 1.77 4.41 4.00 130.00 0612.84 2.00
33 2.13 6.25 4.00 130.00 1114.96 2.00
34 1.89 5.04 4.01 130.00 0783.02 2.02
35 2.16 6.44 4.10 130.00 1142.09 2.55
36 2.00 5.60 4.01 130.00 0933.40 2.12
37 1.92 5.17 4.01 130.00 0819.37 2.04
38 2.20 6.69 4.01 130.00 1193.34 3.08
39 1.88 4.97 4.00 130.00 0765.78 2.01
40 1.78 4.48 4.00 130.00 0632.22 2.01
41 2.26 7.73 6.07 130.00 1200.00 7.96
42 2.16 6.38 4.01 130.00 1142.12 2.17
43 1.78 4.47 4.01 130.00 0627.17 2.05
44 2.26 7.60 5.34 130.00 1200.00 7.83
45 1.89 5.02 4.01 130.00 0777.77 2.01
III. CONCLUSIONS
In this study, the influence of the plasma arc machining process parameters on surface roughness and material removal rate was studied using L16 orthogonal array method. The most influencing factor for surface roughness was found to be traverse speed followed by standoff distance, plasma gas pressure and arc current. Material removal rate is also influenced mostly by traverse speed followed by arc current, standoff distance and plasma gas pressure. The significance of the machining parameters and their individual contributions on the surface roughness is determined by using analysis of variance (ANOVA). The percentage contribution of nozzle traverse speed towards surface roughness is 66.26%. Standoff distance, plasma gas pressure and arc current contribute 11.77%, 10.70% and 6.83% respectively. The percentage contribution of nozzle traverse speed and arc current are 57.89% and 33.86% respectively.
From the results obtained a regression model is developed to predict the surface roughness and material removal rate. Hence these models had a bigger R square value, this model is used for multi-objective optimization using genetic algorithm in order to find out the pareto optimal solutions as well as the pareto front. Thus optimizations based on the number of combinations of process parameters as well as optimized parameter settings between the experimental bounds is also found out.
Volume 4, Issue 7, 2017
27 REFERENCES
[1] Bhuvenesh, R., M. H. Norizaman and M. S. A. Manan (2012) Surface Roughness and MRR Effect on Manual Plasma Arc Cutting. International Journal of Mechanical, Aerospace, Industrial, Mechatronic and Manufacturing Engineering, 6, 459-462.
[2] Boselli, M., V. Colombo, E. Ghedini, M. Gherardi, F. Rotundo and P. Sanibondi (2013) High Speed Imaging Investigation of Transient Phenomena Impacting Plasma Arc Cutting Process Optimization. J. Phys. D: Appl. Phys., 46, 1-10.
[3] Deb, K., A. Pratap, S. Agarwal and T. Meyarivan (2002) A Fast and Elitist Multi-objective Genetic Algorithm NSGA 2. IEEE Transactions on Evolutionary Computation, 6, 182-197.
[4] Golshan, A., M. R. Shirdar and S. Izman (2011) A Comparison of Optimization Methods in Cutting Parameters using Non-dominated Sorting Genetic Algorithm (NSGA-II) and Micro Genetic Algorithm (MGA). International Journal of Experimental Algorithms, 2, 62-73.
[5] Hlina, J., J. Sonsky, J. Gruber and Y. Cressault (2016) Fast Tomographic Measurements of Temperature in an Air Plasma Cutting Torch. J. Phys. D: Appl. Phys., 49, 1-8.
[6] Kavka, T., A. Maslani, M. Hrabovsky, P. Krenek, T. Stehrer and H. Pauser (2013) Experimental Study on the Effect of Gas Nature on Plasma Arc Cutting of Mild Steel. J. Phys. D: Appl. Phys., 46, 1-13.
[7] Kuriakose, S. and M. S. Shunmugam (2005) Multi-objective Optimization of Wire-electro Discharge Machining Process by Non-Dominated Sorting Genetic Algorithm. Journal of Materials Processing Technology, 170, 133-141. [8] Kusumoto, K., Q. G. Chen and W. Xue (2006) Monitoring of Plasma Arc Cutting Process by Cutting Sound.
Science and Technology of Welding and Joining, 11, 701-706.
[9] Lad, A. B., A. O. Jain and D. R. Tandel (2016) Taguchi Approach for Parametric Study in Plasma Arc Machining of SS-410. International Journal for Scientific Research and Development, 4, 249-253.
[10] Lazarevic, A. (2014) Experimental Research of the Plasma Arc Cutting Process. Journal of Applied Engineering Science, 12, 291-296.
[11] Maity K. P. and D. K. Bagal (2014) Effect of Process Parameters on Cut Quality of Stainless Steel of Plasma Arc Cutting using Hybrid Approach. International Journal of Advanced Manufacturing Technology, 2, 712-723. [12] Narimanyan, A. (2009) Unilateral Conditions Modelling the Cut Front during Plasma Cutting: FEM Solution.
Applied Mathematical Modelling, 33, 176-197.
[13] Nedic, B., M. Jankovic and M. Radovanivic (2013) Quality of Cut in Plasma Arc Cutting. IMK-14 Research & Development, 19, 7-13.
[14] Patel, J. A., K. H. Patel, C. B. Prajapati, M. D. Patel and R. B. Prajapati (2015) Experimental Investigation on Effect of Plasma Arc Cutting Parameters on SS304 by Full Factorial Design. International Journal of Engineering Innovation and Research, 4, 361-364.
[15] Peko, I., B. Nedic, A. Dordevic, D. Dzunic, M. Jankovic and I. Veza (2016) Modelling of Surface Roughness in Plasma Jet Cutting Process of Thick Structural Steel. Tribology in Industry, 38, 522-529.
[16] Ramakrishnan, S. and M. W. Rogozinski (1997) Properties of Electric Arc Plasma for Metal Cutting. J. Phys. D: Appl. Phys., 30, 636-644.
[17] Ramakrishnan, S., V. Shrinet, F. B. Polivka, T. N. Kearney and P. Koltun (2000) Influence of Gas Composition on Plasma Arc Cutting of Mild Steel, J. Phys. D: Appl. Phys., 33, 2288-2299.
[18] Santhanakumar, M., R. Adalarasan and M. Rajmohan (2015) Parameter Design in Plasma Arc Cutting of Galvanised Iron Sheet using Desirability Function-based Response Surface Methodology. International Journal of Manufacturing Research, 10, 199-214.
[19] Senthilkumar, N., T. Tamilkannan, B. Thirumoorthi, G. Vighneshkumar and J. Vijayaraghavan (2016) Analysis of Process Parameters in Plasma Arc Cutting. International Journal of Innovative Research in Science, Engineering and Technology, 5, 41-47.