International Journal of Emerging Technology and Advanced Engineering
Website: www.ijetae.com (ISSN 2250-2459,ISO 9001:2008 Certified Journal, Volume 4, Issue 11, November 2014)
245
Cause & Effect Analysis for the Productivity Improvement of
TORNOS Sigma 20II: A Case Study
Dr. Mahesh M. Bhagwat
1, D. K. Desale
2, S. M. Khatib
3, A. E. Ganu
4, S. S. Avaghade
51
Associate Professor, Department of Mechanical Engineering, Rajendra Mane College of Engg. & Tech., Ambav (Devrukh) 415804, India.
2UG Student, 3UG Student, 4UG Student, 5UG Student, Department of Mechanical Engineering, Rajendra Mane College of
Engg. & Tech., Ambav (Devrukh) 415804, India.
Abstract— In this paper, an attempt has been made to improve the productivity of TORNOS Sigma 20 II with respect to following sub parts of a medical implant: Monoaxial Screw, Multiaxial Screw, Grub Screw, Cap which is a pioneering work in medical industry. TORNOS Sigma 20 II is an advanced CNC machine which is used especially for manufacturing parts having smaller D/L ratio like medical implants. Observing the need to monitor and control the processing of biomedical materials like titanium on regular basis, we make an attempt to implement the most effective quality control tool, statistical process control (SPC) techniques in the industry that is leading manufacturer in medical implants.
Keywords— Cause and effect diagram, check sheets, control charts, Pareto chart, process capability index, process flow diagram
I. INTRODUCTION
Medical implants are manmade devices, in contrast to a transplant, which is a transplanted biomedical tissue. This technology is getting better and safer thus giving hope for improved treatment. The surface of implants that contact the body might be made of a biomedical material such as titanium, silicon or apatite depending on what is most functional. The medical implant industry requires the manufacturing processes that are carried out to high tolerances and with precision within a volume production environment. Biocompatible implants use materials that are challenging to machine and this requires considerable knowledge of machining of small components. TORNOS specialises in the manufacture of machines designed to produce parts requiring extreme precision and quality. It is capable of machining parts on a movable headstock machine using machine data of a fixed headstock machine. Due to challenges and requirement of extreme precision in machining medical implants, it is difficult to get high productivity with respect to such processes. Productivity is a function of cycle time and rejection rate. Cycle time is the period required to complete one cycle of an operation or to complete a job from start to finish.
If a cycle time and rejection rate of any process decreases then productivity increases.
A. Role of SPC in Medical Implant Industry
Rejection is a result of variation. Variation concept is law of nature because no two objects in any category are the same. It may be quite large and easily noticeable, such as height of human beings, or very small, such as the weights of fibre-tipped pens or the shapes of snowflakes. When variations are very small then it may appear that items are identical; however, precision instruments will show differences. If two items appear to have the same measurement, it is due to limit of measuring instruments. As measuring instruments have become more refined, variation has continued to exist; only the increment of variation has changed. The ability to measure variation is necessary before it can be controlled.
Variation is present in every process due to the equipment, materials, environment and operator. The first source of variation is the equipment. This source includes tool wear, machine variation, work holding devices positioning and hydraulic and electrical fluctuations when all these variations are put together, there is a certain capabilities or precision within which the equipment operates. Even supposedly identical machines will have different capabilities. This becomes a very important consideration when scheduling the manufacture of critical parts.
The second source of variation is the material. Because variation occurs in the finished product, it must also occur in the raw material (which is someone else‘s finished product). Such quality characteristics as tensile strength, ductility, thickness, porosity, and moisture content can be expected to contribute to the overall variation in the final product.
International Journal of Emerging Technology and Advanced Engineering
Website: www.ijetae.com (ISSN 2250-2459,ISO 9001:2008 Certified Journal, Volume 4, Issue 11, November 2014)
246
Experiments are conducted in outer space to learn more about the effect of the environment on product variation
A fourth source is the operator. This source of variation includes the method by which the operator performs the operation. The operator‘s physical and emotional well-being also contributes to the variation. A cut figure, a twisted ankle, a personal problem, or a headache can make an operators quality performance vary.
An operator‘s lack of understanding of equipment and material variations due to lack of training may lead to frequent machine adjustments, thereby compounding the variability. As our equipment has become more automated the operator‘s effect on variation has lessened.
As mentioned above, due to the challenges and precision involved in the process it becomes necessary to monitor the process continuously on a regular basis and also to control it when any assignable variation occurs in the process. Statistical Process Control (SPC) techniques are statistical methods to monitor and control a process to ensure that it operates at its full potential. Using SPC techniques,we can predict the behaviour of our process and hence can determine whether to make changes or not.
B. SPC Techniques
SPC is one of the best tool for improving product and service quality. There are seven basic techniques
1. Pareto Analysis 2. Process Flow Diagram 3. Cause and effect Analysis 4. Check Sheets
5. Scatter Diagram 6. Control Charts
7. Histogram or Probability Plot
Pareto analysis concept is a universal concept that could be applied to many fields. He coined the phrases vital few and useful many. A Pareto diagram is a graph that ranks data classification in descending order from left to right. The vital few are on the left and useful many are on the right.
For many products and services it will be useful to construct a process flow diagram. These diagrams show the flow of the product or service as it moves through various processing operations. The diagram makes it very easy to visualise the entire system, identify potential trouble spots, and locate control activities.
A cause-and-effect (C&E) diagram is a picture composed of lines and symbols designed to represent a meaningful relationship between effect and its causes.
It was developed by Dr. Kaoru Ishikawa in 1943 and is sometimes referred as Ishikawa diagram or a fishbone diagram because of its shape. C&E diagrams are used to investigate either a ―bad‖ effect and to take action to correct the causes or a ―good‖ effect and to learn those causes that are responsible. For every effect, these are likely to be numerous cause causes are sometimes broken down into major causes of work methods, materials, measurement, people, equipment, and the environment. Other major causes could be used for service-type problems. Each major cause is then subdivided into minor causes. For example under work methods, we might have training, knowledge, ability, physical characteristics and so forth. C&E diagrams are the means of picturing all these major and minor causes.
The main purpose of check sheets is to ensure that data is collected carefully and accurately by operating personnel data should be collected in such manner that it can be easily and quickly used and analysed. The format of check sheet is individualized for is situation and designed by the project team.
The first ―statistical‖ SPC technique is the histogram. It describes the variation in the process. The histogram graphically estimates the process capability and, if desired, the relationship to the specifications and nominal (target). It also suggests the shape of the population and indicates if there are any gaps in data. The graphical technique is a plot
or picture of frequency distribution, which is
summarisation of observed values or groups of observed
values. Analytical techniques summarize data by
computing a measure of the central tendency (average, median and mode) and a measure of the dispersion (range and standards deviation). Sometimes both graphical and analytical techniques are used. A measure of central tendency of a distribution is numerical value that describes the central position of the data or how the data tend to build up in the centre.
International Journal of Emerging Technology and Advanced Engineering
Website: www.ijetae.com (ISSN 2250-2459,ISO 9001:2008 Certified Journal, Volume 4, Issue 11, November 2014)
247
Capability index value and comparing the calculated capability index to the desired index value, making a decision concerning process changes, and recommending any suggestions to reach the desired goal. The popularity of capability measures continues to increase because of the mentioned benefits. Terminology associated with this subject must be relatively easy and provide a common language for discussing quality on the shop floor with suppliers as well as with customers.
II. LITERATURE REVIEW
Besterfield[4] in chapter 18 has described the seven SPC techniques in a lucid way. Total quality management refers to an integrated approach by management to focus all the functions and levels of an organization on quality and continuous improvement. Over the years total quality management has become very important for improvement a firm‘s processing capabilities in order to sustain competitive advantages.
In this edition, considering recent development in the field of quality control, chapters on ‗Quality Circles‘ and
‗ISO: 9000 Series of Quality Systems‘ have incorporated. Mahajan [2] has fully covered the fundamental concepts of
Statistical Quality Control prescribed for Mechanical and Production Engineering.
Dr. Prajapati [1] has made an attempt to implement the some statistical process control (SPC) techniques in the industry that is offering its customers the widest and latest range of sealing solutions for various applications in the automotive industry. It is found that after implementing the SPC tools to remove the root causes, the percentage rejection is reduced from 9.1% to 5% and process capability of 0.953 is achieved.
B. P. Mahesh and M. S. Prabhuswami[3] in ―Process Variability reduction through statistical process control for quality improvement‖ has made an attempt to implement SPC techniques at soap manufacturing company to improve the quality by reducing process variability.
Ishikawa[5] has described cause and effect diagram which rightly helps to identify causes related to the effect, using the brainstorming technique.
III. INTRODUCTION OF INDUSTRY AND PRODUCTS
Adler Mediequip Pvt. Ltd. is a manufacturing company designed for production of high quality orthopaedic medical devices. Adler is the first Indian manufacturing organization in the field of orthopaedics, in each instance, to achieve the ISO 9000 certification in 1999 followed by the ISO 9001:2000 certification, the CE certification in 2003, the ISO 13485 certification in 2006 and a manufacturing licence from the Indian Government Regularity Authority in 2008.
TABLE I
Production Data in the month of May 2014
Type Cycle Time (Minutes)
Estimated Production Numbers/ Shift w.r.t. Cycle Time
Actual Production Numbers
%
Productivity
Recommended Production Numbers by TORNOS
Productivity against TORNOS Rates (%)
Monoaxial Screw
8.58 53 22 41 68 32
Multiaxial Screw
2.90 155 60 38.67 81 74.07
Caps 6.28 72 35 48.0 73 47
We deal with the following four products
Grub screw
Monoaxial screw
Multiaxial screw
Cap
A. Case study
International Journal of Emerging Technology and Advanced Engineering
Website: www.ijetae.com (ISSN 2250-2459,ISO 9001:2008 Certified Journal, Volume 4, Issue 11, November 2014)
248 B. Objectives
1.Understand the equipment & products on broad basis 2.Design & prepare format for data collection
3.Collect the live data (sufficient to analyze) – Adler RMCET to agree upon the period / no. of shift etc. 4.Compare the live data analysis with the past data 5.Present high contributors to attack – show cause
/effect analysis
6.Suggest solutions for Adler to work upon 7.Implement & monitor results
8.Collect data & compare
C. Action Plan
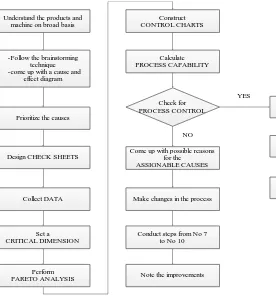
The flow chart in Figure 1 explains the action plan for our project
1. Understand the Machine And Products.
The first step is to understand the products and machine on broad basis. This is accomplished by following the user manuals for the machine and understanding the role each of the four parts have to play in the assembly.
2. Brain Storming Technique
Next step is to follow the brain storming technique and coming up with a cause and effect diagram. It is an idea generating technique that is well suited to the cause and effect diagram.
Understand the products and machine on broad basis
-Follow the brainstorming technique -come up with a cause and
effect diagram
Prioritize the causes
Design CHECK SHEETS
Collect DATA
Set a CRITICAL DIMENSION
Perform PARETO ANALYSIS
Construct CONTROL CHARTS
Calculate PROCESS CAPABILITY
Check for PROCESS CONTROL
Come up with possible reasons for the ASSIGNABLE CAUSES
Try to reduce the NATURAL CAUSES
Make changes in the process
Conduct steps from No 7 to No 10
Note the improvements
Conduct steps from No 7 to No 10
Note the improvements YES
[image:4.612.125.401.315.614.2]NO
Figure 1 Flow Chart for Action Plan
It uses creative thinking capacity of the team. Participation by every member of the team is facilitated by each member taking a turn giving one idea at a time.
3. Prioritize the Causes
Probable priority is given to various causes. It is set keeping in mind two things.
First, contribution of a cause in rejection and second the ease with which we can tackle that cause.
4. Design Check Sheets
International Journal of Emerging Technology and Advanced Engineering
Website: www.ijetae.com (ISSN 2250-2459,ISO 9001:2008 Certified Journal, Volume 4, Issue 11, November 2014)
249 5. Collect Data
First select a suitable sample size for the analysis. Then collect the data from shifts at different time and under different operator. Doing so will make the sample resemble its population .
6. Perform Pareto Analysis
Perform a Pareto analysis of rejection against the individual dimension responsible for so. Find the vital few dimensions which are responsible for major rejections.
7. Set A Critical Dimension
Amongst the vital few select a single parameter that is key contributor for the highest rate of rejection and set it as the critical dimension.
8. Construct Control Charts And Determine The Process Capability Index.
Once the data is collected and the critical dimension is set the next step is to construct control charts for the process. Also find the process capability index. This would make it clear about the state of the process i.e. whether it is in control or not.
If the process is not in control find the assignable causes with reference to the cause and effect diagram, make changes in the process and repeat the above mentioned steps to again determine the state of the process.
High Rejection Material
Method
cheap Working Environment
no
instructions inefficient programme not following recommendations thermal stresses
friction coolant
vibrations
Man improper inspetion
unskilled Tool
quality of tool tool life
Measurement unsophosticated
devices
1
fatigue 10
3
2 4
5
6
7
8
9 11
12
13
[image:5.612.86.526.316.575.2]14
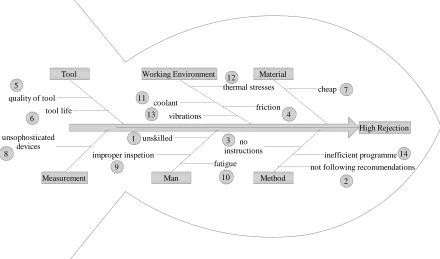
Figure 2 Cause and Effect Diagram for High Rejection
If the process is in control then try to reduce the natural causes which would further ensure that the process is not only in control but also is centred.
C. Cause and Effect Analysis
As the Ishikawa diagram is prior to any data analysis, every possible cause is taken into consideration. Various causes are prioritised keeping in mind two things. First, contribution of a cause in rejection and second the ease with which we can tackle that cause.
As we can see, there are six possible major causes responsible for high rate of rejection.
1. Man 2. Material 3. Tool 4. Method 5. Measurement
International Journal of Emerging Technology and Advanced Engineering
Website: www.ijetae.com (ISSN 2250-2459,ISO 9001:2008 Certified Journal, Volume 4, Issue 11, November 2014)
250 1. Man:
Even for a C.N.C machine operator plays an important role. If there is any variation in the process the operator should be able to understand the trend of variation and distinguish the process as in control or out of control so that he/she can then decide whether or not it is necessary to make any changes in the setting. An unskilled operator may frequently change the machine settings even when not necessary and this may lead to the process to go out of control. Another important factor is operator fatigue. Continuous working may lead to fatigue which can incur manual errors during inspection.
2. Material:
It is very important to understand that the input in our process is someone else‘s finished product. The input material i.e. titanium bars in this case is the output of some another manufacturer. So it is equally important to inspect them.
3. Tool:
In any lathe it is very important to use the tools as recommended by the machine manufacturer. Not doing so may lead to unsatisfactory results.
4. Method:
The fourth M which may be a key contributor in high rejections is METHOD. A standard operating process has to be followed while manufacturing any product. Not doing so leads to randomness in the process which may ultimately result in rejection.
5. Measurement:
Inspection is as important as production because if one cannot measure a part with required accuracy then it is equivalent to not producing the part with the desired accuracy. Sophisticated measuring devices such as the optical profile projector should be used for measuring some critical dimensions like that of internal thread.
6. Working Environment:
The working environment has both direct and in-direct contribution to high rejection. The first factor that comes under this hood is vibration. Though TORNOS has made it possible to install the machine without any need of foundation to be laid, it is important to check whether the process is affected by vibration in our working environment.
IV. CONCLUSION
All the major possible causes contributing to the high rate of rejection, as mentioned above are found and discussed with the management of an organisation. As a part of First phase of implementation, check sheets have been designed and data has been collected. As a part of proposed work, it is decided to collect data of 25 groups each having 4 parts and carry out the Pareto analysis to determine the critical dimension. Further construct the control charts and determine the process capability to check whether the process is in control or not.
If the process is not in control, then the assignable causes need to be tackled referring the Cause & Effect Diagram & if it is in control then natural causes need to be focused so that the process will not only be in control but would also be centred and this process to be conducted on regular basis so that it leads to continuous improvement which ultimately results in improved productivity.
REFERENCES
[1] Dr. D. R. Prajapati, Implementation of SPC Techniques in Automotive Industry: A Case Study, International Journal of Emerging Technology and Advanced Engineering, vol. 2, Issue 3, pp. 227-241.
[2] M. Mahajan, Statistical Quality Control, Edition: 2001, pp.122-174. [3] B. P. Mahesh and M. S. Prabhuswamy, Process Variability
Reduction through Statistical Process Control for Quality Improvement, International Journal for Quality Research, vol. 4, No. 3, 2010.
[4] Dale H. Besterfield, Total Quality Management, Revised third edition.