International Journal of Emerging Technology and Advanced Engineering
Website: www.ijetae.com (ISSN 2250-2459,ISO 9001:2008 Certified Journal, Volume 3, Issue 9, September 2013)
405
Analysis of High Efficiency Wind Energy Conversion System
Using MATLAB
Mohd Mohiuddin
1, Mohd Aleemuddin
2, Waheeda Begum
3 1,3Associate Professor, Nawab Shah Alam Khan College of Engg & Tech. Malakpet- Hyderabad, A.P, INDIA 2Associate Professor, Bandari Srinivas College of Engg & Tech, Chevella- RR. Dist, A.P, INDIA
Abstract—This paper presents the Analysis of the Wind Energy Conversion System at different speeds using MATLAB. The boost DC/DC converter, the full-bridge DC/DC inverter and bi-directional DC/DC converter is used to get high efficiency. The behavior of converters and the output of Wind Energy Conversion System at different speeds of the wind generator is analyzed. i.e. at speed when power generated by the wind generator is less, more or equal to the power required.
Keywords— MPPT, Coefficient of Performance, Tip Speed Ratio, PMSG, Wind Generator.
I. INTRODUCTION
Wind energy, one of the most effective power technologies is ready today for global deployment on a scale. Wind power can be installed far quicker than the conventional power stations. It is safe, clean, and abundant. Unlike conventional fuels, wind energy is a massive indigenous power source and is permanently available in virtually every nation in the world.
A. The Power in the wind
The wind systems that exist over the earth‘s surface are a result of variations in air pressure. These are in turn due to the variations in solar heating. Warm air rises and cooler air rushes in to take its place. Wind is merely the movement of air from one place to another. There are global wind patterns related to large scale solar heating of different regions of the earth‘s surface and seasonal variations in solar incidence. There are also localized wind patterns due the effects of temperature differences between land and seas, or mountains and valleys. Wind speed generally increases with height above ground. This is because the roughness of ground features such as vegetation and houses cause the wind to be slowed.
Wind speed data can be obtained from wind maps or from the meteorology office. Unfortunately the general availability and reliability of wind speed data is extremely poor in many regions of the world.
However, significant areas of the world have mean annual wind speeds of above 4-5 m/s (meters per second) which makes small-scale wind powered electricity generation an attractive option. It is important to obtain accurate wind speed data for the site in mind before any decision can be made as to its suitability. Methods for assessing the mean wind speed are found in the relevant texts (see the ‗References and resources‘ section at the end of this fact sheet).
The power in the wind is proportional to: • The area of windmill being swept by the wind • The cube of the wind speed
• The air density - which varies with altitude
The formula used for calculating the power in the wind is shown below:
Power = density of air x swept area x velocity cubed/2 P = ½.ρ.A.V3
Where, P is power in watts (W)
ρ is the air density in kilograms per cubic metre (kg/m3) A is the swept rotor area in square metres (m2)
V is the wind speed in metres per second (m/s)
The fact that the power is proportional to the cube of the wind speed is very significant. This can be demonstrated by pointing out that if the wind speed doubles then the power in the wind increases by a factor of eight. It is therefore worthwhile finding a site which has a relatively high mean wind speed.
B. Wind into watts
International Journal of Emerging Technology and Advanced Engineering
Website: www.ijetae.com (ISSN 2250-2459,ISO 9001:2008 Certified Journal, Volume 3, Issue 9, September 2013)
406
It can been shown theoretically that any windmill can only possibly extract a maximum of 59.3% of the power from the wind (this is known as the Betz limit). In reality, this figure is usually around 45% (maximum) for a large electricity producing turbine and around 30% to 40% for a wind pump, (see the section on coefficient of performance below). So, modifying the formula for ‗Power in the wind‘ we can say that the power which is produced by the wind machine can be given by:
PM = ½.Cp.ρ.A.V3
Where, PM is power (in watts) available from the machine
Cp is the coefficient of performance of the wind machine.
It is also worth bearing in mind that a wind machine will only operate at its maximum efficiency for a fraction of the time it is running, due to variations in wind speed. A rough estimate of the output from a wind machine can be obtained using the following equation;
PA = 0.2 A V3
Where, PA is the average power output in watts over the year
V is the mean annual wind speed in m/s
C. Principles of wind energy conversion
There are two primary physical principles by which energy can be extracted from the wind; these are through the creation of either lift or drag force (or through a combination of the two). The difference between drag and lift is illustrated by the difference between using a spinnaker sail, which fills like a parachute and pulls a sailing boat with the wind, and a Bermuda rig, the familiar triangular sail which deflects with wind and allows a sailing boat to travel across the wind or slightly into the wind.
Drag forces provide the most obvious means of propulsion, these being the forces felt by a person (or object) exposed to the wind. Lift forces are the most efficient means of propulsion but being more subtle than drag forces are not so well understood.
The basic features that characterized lift and drag are: • drag is in the direction of air flow
• lift is perpendicular to the direction of air flow • generation of lift always causes a certain amount of
drag to be developed
• with a good aerofoil, the lift produced can be more than thirty times greater than the drag
• lift devices are generally more efficient than drag devices
D. Types and characteristics of rotors
There are two main families of wind machines: vertical axis machines and horizontal axis machines. These can in turn use either lift or drag forces to harness the wind. The horizontal axis lift device is the type most commonly used. In fact other than a few experimental machines virtually all windmills come under this category.
There are several technical parameters that are used to characterize windmill rotors. The tip speed ratio is defined as the ratio of the speed of the extremities of a windmill rotor to the speed of the free wind. Drag devices always have tip-speed ratios less than one and hence turn slowly, whereas lift devices can have high tip-speed ratios (up to 13:1) and hence turn quickly relative to the wind.
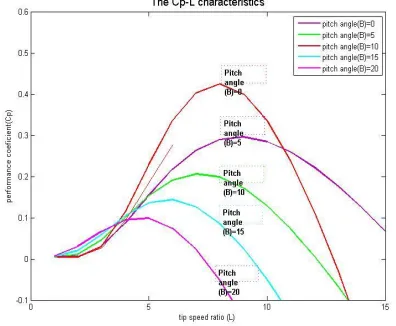
The proportion of the power in the wind that the rotor can extract is termed the coefficient of performance (or power coefficient or efficiency; symbol Cp) and its variation as a function of tip-speed ratio is commonly used to characterize different types of rotor. As mentioned earlier there is an upper limit of Cp = 59.3%, although in practice real wind rotors have maximum Cp values in the range of 25%-45%.
Solidity is usually defined as the percentage of the area of the rotor, which contains material rather than air. Low-solidity machines run at higher speed and tend to be used for electricity generation. High-solidity machines carry a lot of material and have coarse blade angles. They generate much higher starting torque (torque is the twisting or rotary force produced by the rotor) than low-solidity machines but are inherently less efficient than low-solidity machines. The wind pump is generally of this type. High solidity machines will have a low tip-speed ratio and vice versa.
There are various important wind speeds to consider: • Start-up wind speed - the wind speed that will turn an
unloaded rotor
• Cut-in wind speed – the wind speed at which the rotor can be loaded
• Rated wind speed – the wind speed at which the machine is designed to run (this is at optimum tip-speed ratio
• Furling wind speed – the wind speed at which the machine will be turned out of the wind to prevent damage
• Maximum design wind speed – the wind speed above which damage could occur to the machine
International Journal of Emerging Technology and Advanced Engineering
Website: www.ijetae.com (ISSN 2250-2459,ISO 9001:2008 Certified Journal, Volume 3, Issue 9, September 2013)
[image:3.612.43.294.152.429.2]407
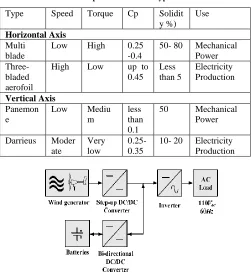
Table 1: Comparison Of Rotor Types
Type Speed Torque Cp Solidit y %)
Use Horizontal Axis
Multi blade
Low High 0.25
-0.4
50- 80 Mechanical Power
Three-bladed aerofoil
High Low up to 0.45
Less than 5
Electricity Production Vertical Axis
Panemon e
Low Mediu m
less than 0.1
50 Mechanical Power Darrieus Moder
ate
Very low
0.25- 0.35
[image:3.612.328.508.361.636.2]10- 20 Electricity Production
Fig. 1: Diagram of proposed system
The specifications for the Practical Action small wind turbine are shown in Table 2 below.
Table 2
Practical Action Small Wind Energy System For Battery Charging Turbine Specifications
Type
Rotor diameter Drive
Rated Power Start-up wind speed Cut-in wind speed Rated wind speed Furling wind speed Generator
Max. Power Output
3 blade upwind 1.7 metres Direct 100 Watts 3.5 m/s 3.5 m/s 8.0 m/s 14.0 m/s
Permanent Magnet Alternator 200 Watts
II. CHARACTERISTICS OF WIND GENERATOR
The wind turbine depends on the flow of air in a rotor consisting of two or three blades mechanically coupled to an electrical generator. It is a process of power translation from wind energy to electricity.
The difference between the upstream and downstream wind powers is actual power extracted by the rotor blades,. It is given by the following equation in units of watts[4]:
Where PM is mechanical power extracted by the rotor, that is the turbine power, and V is upstream wind velocity at the entrance of the rotor blades and VO is downstream wind velocity at the exit of the rotor blades. Multiplying the air density by the average velocity, therefore, gives the mass flow rate ( m ) of air through the rotating blades, which is as follows:
Where ρ is air density (typically 1.25 kg/m3), and A is a area swept by the rotor blades (m2). Applying (2) into (1), (1) can be written as
International Journal of Emerging Technology and Advanced Engineering
Website: www.ijetae.com (ISSN 2250-2459,ISO 9001:2008 Certified Journal, Volume 3, Issue 9, September 2013)
408
(TSR) as follows:
Where ω is the WG rotor speed of rotation (rad/s), R is the radius of the area swept by wind turbine blades.
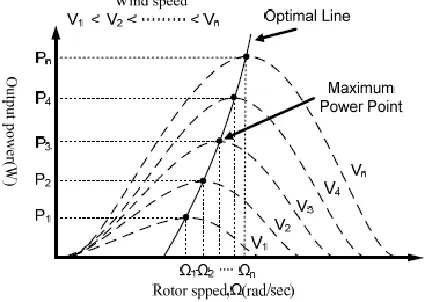
Theoretically, the maximum power point of a generator corresponds to a value of TSR at different wind speeds.
Therefore, when the wind speed is fixed, a non-linear relationship between the generator output power and the rotor speed are shown in Fig .3 [5]. A variable-speed operation of the wind generators to enables the system to effectively reduce the mechanical stress on the generator blades and gears. In addition, the design of the system structure and control strategy has a great influence on the system performance and the power output of generator [6].
Maximum Power Point Tracking, frequently referred to as MPPT, is an electronic system that operates the Photovoltaic (PV) modules in a manner that allows the modules to produce all the power they are capable of. MPPT is not a mechanical tracking system that ―physically moves‖ the modules to make them point more directly at the sun. MPPT is a fully electronic system that varies the electrical operating point of the modules so that the modules are able to deliver maximum available power. Additional power harvested from the modules is then made available as increased battery charge current. MPPT can be used in conjunction with a mechanical tracking system, but the two systems are completely different.
[image:4.612.336.548.144.295.2]TheWG power coefficient is maximized for a tip-speed ratio value λopt when the blades pitch angle is β = 0◦. The WG power curves for various wind speeds are shown in Fig. 3. It is observed that, for each wind speed, there exists a specific point in the WG output power versus rotating-speed characteristic where the output power is maximized. The control of the WG load results in a variable-speed WG operation, such that maximum power is extracted continuously from the wind (MPPT control). The value of the tip-speed ratio is constant for all maximum power points (MPPs), while the WG speed of rotation is related to the wind speed as follows:
Fig 2: The WG output power curves at various wind speeds
Table 2
The Classification System For Wind Turbines. Source: Spera, 1994 And Gipe, 1999
Scale Rotor diameter Power rating Micro Less than 3 m 50 W to 2 kW
Small 3 m to 12 m 2 kW to 40 kW Medium 12 m to 45 m 40 kW to 999
kW
Large 46 m and larger More than 1.0 MW
III. CONTROL METHODOLOGIES
A. Topologies
International Journal of Emerging Technology and Advanced Engineering
Website: www.ijetae.com (ISSN 2250-2459,ISO 9001:2008 Certified Journal, Volume 3, Issue 9, September 2013)
409
[image:5.612.96.273.232.392.2]The operation modes of the bi-directional DC/DC converter are shown in Fig. 14. The bi-directional DC/DC converter has two main switches and two main diodes. It can operate as a boost converter which supplies energy to the load when the wind generator output power is less than the required load power, and a buck converter which charges the battery from the DC bus when output power is greater than the required load power [7].
Fig 3: Operating modes of the bi-directional converter a) the boost mode b) the buck mode
B. Control Strategies
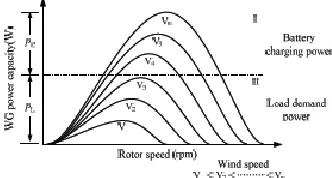
The relationship between the wind generator output power and the required load power are shown in Fig. 15.
[image:5.612.330.572.263.390.2]Regions I and II indicate the states of load capacity and generator capacity under different wind speeds.
Fig 4: The relationship between WG output power and load required power
As shown in Fig. 4, according to the conditions of system power flow and energy distribution, the system operating modes can be divided into four states as
a. Mode 1: the wind generator produces enough power to provide the load and to charge the batteries through the bi-directional converter when the wind speeds are high.
b. Mode 2: the wind speeds are lower and the power produced by wind generator is less. The batteries discharge through the bi-directional converter to provide the power to the load with wind generator.
c. Mode 3:the wind generator stops working and produces no power if the wind speed is zero. The power required by the load is provided by the batteries.
d. Mode 4:when the wind stops flowing and the energy of batteries is less than the presetting level, the system shuts down to avoid damaging the batteries and equipments.
Fig 5: The flow chart of flexile control strategy
C. Control objectives
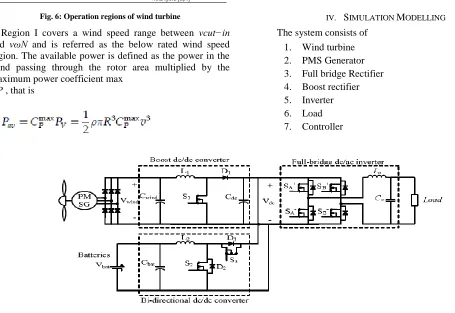
The wind turbine is an energy converter device that captures energy from the wind and converts it into useful work. Almost all of the wind energy conversion systems are connected to the grid of electric power networks. Although the main objective of wind turbine operation is to optimize energy capture, other technical and environmental objectives should also be satisfied such as mechanical loads, power quality standards, acoustic emission, obstruction, etc. (Fernando et al., 2007). These objectives are actually a tradeoff among each other. Thus, the WECS should find a well balanced compromise among them. The control objective of this chapter is emphasized on optimal energy capture. Due to the requirement in speed control, four wind velocities separate the operation into three operating regions as shown in Fig. 18, which represents a typical power curve of a wind turbine. The cut-in velocity (vcut-in) is defined as the wind speed at which the turbine starts to generate the power. Below this wind speed, it is not efficient to turn on the turbine. The transition speed
[image:5.612.91.257.502.591.2]International Journal of Emerging Technology and Advanced Engineering
Website: www.ijetae.com (ISSN 2250-2459,ISO 9001:2008 Certified Journal, Volume 3, Issue 9, September 2013)
410
[image:6.612.51.287.202.306.2]The cut-out velocity (vcut−out) is the maximum wind speed at which the wind turbine can still operate. Beyond this wind speed, the rotor has to be locked to keep the blades, the electrical generator and other components from reaching damage.
Fig. 6: Operation regions of wind turbine
Region I covers a wind speed range between vcut−in and vωN and is referred as the below rated wind speed region. The available power is defined as the power in the wind passing through the rotor area multiplied by the maximum power coefficient max
CP , that is
The control objective in region I is to extract the maximum power from the wind. Therefore, the ideal power curve in this region is a function of wind speed cube.
Region II covers a wind speed range between vωN and
vrated and is referred as a transition between maximum power curve of region I and rated power in region III. In this region, if the rotor speed is so high that it reaches the speed limit, it will generate acoustic noise.
Therefore, this region may not exist if the rotor speed is below the limit. Region III covers a wind speed range between vrated and vcut−out and is referred as the above-rated wind speed region. As the mechanical power generated by the rotor is limited, the main task of a controller in this region is to keep output at its rated power.
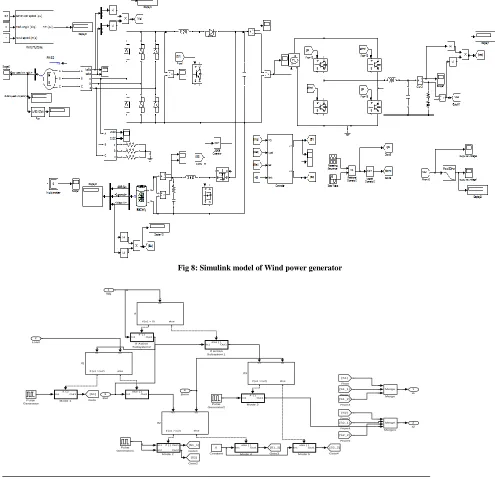
IV. SIMULATION MODELLING
[image:6.612.58.513.297.610.2]The system consists of 1. Wind turbine 2. PMS Generator 3. Full bridge Rectifier 4. Boost rectifier 5. Inverter 6. Load 7. Controller
International Journal of Emerging Technology and Advanced Engineering
Website: www.ijetae.com (ISSN 2250-2459,ISO 9001:2008 Certified Journal, Volume 3, Issue 9, September 2013)
[image:7.612.46.541.179.658.2]411
Fig 8: Simulink model of Wind power generator
Fig 9: Controller Circuit For The Simulink Model
2 s2 1 s1 Pul se
Generator2
Pul se Generator1 Pul se
Generator
else { } In1 Out1
Mode 5 else { }
In1 Out1 Mode 4
if { } In1 Out1
Mode 3
if { } In1 In2
Out1 Out2 Mode 2 else { } In1 Out1 if { }
In1 Out1 Mode 1
Merge Merge1 Merge Merge
u1 u2
if (u1 >=u2) else If3
u1 u2
if (u1 >=u2) else If2
u1 u2
if (u1 >=u2) else If1
if { } In1 Out1
If Acti on Subsystem2
else { } In1 Out1
If Acti on Subsystem1 u1
if (u1 > 0) else If
[S2_2] Goto4 [S1_2]
Goto3 [S2]
Goto2 [S1_1] Goto1 [S1]
Goto
[S2_2] From5 [S2_1] From4 [S2] From3 [S1_2] From2 [S1_1] From1 [S1] From
0 Constant 4
Bmi n 3
Bat 2
Load
International Journal of Emerging Technology and Advanced Engineering
Website: www.ijetae.com (ISSN 2250-2459,ISO 9001:2008 Certified Journal, Volume 3, Issue 9, September 2013)
412 V. RESULTS &INVESTIGATION
Fig. 10 shows the output power of the wind generator curves at various wind speeds. The wind generator output power increases first and then decreases when the wind speed is fixed. The maximum values of curves represent their maximum power points.
The simulation results for the model discussed in previous chapter are shown below
Fig.11 shows the output power of the wind generator curves at various wind speeds. The wind generator output power increases first and then decreases when the wind speed is fixed. The maximum values of curves represent their maximum power points.
[image:8.612.326.569.138.256.2]The wave forms of voltage of the wind power generator and speed of wind turbine, voltage of boost converter are shown below
[image:8.612.322.573.280.704.2]Fig 10: Wind turbine Speed and power curve
Fig 11: Wind speed
Fig 12: Voltage and current waveform from the wind turbine
Fig 13: Wind system output voltage
Fig 14: Converter output voltage
[image:8.612.68.266.338.501.2] [image:8.612.48.292.532.661.2]International Journal of Emerging Technology and Advanced Engineering
Website: www.ijetae.com (ISSN 2250-2459,ISO 9001:2008 Certified Journal, Volume 3, Issue 9, September 2013)
413
VI. CONCLUSION
A 200 W system which composes of power converters for wind generator with the proposed control method has been constructed. Experimental results show that the flexible control strategy is able to make the converters operating with high performance. The multi-stage current charging method is used to charge the batteries and the output power of wind generator is increased by the MPPT algorithm. At various wind speeds, the system can use the battery for energy storage or power compensation to keep the load voltage and load current stable.
It can be concluded from the first experimental results that the MPPT with torque reference offers fastest tracking time in the below-rated wind speed region and the MPPT with fuzzy logic is favored in terms of power fluctuation and tracking time in the above-rated wind speed region. Although the second MPPT algorithm has the slowest tracking time and the highest rotational speed fluctuation, it is attractive for a small amount of computational resource and therefore low cost for implementation. Although the FLC possesses many advantages as described above, the implementation of the FLC is quite complicated, especially in the software part. For example, the implementation of the FLC with 140 rule base requires 1) plant knowledge to construct the rule base, 2) simulation process before implementation and 3) large memory storage for control program.
The second experimental results confirm that a developed grid connected converter with an MPPT algorithm can deliver the output power with low input current ripple and high gain. The system can track the maximum output power with step and various wind speeds and can regulate the dc bus voltage with nearly sinusoidal line side current, near-unity power factor and low harmonic distortion. The proposed methodology can be extended to develop an adaptive FLC algorithm by the knowledge-base system for data recording in intelligent updated memory (IUM) to reduce the generator current and recording time.
By applying the MPPT controller in the initial mode of tracking, the maximum power operating points can be located. These data will be stored in an IUM. When the data in the IUM cover a specified range in the below-rated wind speed region, the adaptive FLC will use these data as an input to maximize the output power within the range. The adaptive FLC, which consists of a MPPT controller, a torque observer, an IUM recorder and a FLC can be implemented on a low cost, high performance digital signal controller board with a microcomputer for data acquisition and control verification.
REFERENCES
[1] Chih-Chiang Hua, and Chien-Hung Cheng ―Design and implementation of power converters for wind conversion systems‖ The 2010 International Power Electronics Conference,
978-1-4244-5393-1/10/$26.00 ©2010 IEEE
[2] EWEA and Greenpeace, ―Wind Force 12,‖ 2005.
[3] Y. M. Chen, Y. C. Liu, and C. C. Cheng, ―Multi-Input Inverter for Grid-Connected Hybrid PV/Wind Power System,‖ IEEE Transactions on Power Electronics, Vol. 22, No. 3, pp. 1070-1077, May 2007.
[4] A. M. De. Broé, S. Drouilhet and V. Gevorgian, ―A Peak Power Tracker for Small Wind Turbines in Battery Charging Applications,‖ IEEE Transactions on Energy Conversion, Vol. 14, No. 4, pp. 1630-1635, December 1999.
[5] M. R. Patel, ―Wind and Solar Power System,‖ 2nd, CRC press, 2006.
[6] K. Tan and S. Islam, ―Optimum Control Strategies in Energy Conversion of PMSG Wind Turbine System Without Mechanical Sensors,‖ IEEE Transactions on Energy Conversion, Vol. 19, No. 2, pp. 392-399, June 2004.
[7] J. G. Slootweg and W. L. Kling, ―Is the Answer Blowing in the Wind?‖ IEEE power & energy magazine, November/December 2003.