International Journal of Emerging Technology and Advanced Engineering
Website: www.ijetae.com (ISSN 2250-2459, ISO 9001:2008 Certified Journal, Volume 8, Issue 2, February 2018)
85
Evaluation of M35 And M40 Grades of Concrete Designed by
DOE and USBR Methods of Mix Design Using Regular and
Replaced Aggregates
Sharandeep Singh
Civil Engineer at DIPS Polytechnic
Abstract— This paper presents a comparison of DOE and USBR methods of concrete mix design, using different types of aggregates The M35 and M40 grades of concrete have been designed for comparison using crushed aggregates, rounded aggregates and stone dust separately. Designing same standard mixes by both methods resulted in complete comparison in terms of proportioning parameters as per different mix design methods, thus defining the effect of variation in proportion and shape of aggregates, on the properties of concrete. In this experimental study the strength, toughness and other mechanical properties of concrete, designed as per different mix design methods are compared. In this paper, effects of aggregate types on mechanical properties of concrete are investigated. For this purpose, factors effecting concrete strength as water and cement are kept constant and concrete mixtures have been prepared by using three types of aggregates (crushed and rounded as coarse aggregate and stone dust as fine aggregates). From experimental investigations it is clear that the USBR method came out as the more compatible, when compared in terms of strength and toughness but the method is little more expensive than DOE method. The use of stone dust as fine aggregates came out as more economic and prominent, as compared to conventional sand in determining mechanical properties of concrete except toughness of concrete.
Keywords—Mix design, Compressive strength, Flexure, Split Tensile, abrasion,replaced etc..
I. INTRODUCTION
The process of selecting suitable ingredients of concrete and determining their relative amounts with the objective of producing a concrete of the required, strength, durability, and workability as economically as possible, is termed the concrete mix design. The proportioning of ingredient of concrete is governed by the required performance of concrete in 2 states, namely the plastic and the hardened states. The different mix design methods are mostly based on empirical relations, charts, graphs, and tables developed through extensive experiments and investigations using locally available materials.
International Journal of Emerging Technology and Advanced Engineering
Website: www.ijetae.com (ISSN 2250-2459, ISO 9001:2008 Certified Journal, Volume 8, Issue 2, February 2018)
86
Properly designed mix for a particular application, keeping in mind the specific requirements (workability, durability and strength, knowing the source and properties of aggregates, type of cement) effect a substantial saving in cost. So while comparing different methods of concrete mix design using different types of aggregates, economy is a factor which in addition to other properties shall be emphasized upon.II. EXPERIMENTAL PROGRAM
The experimental program was planned to study the influence of Change in proportioning and shape of aggregates on the properties of concrete when designed with different mix design methods. The main objectives of the present research are listed beneath
To design the mixes for M35 and M40 grades by DOE and USBR method using crushed aggregates rounded aggregates and stone dust separately.
To test and compare the concrete specimens produced for properties i.e. Compressive strength, Flexural strength, Split tensile and Abrasion.
To compare the results for inferring the critical method in terms of strength parameters and cost analysis.
The experimental program consisted of laboratory test on concrete designed as per USBR, and BRITISH mix design method to characterize and compare the properties such as compressive strength, flexure strength, split tensile strength, and abrasion. For this purpose cubes, beams and cylinders of M35 and M40 grades of concrete designed by USBR and BRITISH Mix design methods were cast and tested for the respective properties after a curing period of 7 and 28. For each curing age a set of three samples of each type was cast. The experimental program was divided into three groups. Group-1 included the samples of M35 and M40 designed by USBR and DOE methods using crushed aggregates. The group-2 included similar samples designed by using rounded aggregates and group-3 included the samples designed by replacing sand with stone dust. In all cases the cement content and water/cement ratio was fixed, it was only proportioning of aggregates that were altered as per mix design methods, i.e. cement content was 415 kg for M35 and 430 kg for the M40.Similarly w/c ratio was 0.40 for M35 and 0.38 for M40 grade of concrete.
III. DETAILS OF MATERIAL AND MIX DESIGNS
Portland pozolona cement (specific Gravity = 3.0) was used to carry out the research work. In this study the locally available sand was used.
Its various physical properties were tested as per IS: 383 – 1970. The crushed and rounded coarse aggregates used in this investigation were 20 mm and 12.5 mm graded aggregates. The aggregates were made free from silt content before use. The physical properties of aggregates are listed as
Fineness modulus of fine aggregates = 2.4, Grading zone of fine aggregates = zone 4, zone of stone dust = zone 3, Specific gravity of fine aggregates = 2.54, Specific gravity of coarse aggregates = 2.72, specific gravity of rounded aggregates = 2.66, specific gravity of stone dust = 2.65 Grading ratio of 20 mm aggregates to 12.5 mm = 2:1, Unit weight of Coarse aggregates = 1450
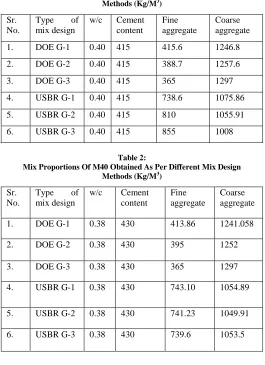
[image:2.612.312.577.345.710.2]Using these aggregates M35 and M40 grades of concrete were designed. The proportions obtained using the design mix are given in the following tables
Table 1:
Mix Proportions Of M35 Obtained As Per Different Mix Design
Methods (Kg/M3)
Sr. No.
Type of mix design
w/c Cement content
Fine aggregate
Coarse aggregate
1. DOE G-1 0.40 415 415.6 1246.8
2. DOE G-2 0.40 415 388.7 1257.6
3. DOE G-3 0.40 415 365 1297
4. USBR G-1 0.40 415 738.6 1075.86
5. USBR G-2 0.40 415 810 1055.91
[image:2.612.311.576.356.708.2]6. USBR G-3 0.40 415 855 1008
Table 2:
Mix Proportions Of M40 Obtained As Per Different Mix Design
Methods (Kg/M3)
Sr. No.
Type of mix design
w/c Cement content
Fine aggregate
Coarse aggregate
1. DOE G-1 0.38 430 413.86 1241.058
2. DOE G-2 0.38 430 395 1252
3. DOE G-3 0.38 430 365 1297
4. USBR G-1 0.38 430 743.10 1054.89
5. USBR G-2 0.38 430 741.23 1049.91
International Journal of Emerging Technology and Advanced Engineering
Website: www.ijetae.com (ISSN 2250-2459, ISO 9001:2008 Certified Journal, Volume 8, Issue 2, February 2018)
87
IV. MIXING, CASTING AND CURING OF SPECIMENMaterials were mixed in a pan mixer. All cubes, beams and cylinders were cast in the standard metallic moulds and vibrated to obtain required sample size. The moulds were cleaned off dust and oil was applied on all sides of moulds before concreting the sample. Thoroughly mixed concrete was poured into the moulds in three equal layers and the moulds were placed on vibrating table for a small period. Excess concrete is removed with a trowel and the top surface is finished with a smooth surface.
After 24 hour protection in mould the samples were demoulded and put in curing tank for the respective periods of 7and 28. A set of 3 samples was prepared for each stage curing. The temperature of curing tank was kept at 25° ± 2° c for 28 days.
V. TESTING
The following test procedures were conducted in order to compare the desired properties of concrete designed by different methods.
A.Compression Test
The compressive strength of different samples was tested after 7and 28 days of curing. The 150 mm cubes were tested on compression testing machine under continuously increasing load @ 14Mpa/min.
1.Observations
In comparison, of results it was observed that for M35 all cubical specimens of concrete tested achieved their target mean strength irrespective of the mix design method and type of aggregates used. Nevertheless, the concrete designed as per DOE method in G-2 attained the highest compressive strength after 28 days, which was 123.31% of the target strength required. The DOE method achieved almost same compressive strength as that of USBR method in G-1 samples, whereas in G-3 samples USBR method exhibits least compressive strength. For M40 grade of concrete the DOE method in G-3 attained the highest compressive strength which is 128.40% of the target mean strength. Even the outcomes of G-1 and G-2 cannot be overlooked for compressive strength, when designed either with DOE or USBR method. Presumably, the cause of increased compressive strength in G-3 samples is better compaction level and more cohesive mix with lesser voids due to presence of stone dust as fine aggregates
Chart 1: Test Results for Compressive Strength of M35
Chart 2: Test Results for Compressive Strength of M40
B.Flexure test of beams
The flexural strength of different samples was tested after 7, 28 and 56 days of curing. The beams were tested on a flexure testing machine under continuous increasing load @ 1kN/min. From experimental investigations, it was observed that flexure strength attained by concrete designed as per USBR method increased with time and is highest among the methods used after 28 days of curing. After 28 days of curing USBR methods attain a higher amount of flexural strength than DOE method irrespective of the type of aggregates used except the DOE in case of G-1 samples. The cause of better performance of USBR method in flexure is more cohesive mix resulting in stronger aggregate-aggregate bonding. The type of aggregate which determines its engineering properties also influences flexure strength.
42 44 46 48 50 52 54
G-I G-2 G-3
DOE 48.8 53.33 51
USBR 48.88 48.44 47
STRE
N
GTH
IN
N
/m
m
2
0 10 20 30 40 50 60 70
G-I G-2 G-3
DOE 48.8 55.55 62
USBR 49.7 49.7 57.7
S
T
R
EN
G
T
H
IN
N
/m
m
International Journal of Emerging Technology and Advanced Engineering
Website: www.ijetae.com (ISSN 2250-2459, ISO 9001:2008 Certified Journal, Volume 8, Issue 2, February 2018)
88
The primary attributes of crushed aggregates that are of importance are the interlock and better quality of paste - aggregate bond. Hence, the DOE method with a larger amount of coarse aggregates exhibit greater flexure strength But when crushed aggregates are replaced with rounded aggregates the paste -aggregate bond became less prominent. Then, the grading of aggregates plays a vital role in determining the flexure strength. The higher amount of fines present in USBR method affects the level of compaction of the mix. Presumably, a well compacted mix will be able to withstand flexural forces better.Chart 3: Test Results for Flexural Strength of M35
Chart 4: Test Results for Flexural Strength of M40
C. Split tensile strength
The split tensile strength of different cylinders was tested after 28 days of curing. The cylinders were tested on compression testing machine when loaded in a split tensile testing assembly under monotonic loading @ 1kN/min.
After analyzing the outcomes of split tensile test of concrete it was observed that for M35 grade, the concrete designed with USBR method using stone dust exhibits maximum split tensile strength and that of by DOE method using rounded aggregates has the least among the three groups used for comparison. The split tensile strength of USBR of G-1and DOE of G-2 is almost same. For M40 grade the DOE method shows an increment in the split tensile strength as compared to USBR method in case of G-1 and G-2 samples and has achieved highest strength among the groups compared. Whereas, in G-3 samples concrete designed as per DOE method showed a fall in the split tensile strength as compared to M35. As the primary attributes of crushed aggregates that are of importance are the interlock and better quality of paste - aggregate bond. Presumably, the higher content of coarse aggregate in DOE method is responsible for higher values of split tensile strength.
Chart 5: Test Results for Split Tensile Strength of M35
Chart 6: Test Results for Split Tensile Strength of M40
0 2 4 6 8
G-I G-2 G-3
DOE 6.04 4.8 5.9
USBR 5.28 5.89 8
S
T
R
EN
G
T
H
IN
N
/m
m
2
0 2 4 6 8 10
G-I G-2 G-3
DOE 6.56 4.45 6.8
USBR 6.8 5.9 8.5
ST
R
EN
G
TH
IN
N
/m
m
2
0 1 2 3 4 5
G-I G-2 G-3
DOE 4.14 3.18 4.45
USBR 3.18 4.18 3.8
S
T
R
EN
G
T
H
I
N
N
/mm
2
0 1 2 3 4 5
G-I G-2 G-3
DOE 4.77 4.45 3.82
USBR 4.04 3.1 4.14
S
T
R
EN
G
T
H
I
N
N
/mm
International Journal of Emerging Technology and Advanced Engineering
Website: www.ijetae.com (ISSN 2250-2459, ISO 9001:2008 Certified Journal, Volume 8, Issue 2, February 2018)
89
D.Abrasion test values for M35 and M40 grade of concrete To compare the toughness of concrete, when designed with different prevalent mix design methods, abrasion test was performed on concrete samples (70*70*25 mm). The loss of thickness was observed in each case. From the experimental investigation, it is clear that the concrete mix designed with USBR method Show an increase in the toughness of concrete for G-1 and G-2 but with stone dust an increased pattern of abrasion is observed with USBR method. Moreover, the M40 is more resistant to abrasion than M35 irrespective of mix design method used. The concrete designed with USBR method using crushed aggregates came out as the toughest one as the loss of thickness is least in this case. It is likewise noted that there is a reduction in the loss of thickness in the concrete samples having a larger amount of FA except the concrete designed with stone dust as fine aggregates I which DOE method showed the least abrasion. As the ratio of F.A increases the cohesiveness and compaction level of mix obtained also increases resulting in more tough concrete.
Chart 7: Test Results for Abrasion for M35 grade of Concrete
Chart 8: Test Results for Abrasion for M40 grade of Concrete
E.Cost comparison of various mix design methods
The cost comparison in this research is based upon the quantity of aggregates (fine and coarse) used in various mix design method, as the cement content is fixed for all the methods that is 415 kg/m3 for M35 grade and 430 kg/m3 for M40 grade of concrete. The cost of aggregates used to carry out the comparison is computed on the basis of the cost of locally available aggregates without the transportation cost which was (Rs. 1078) for one cubic meter of crushed and rounded aggregates and (Rs.539) for one cubic meter of stone dust. The comparison is executed for one cubic meter of concrete designed.
As the quantity of aggregates used in USBR method is more as compared to DOE method (proportions obtained as per mix design), so the cost of concrete designed as per USBR method automatically goes up. Hence the USBR method came out as more expensive than DOE method. Moreover when different types of aggregates used are compared the concrete designed as per DOE method using Stone dust came out as least expensive and concrete designed as per USBR method using crushed aggregates results as most expensive.
VI. CONCLUSION
Various literatures have been reviewed in order to generalize the effect of change in proportions of aggregates, on the properties of concrete when designed by different mix design methods. The experimental program was carried out to compare DOE and USBR method of mix design using crushed aggregates, rounded aggregates and stone dust separately. M35 and M40 grades of concrete were used to carry out the comparison based on the mechanical properties of concrete. It was observed that both methods achieved the target mean strength either, in case of M40 or M35 for all the groups defined. Although there are fluctuations for different properties of concrete when designed with different mix design methods using different type of aggregates, the overall comparison shows that the USBR method comes out with the best results. For compressive, flexural and split tensile strength the USBR method designed using stone dust as fines exhibited maximum strength except the abrasion in which USBR method designed with crushed aggregates and sand delivers toughest concrete. However, the outcomes of concrete designed as per DOE method using crushed aggregates/rounded aggregates/stone dust cannot be overlooked. USBR method came out as the more compatible, when compared in terms of strength and toughness but the method is little more expensive than DOE method.
0 0.2 0.4 0.6 0.8 1 1.2
G-I G-2 G-3
DOE 0.83 0.61 0.43
USBR 0.261 0.42 1.03
L
O
S
S
I
N
T
H
IC
K
N
ESS
I
N
mm
0 0.2 0.4 0.6 0.8 1 1.2
G-I G-2 G-3
DOE 0.694 0.41 0.43
USBR 0.261 0.51 1.04
L
O
S
S
I
N
T
H
IC
K
N
ESS
I
N
International Journal of Emerging Technology and Advanced Engineering
Website: www.ijetae.com (ISSN 2250-2459, ISO 9001:2008 Certified Journal, Volume 8, Issue 2, February 2018)
90
The use of stone dust as fine aggregates came out as more prominent, as compared to conventional sand in determining mechanical properties of concrete except toughness of concrete. The DOE method has been recognized for delivering optimum performance in a relative economic budget except when toughness of concrete is not a mandatory concern. So in daily concrete practice where only strength and durability is required in a comparatively low budget, concrete designed as per DOE method using stone dust should be practiced with the stipulation that the toughness of concrete is not a prime requirement, and where site conditions require strength, toughness and durability side by side irrespective of the budget, the USBR method can be practiced for optimum results.REFERENCES
[1] GambhirM. L.,‖Concrete Technology‖, Tata McGraw Hill, fifth edition-2013,
[2] M.C. Nataraja and LelinDas,― Concrete mix proportioning as per IS 10262:2009 – Comparison with IS 10262:1982 and ACI 211.1-91‖. [3] Neville, A. M.,‖ Concrete Technology‖, Fourth edition, Pearson
Education,New Delhi.
[4] Nataraja, M.C, Lelin Das and N. Richard Sandeep ―Comparison of IndianStandard Draft Method and ACI Method of Concrete Mix Proportioning‖,Second national seminar on advances in materials and structure, IIT, Chennai,India
[5] SiaKeeSiegn, ―Comparaive study of reinforced concrete design of column between American code (ACI 318-05) and British standards (BS 8110-97)‖, University Malasyia, 11 November 2010.
[6] Amarjit Singh and Kamal Gautam, ―Comparasion of IS and ACI methods for absolute volume concrete mix design‖, 30th Conference our world in concrete and structures: 23 - 24 August 2005, Singapore.
[7] C.K. Jeevendra and Mishra S.P.,― Comparison between IS, BRITISH and ACI methods of concrete mix design and proposed a function equation based design‖,IJCSEIERD, Vol. 2, Issue, 1 March 2012.
[8] ―Concrete‖, Oxford university press,2013
[9] Aginam C. H., Umenwaliri S. N. and Nwakire, C. ,―Influence of mix design methods on compressive strength of concrete‖,ARPN Journal of Engineering and Applied Sciences, Vol. 8, No. 6, June 2013. [10] PopatD. Kumbhar, Pranesh B. Murnal,―Assessment of suitability of
existing mix design methods of normal concrete for designing high performance concrete mixes‖, International Journal Of Civil and Structure Engineering,Volume 3, No 1, 2012.
[11] K. Baskaran and K. Gopinath,―Study on Applying of ACI and DoE Mix Design Methods for Paving Blocks‖, Annual Transactions of IESL, pp. [127-134], 2013
[12] Dr. Deepa A Sinha, ―Compressive Strength of Concrete using DifferentMix Design Methods‖, Indian Journal of Applied Sciences, Volume 4,Issue 7, July 2014
[13] Dimitri V. Valand Mark G. Stewart, ―Life-cycle cost analysis of reinforced concrete structures in marine environments‖, Structural Safety, Volume 25, Issue 4, October 2003.
[14] Ellices M. and Rocco C.G., ―Effect of Aggregate Size on the Fracture and Mechanical Properties of a Simple Concrete,‖ Engineering Fracture Mechanics, 75(13), pp 3839-3851, 2008. [15] Kannak A. and Kurama Y.C., ―Effectsof Coarse Aggregate types on
the Concrete,‖ International Journal of Engineering Research and Applications (IJERA), 2013.
[16] Erdem R. Tugrik and Kozanoglu Celal, “Investigation of Crushing Type of Concrete Aggregates on Mechanical Properties of Concrete,” International Journal of Materials Engineering, 2012. [17] Ozturan Turan et. Al., ―Effect of Coarse Aggregate Type on