Largescale physical modelling of soil
filled masonry arch bridges
Augusthus Nelson, L, Swift, GM, Melbourne, C and Smith, C
http://dx.doi.org/10.1680/jphmg.16.00037
Title Largescale physical modelling of soilfilled masonry arch bridges Authors Augusthus Nelson, L, Swift, GM, Melbourne, C and Smith, C
Type Article
URL This version is available at: http://usir.salford.ac.uk/id/eprint/41572/ Published Date 2017
USIR is a digital collection of the research output of the University of Salford. Where copyright permits, full text material held in the repository is made freely available online and can be read, downloaded and copied for noncommercial private study or research purposes. Please check the manuscript for any further copyright restrictions.
LARGE SCALE PHYSICAL MODELLING OF
SOIL-FILLED MASONRY ARCH BRIDGES
Levingshan Augusthus-Nelson1, Gareth Swift2, Clive Melbourne1,
Colin Smith3 and Matthew Gilbert3
ABSTRACT
The presence of soil backfill has been shown to have a significant influence on the load-carrying capacity of masonry arch bridges, with the soil fill providing a number of important functions, including inter alia, the distribution of surface loads and passive resistance to arch deformation during loading. Large-scale physical modelling allows high quality data to be collected under controlled conditions, while enabling essential aspects of the interaction between the soil fill, the masonry arch and the abutments to be observed. This paper considers the design and construction of a unique test facility that allows large-scale soil filled masonry arch structures to be studied under both quasi-static and cycling loading regimes. Key challenges that needed to be overcome to develop this facility are presented and discussed.
Keywords: Masonry arch, physical modelling, cyclic loading, soil-structure in-teraction.
INTRODUCTION
The masonry arch bridge can be considered as a highly effective soil-masonry composite form, the behaviour of which has in the last 25 years become the subject of in-depth research. At the University of Salford research has focussed primarily on the development of a large-scale experimental facility, driven by the desire to gain a better understanding of the physical behaviour of masonry arch bridge structures in order to facilitate the development and validation of numerical analysis models. Initially this research focused on the behaviour of arch barrels, subjected to quasi-static and then cyclic loading regimes. More recently investigations have turned to assessing the influence of soil backfill on
1School of Computing, Science and Engineering, University of Salford, Salford M5 4WT,
United Kingdom. E-mail: [email protected]
2School of Earth and Environmental Sciences,University of Portsmouth, Portsmouth PO1
2UP, United Kingdom. E-mail: [email protected]
3Department of Civil and Structural Engineering, University of Sheffield, Sheffield S1 3JD,
bridge behaviour. As an integral part of this continuing programme of research, a major experimental facility has been developed to allow the construction and testing to failure of full-scale, soil-filled, masonry arch bridges. The development and subsequent significant modification to this facility is the main focus of the present paper.
BACKGROUND
Laboratory model bridges enable detailed measurements to be taken but do not necessarily adequately represent the complexity of real bridges. Although load tests on bridges in the field can provide important information about real response, often very little useful information is made available apart from the geometry and load vs. deflection response (e.g. as in the case of the tests carried out by the United Kingdom (UK) Transport Research Laboratory (TRL) in the 1980s and 1990s (Page 1993)). Even when more measurements are taken, the complex interactions involved mean that the data collected can be difficult to interpret.
Full-scale physical modelling in the laboratory offers a compromise in that the model test arrangement can be designed to ensure essential aspects of the interaction between the soil fill, the masonry arch barrel and the abutments are properly modelled, and that high quality data is captured.
Specifically, there has been limited work on investigating the influence of the dynamic effects of working loads on the response of the masonry arch bridge system, and the relationship between loading history and bridge capacity has been little studied in the literature, except in the case of bare arch barrels. A key required feature of this facility is to enable researchers to investigate the permissible limit state (PLS), the state beyond which incremental damage occurs, and its relationship with the ultimate limit state (ULS).
GENERAL ARRANGEMENT
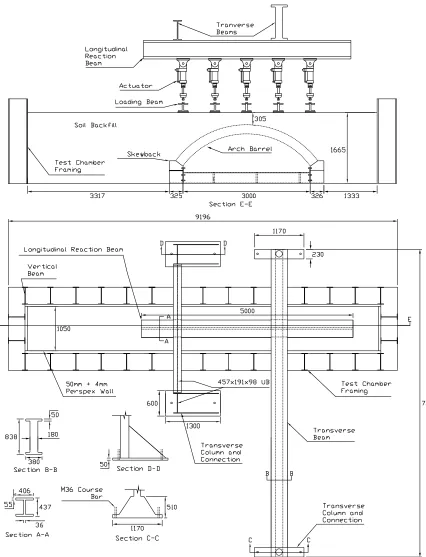
In order to simplify interpretation, in the laboratory the bridge system can be reduced from a three-dimensional system to a two-dimensional system, with a central portion of a bridge (only) modelled under essentially plane strain con-ditions. This allows the composite behaviour of the masonry arch barrel and surrounding soil fill to be modelled in the longitudinal plane (i.e. parallel to the arch span). In order to achieve this the spandrel walls can be excluded and the masonry arch barrel and soil fill material contained within a chamber, with very stiff, low friction side walls (see Figure 1).
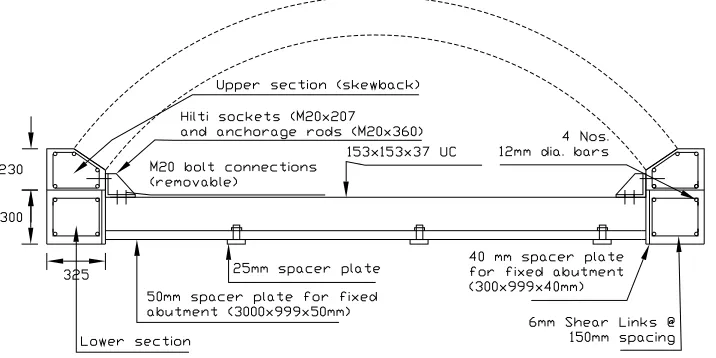
Details of the test chamber incorporating the aforementioned features, and designed to house soil-filled masonry arch bridges have been described elsewhere (Callaway 2007; Swift et al. 2013); however, the essential elements will also be briefly outlined here. The geometry and dimensions of the test rig are shown in Figure 3.
FIG. 1: The masonry arch test chamber
during the 1990s (Melbourne and Gilbert 1995), to allow results to be directly compared. These tests involved the use of 3m span, 4:1 (span:rise), segmental arch barrels.
The test chamber itself was constructed using heavy duty steel I-sections to provide adequate stiffness to enable essentially plane strain conditions to be maintained under load. The total limit of lateral deflection was stipulated to be
<1mm. It was also considered important that end effects should not influence test results, taking into account the anticipated soil-arch failure mechanisms and potential associated deformations of the soil. However, given the length of the test chamber required to satisfy this condition, it was necessary to include several tie bars across the top and bottom of the steel frame to provide adequate lateral stiffness.
One of the principal design requirements for the test chamber was the ability to monitor soil kinematics during load testing, by capturing digital images. As a consequence, one side-wall of the tank was constructed using 50mm thick, clear cast, acrylic sheets (the other side was constructed using 50mm thick plywood sheets). The clear acrylic material could be readily drilled and cut on site, whilst still satisfying the design requirement for transparency. The sheeting thickness of 50mm ensured minimal side-wall deflections under loading. Both walls had a further 6 mm ‘sacrificial’ layer of acrylic sheet placed on their internal faces in order to protect the thicker acrylic windows, as it was found that in smaller-scale tests compaction of the soil immediately adjacent to the clear acrylic windows could cause surface damage. The sacrificial sheets could be replaced between tests with little cost and effort.
were considered and evaluated using a small-scale test rig, with the use of a thin latex sheet greased with a silicon-based sealant providing the lowest coefficient of friction. As a consequence, the full faces of the 6 mm Perspex sheets were covered in a layer of silicone grease followed by a 0.33 mm thick latex sheet. For normal stresses greater than 10 kPa, it has been reported that the application of grease gives interface friction angles of less than 2 degrees (Fang et al. 2004).
The latex was attached using strips of tape at the top of the test chamber, and although some care was required in the placement and compaction of soils within the chamber, minimal damage to the latex was observed during the filling process, indicating that this was a simple yet effective means of placing the latex. The use of latex did however reduce the visibility of the fill material through the acrylic windows. As a consequence, measures had to be taken in order to ensure that the images captured had sufficient detail to allow subsequent analysis and interpretation. The measures adopted depended on the nature of the backfill being used in the tests. Two types of backfill have been used to date: a coarse grained backfill, comprising graded, crushed limestone, and a fine grained natural clay. In tests using granular backfill, coloured particles were incorporated near the transparent front face of the chamber to provide adequate contrast. In the case of fine grained backfill, texture was provided by incorporating larger, lighter coloured, particles near to the transparent front face of the chamber. In addition, powerful floodlights were used to illuminate the transparent windows to reduce any problems with ambient lighting and to reduce reflections.
REACTION FRAMES
Early tests (Smith et al. 2006) using the test chamber employed a simple reaction frame as it was initially anticipated that the chamber would be used primarily for quasi-static load tests to failure. However, with the need to examine the behaviour of masonry arch bridge structures under more complex loading conditions, a more adaptable reaction frame system was subsequently required.
Two parallel portal frames approximately 2 m apart and rigidly connected by a cross beam were each designed to carry a 500 kN reaction load; these are shown in Figure 2. The portal frames connect to a structural strong floor with eight holding down bolts each having a capacity of 250 kN. The stiffness of the reaction frame system was designed to be significantly higher than the stiffness of the masonry arch bridge and surrounding soil material.
A longitudinal beam is attached beneath the portal frames to which the hy-draulic actuators and associated manifold are then mounted.
ABUTMENTS
FIG. 3: Abutment design details (supporting 3m span arch barrels)
sliding. The abutments were therefore designed and constructed in two parts: a lower section which was bolted directly to the structural strong floor, and a separate upper section, the ‘skewback’. During construction a release agent can be applied to the top surface of the lower section prior to the application of a layer of mortar, onto which the upper section is then placed. The upper section is therefore free to slide and/or rotate once the (very limited) initial shear bond and frictional resistance on this interface are overcome. The design allows the bridge to be tested with each of the skewbacks being fixed or free to slide, depending on the test conditions required.
ARCH BARREL
In order to carry out material characterisation, appropriate samples are prepared at the time of construction of a test bridge; these include masonry unit prisms to estimate the initial shear strength of mortar joints and compressive strength, and concrete cubes to estimate the compressive strength of the mortar.
One problem affecting brickwork arch bridges is the issue of ring separation, where the arch rings become separated, reducing the ultimate load carrying ca-pacity (Gilbert and Melbourne 1994; Brencich and Sabia 2008; Diamanti et al. 2008). Therefore, in the bridges tested to date, alternate masonry courses com-prise ‘headers’, used to prevent the occurrence of ring-separation during testing and to reduce the number of test parameters involved.
To accommodate earth pressure cells cavities can be formed in the extrados, along the bridge centreline; twelve such cavities are present in the default config-uration.
Following construction of the arch barrel, the walls of the test chamber are placed in position; however, the average width of the test chamber is slightly greater than that of the arch barrel itself. Therefore, in order to prevent fill from subsequently falling through the gap between the arch barrel and the test chamber walls, strips of closed cell foam can be hot-glued to the edges of the extrados of the barrel so as to span the gap. The flexible foam accommodates minor lateral arch movements while retaining the fill above, and therefore allows “free” movement of the arch barrel during load testing.
ARCH BACKFILLING
To date coarse grained granular backfill (MOT Type 1 graded crushed lime-stone) and a fine grained soil backfill (clay) have been used. The placement and compaction of these materials at this scale presents some logistical challenges and this section highlights the procedures adopted.
A large hopper suspended from an overhead crane above the test chamber was found to be the most practical way of transferring the soil backfill materials. The intention was to provide a uniform and homogenous backfill material, and so careful monitoring of the compaction procedure, using the moisture content and the as-placed density, is essential in order for this to be achieved.
In order to achieve the maximum density, it was found that compacting the backfill in 120 mm thick layers was appropriate, starting with an approx. 105 mm layer at the bottom and finishing with an approx. 55 mm thick layer at the top (somewhat thicker layers were tried initially, but the density achieved was lower). For each layer, the required weight of fill was loaded into the crane mounted hopper for transfer to the rig. The fill can be spread evenly using a shovel to the required thickness, and then compacted to the required specification using a 10.5 kN (1 tonne) vibrating compaction plate (Amman AVP1040). An average unit density of 2.0±0.03M g/m3 was found to be achievable for the granular backfill
TABLE 1: Typical material properties
Properties Value Unit
Brick
Mean dimensions 214 × 102 × 65 mm
Density 2226 kg/m3
Water absorption 1.93 % %
Initial water absorption 0.03 kg/m2/min
Compressive strength 176 N/mm2
Mortar
Compressive strength 1.3 N/mm2
Density 1470-1570 kg/m3
Masonry
Compressive strength 25 N/mm2
Unit weight 23.7 kN/m3
Fill (Crushed Limestone)
Cohesion, cL 3.3 kN/m2
Internal angle of friction: φL 54.5 ◦
Unit weight 20.0 kN/m3
Fill (Clay)
Natural moisture content 16 %
Liquid limit 37 %
Plastic limit 14 %
Dry density 1.83 Mg/m3
Shear stress at failure 68 kPa
Strain at failure 16 %
Fill (Ballast)
Unit weight 16.4 kN/m3
to the hopper and placed and compacted in the manner described previously. At the end of the filling process, Perth Penetrometer tests can also be carried out at discrete locations along the longitudinal centre-line of the tank, to aid later strength characterisation.
Sensitive areas adjacent to the walls and the arch barrel itself are compacted with a hand rammer. Each pressure cell within the extrados of the arch barrel is first hand covered by fine sieved limestone (approximately 50 mm depth), and then progressively covered by coarser particles. No compaction is employed directly adjacent to or over the cells. However, subsequent layers above the pressure cells are compacted as previously described. This procedure was used in all tests undertaken to date, irrespective of the backfill used. Clearly, this is a compromise to ensure that pressure cells are not damaged during the filling process and the pressure cell readings are likely to be influenced by this, making it difficult, for example, to ensure that initial pressure distribution is symmetrical across the arch barrel.
In order to ensure adequate contrast for digital imaging, in the limestone tests, from the second fill layer, coloured fill (coal dust) was placed against the windows. This was achieved by placing thin metal plates 50 mm from the inside face of both side walls (front and rear) forming the test chamber. The space between the plates and the chamber side walls is then filled with coloured fill. After placement of the fill behind the plates, the plates themselves are then removed and the entire layer compacted as described previously. For the clay tests, this procedure was slightly different. The key challenge is to ensure adequate texture and contrast, and so limestone particles are embedded within the clay soil immediately adjacent to the front face of the test chamber.
Before testing, de-centering must be carried out by removing the supports underneath the curved steel beams. The centering remains inside the tank, pro-viding independent support for the instrumentation whilst leaving sufficient room to accommodate arch barrel deformation.
INSTRUMENTATION
Displacement transducers, pressure cells, electronic resistance strain gauges and acoustic sensors can be placed in various positions in order to measure the deformation of the arch barrel and of the test chamber, the soil pressure on the extrados of the arch, strain across mortar joints and change in stiffness due to crack formation, respectively. Figure 4 shows the positions of the main arch instrumentation used during tests carried out to date.
Deflection
FIG. 4: Typical instrumentation on the arch barrel: (a) location of soil pressure cells (PC) and linear displacement transducers (LVDT); (b) location of acoustic emission (AE) sensors and electronic resistance strain gauges (ERSG)
rig itself. These are positioned perpendicular to the vertical faces of the test rig to measure horizontal movements. Monitoring of these during tests carried out to date indicate that relatively insignificant movements (<1 mm) occur, confirming that the tests are being carried out under largely plane strain conditions.
Soil pressures
A total of twelve wall-surface soil pressure cells (Kyowa BER-A-500KP12S) were embedded into the extrados of the arch barrels of the majority of the tests undertaken to date to accurately record the pressure exerted on the arch barrel during loading. As described earlier, during construction of the arch barrel, this requires that sockets are created in the extrados of the arch. Once calibrated, pressure cells (PC) are subsequently mortared into these sockets. The pressure cells have a diameter of approximately 100mm and a rated capacity of 500kP a.
Although the pressure cells are used to measure the earth pressures acting on the arch barrel at the locations where the cells are installed, it is likely that shear forces may develop due to the interaction between the soil and the arch as it and the surrounding soil deform; this cannot be quantified using the current test set up. In addition, as the arch deforms, it is possible that arching of the soil may occur, which may make the pressure data difficult to interpret (Ahmad et al. 2015).
Acoustic monitoring
hot-glued to the intrados of the arch barrels of a number of the test bridges, as shown in Figure 4(b).
Electronic resistance strain gauges
Twelve electronic resistance strain gauges (ERSG) were glued longitudinally to the intrados and the extrados of the arch barrels of a number of the test bridges. Two electronic resistance strain gauges, one on a masonry unit and one across a mortar joint, were placed at the quarter, mid-span and three-quarter points on both the intrados and the extrados. The gauge attached to the masonry unit measures the strain in the unit, which can be used to infer stress. The gauge across the mortar joint measures strain in both the mortar joint and the brick. The positions of these gauges are shown in Figure 4(b). Surface strain measurements have been shown to provide useful information regarding changes in structural behaviour as well as opening of hinges.
Data logging
All data are acquired and logged using a data acquisition system (HBM MGC-plus), logging at a rate of 100 Hz.
Imaging
The tank provides 14 bays between the steel vertical members along its side length. Of these, the middle 12 bays incorporate 50 mm thick clear cast acrylic windows, as described previously. In order to capture the soil kinematics by Particle Image Velocimetry (PIV) techniques, a set of seven 21.1 MegaPixel, digital single-lens reflex cameras (Canon EOS 5D Mark II) are set up at a distance of 2.4 m from the windows, such that each camera can image a pair of bays. The cameras are fixed to a steel frame which in turn is fixed to the structural strong floor. This ensures that the camera positions are identical in all tests, and cannot be accidentally altered during a test. In addition, adopting this strategy was found to result in significant time savings associated with camera positioning and set up. During the tests the cameras are triggered simultaneously using specialist image capture software (developed by Breeze Systems).
Illumination from above each bay with a halogen lamp has been found to be essential to ensure good image quality and to minimise reflection. Also, the internal faces of the I-sections forming the front face of the test chamber, were painted white in order to achieve a uniform light intensity.
In order to monitor arch barrel movement, and in particular sliding and/or rotation of the skewbacks, markers are placed on the observable face of these structural elements. Reference markers are also placed on the steel frame of the test chamber and on the acrylic windows at specified discrete locations.
MECHANICAL AND CONTROL SYSTEM DESIGN DETAILS
new hydraulic system has therefore been designed to apply these loads to the soil-filled masonry arch structure contained within the test chamber.
Five 200 kN servo-controlled hydraulic actuators (manufactured by Servocon Systems Ltd) were designed for use with the test chamber (see Figure 5). Each actuator was fitted with an electro-hydraulic servo-valve and a 250 kN capacity load cell. The test design requires cyclic loads to be independently applied at five discrete locations at the surface of the soil backfill above the arch barrel: directly above each of the abutments, at the quarter and three-quarter span points, and above the crown. An applied peak cyclic load was selected in the range of 40
[image:13.595.139.481.280.513.2]kN to 70 kN. This peak load was selected to ensure that the load would remain within the anticipated range of elastic response of the arch and is representative of a typical working axle load.
FIG. 5: Hydraulic, control systems and data connections network diagram
In order to determine the capacity of the backfilled arch, a quasi-static load could be applied through any of the five actuators; however, since the assumed worst case loading position is generally considered to be at the quarter span point, and to remain consistent with previous test programmes, the actuator positioned at the quarter span point has to date been used to investigate the ultimate load carrying capacity.
and all five hydraulic actuators are connected to a manifold which supplies and controls the hydraulic oil movement between the pump and the actuators. An existing hydraulic pump with an oil flow rate capacity of 90 l/minand maximum operating pressure of up to 20 M P a was used.
All the hydraulic components are connected to an eight channel control system (manufactured by MTS), with five of these channels being used for the actuators. Each actuator was designed to apply a load in the form of a sine wave moving at a constant velocity across the bridge, with a phase difference of 180 degrees between adjacent actuators.
LOADING ARRANGEMENTS
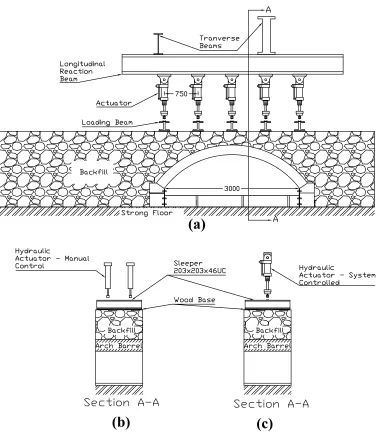
The actuators are connected to a longitudinal steel beam supported by two portal frames which allow a ‘line’ load to be applied to the surface of the backfill directly above the abutments, quarter point, mid-span and three-quarter point. In each case the load is applied vertically through a steel loading beam resting on a 25 mm thick wooden base which is placed on the surface of the backfill, as shown in Figure 6. A single hydraulic jack mounted at the quarter point nearest the east abutment was used to apply a quasi-static load. The loading arrangement is shown in Figure 6.
QUASI-STATIC LOADING
Manual application of loading
In the initial set up two hydraulic jacks positioned adjacent to each other, reacting against a steel reaction frame, were used to apply a transverse ‘line’ load onto the surface of the backfill vertically above the quarter point of the arch; the load was applied vertically onto the surface of the backfill through a steel loading beam resting on a plywood base which was placed on the surface of the backfill, as shown in Figure 6 (b). The load was controlled manually using a hand pump. Following each load increment, a set of images was captured for later analysis and interpretation. This procedure was continued as long as the response of the structure was considered to be broadly linear-elastic, based on the load-deflection curve which could be plotted in real-time as the test progressed, and where the deflection was measured on the intrados of the arch directly beneath the quarter-point loading position. Beyond this phase displacement control was used, with readings taken once an approximately 2 mm increment of displacement had been observed at the quarter-point.
Servo-control application of loading
FIG. 6: Loading arrangements: (a) cyclic loading arrangement, (b) quasi-static loading arrangement, manually controlled (Smith et al. 2006), and (c) quasi-static loading arrangement, system controlled (all the dimensions are in mm)
the displacement was then maintained constant for 10 mins. This procedure was repeated to 10, 15, 20, 25, 30, and 35 mm of overall deflection (up to 40 mm at loading beam level).
CYCLIC LOADING
single servo-controlled actuator, located above the quarter span, as previously described.
Slow speed cyclic loading
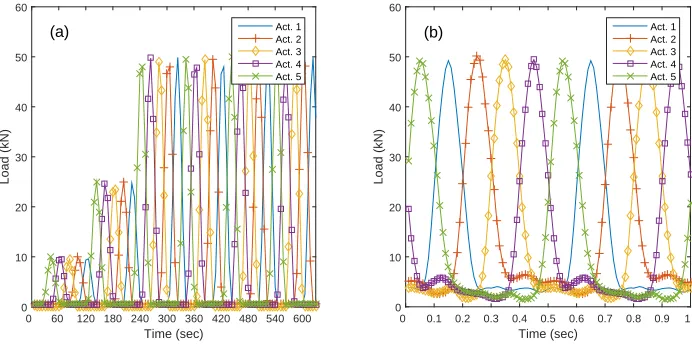
A slow speed cyclic loading regime was designed to examine the stiffness of the entire structural system (details: 0.01 Hz with a 50 kN peak load for six cycles, with images captured at two second intervals for a period of 10 minutes in the tests performed to date). In order to avoid the hydraulic actuator load cells losing contact with the loading beam, a minimum valley load was defined (3 kN). This loading regime was repeated after a number of cycles of the normal speed cyclic loading regime (104, 105 and 106 cycles).
Normal speed cyclic loading
A normal speed cyclic loading regime was designed to simulate the effects of traffic loading on the bridge (details: 2 Hz with a peak load of 50 kN and minimum valley load of 3kN in the tests performed to date). The magnitude, frequency and distribution of loading applied by the five actuators was designed to be broadly representative of traffic moving at approximately 25-30 mph. The arch was subjected to a large number of cycles (e.g. 106), switching over to the
slow speed cyclic loading regime at the stages indicated above. The applied cyclic loading regimes are illustrated in Figure 7 (a) and (b).
Time (sec)
0 60 120 180 240 300 360 420 480 540 600
Load (kN) 0 10 20 30 40 50 60 Act. 1 Act. 2 Act. 3 Act. 4 Act. 5 Time (sec)
0 0.1 0.2 0.3 0.4 0.5 0.6 0.7 0.8 0.9 1
[image:16.595.144.490.402.575.2]Load (kN) 0 10 20 30 40 50 60 Act. 1 Act. 2 Act. 3 Act. 4 Act. 5 (a) (b)
FIG. 7: Sample (a) slow and (b) normal speed cyclic loading regimes
SAMPLE RESULTS FROM PILOT TESTS
Applied loading regimes
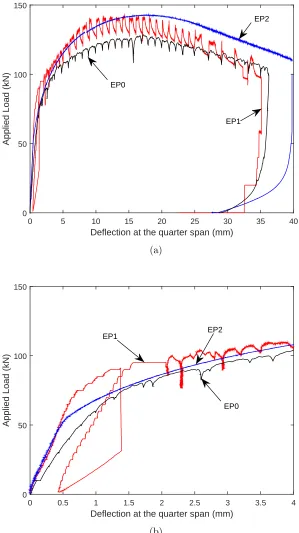
Bridge EP0 was subjected solely to quasi-static loading, with the test designed primarily to explore the influence of backfill on ultimate limit state (ULS) load carrying capacity. A hand pump was used to apply the load.
In contrast bridge EP1 was subjected to two types of loading, with the test designed to explore the relationship between performance under service loading and ULS load carrying capacity. Thus a cyclic load designed to simulate the effects of a prolonged period of service loading on the bridge was applied, and then a quasi-static load was applied at quarter span to failure, initially using load control and 5 kN load increments, and subsequently using displacement control and 2 mm displacement increments. The servo-controlled system was used to apply the load, though using the manual over-ride function.
Bridge EP2 was, like bridge EP0, subjected solely to quasi-static loading. However, to facilitate comparison with the other bridge tests, the loading ac-tuators were in this case controlled entirely by displacements, using the servo-controlled system and measurements from the internal displacement transducer within the actuator. The displacement rate was set to 10 mm/hr.
Performance of test bridges
Applied load versus arch radial deflection plots for the three different bridges (EP0, EP1 & EP2) tested are presented in Figure 8. In order to reduce the ‘noise’ in the experimental results, a more accurate displacement transducer was attached externally to the actuator and this was used as the control in the test on bridge EP2, in place of the internal displacement transducer which had a significantly lower accuracy and which had been used in the tests on bridge EP1. This contributed to a much smoother load deflection curve being obtained in the case of the test on bridge EP2 as compared with EP1.
As well as differences in the loading regimes and systems described, the density of the backfill differed slightly in the three bridges due to the differing ways in which the MOT type 1 graded crushed limestone backfill had been placed. In the case of EP0 the backfill was placed in 11 layers of 150 mm thickness, achieving an average density of 1.91M g/m3 , whereas in the case of EP1 and EP2 the backfill
was placed in 14 layers of 120 mm thickness (first layer is only 105 mm), achieving a slightly higher average density of 2M g/m3.
Figure 9 shows cumulative soil surface settlement. This also indicates that during the cyclic loading phase the backfill ‘bedded down’, achieving a more dense state than achieved through compaction alone.
pres-Deflection at the quarter span (mm)
0 5 10 15 20 25 30 35 40
Applied Load (kN)
0 50 100 150
EP0
EP1 EP2
(a)
Deflection at the quarter span (mm)
0 0.5 1 1.5 2 2.5 3 3.5 4
Applied Load (kN)
0 50 100 150
EP0
EP1 EP2
[image:18.595.154.453.116.649.2](b)
0 2 4 6 8 10 x 104 − 9
− 8 − 7 − 6 − 5 − 4 − 3 − 2 − 1 0 1
No. of cycles
Soil settlement (mm)
[image:19.595.161.452.108.344.2]Actuator 1 Actuator 2 Actuator 3 Actuator 4 Actuator 5
FIG. 9: Cumulative soil settlement under each loading beam (EP1 - first 105
cycles)
Pressure cells
1 2 3 4 5 6 7 8 9 10 11 12
Pressure (kPa)
0 2 4 6 8 10 12 14 16 18 20
After backfill After CYC7
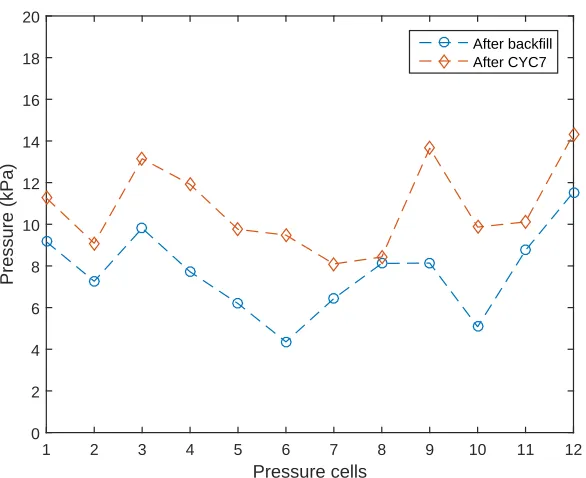
[image:19.595.161.454.433.672.2]sure distribution on the arch barrel, showing that the pressures have increased following the cyclic loading phase.
Pressure cell readings obtained during the quasi-static loading phase of bridge EP1 are shown in Figure 11. Here the pressure cells directly below the applied load (eg. pressure cell no. 4) show significant increases in normal pressure, whereas the pressure cells on the side of the arch remote from the load show much lower increases in normal pressure during the test, as expected.
Pressure cell no.7 6 5 4 3 2 1
8 9 10 11 12
Pressure (kPa)
0 50 100 150 200 250 300
[image:20.595.157.452.221.455.2]1kN 40kN 80kN 140kN
FIG. 11: Typical soil pressure profile on arch barrel with increasing quasi-static load at the quarter-span (EP1)
Figure 12 illustrates the soil displacement at the peak load for EP1. The PIV data are important in confirming interpretation of the pressure cell data. The vectors indicate general movement of soil beneath the loading beam above the quarter span, but also show clearly the volume of soil involved in resisting the outward deflection of the arch barrel on the passive side of the arch, remote from the load. It is important to note that some damage to the latex was observed during the testing caused by soil movements within the chamber, but this did not unduly affect the performance of the image analysis.
The arch barrel was visually inspected prior to the start of every test phase. Prior to the quasi-static load test to collapse on bridge EP1 small (<1mm) hair-line cracks in the mortar joint between the skewback and the abutment blocks on the west side were observed, though recorded movements of the skewbacks during the cyclic loading phase were small (<0.1mm).
FIG. 12: Deformation of soil - four hinge failure mechanism (EP1)
identified adjacent to the east abutment (between brick courses 1 and 2), at the quarter-span (between brick courses 15 and 16) and at the three-quarter span (between brick courses 28 and 30) (Figure 13, location B and C, respectively). As the applied load increased, the cracks in the arch barrels opened progressively and lateral spreading at the west abutment was observed as sliding occurred along the skewback/abutment interface.
FIG. 13: Four hinge failure mechanisms of arch barrel - EP1
As the applied load was increased further, the sliding at the west skew-back/abutment interface ceased and a hinge developed between the west skewback and brick course 48. This behaviour was confirmed using the deformation mea-surement as shown in Figure 14. The bridge ultimately failed as a four hinge mechanism, as shown in Figure 13. The physical modelling test programme was conducted so that the critical failure mechanism for a given bridge could be es-tablished, and validated using more than one measurement technique.
CONCLUSIONS
[image:21.595.176.440.354.506.2]Deformation at the quarter span (mm)
0 5 10 15 20 25 30 35 40
Deformation at the skewback (mm)
0 1 2 3 4 5 6
West skewback
[image:22.595.164.453.102.342.2]East skewback
FIG. 14: East and west skewback/abutment interface behaviour of EP1
backfill material, a large test chamber and associated hydraulic loading and con-trol system has been commissioned. This allows tests to be carried out on large scale backfilled masonry arch bridges under both quasi-static and cyclic loading regimes.
The hydraulic loading and control systems and the instrumentation generally performed well throughout the tests performed. Cyclic loading effects, of the sort likely to be found in well trafficked bridges in the field, could be readily discerned (e.g. densification of the soil around the arch barrel, which appeared to enhance load carrying capacity). Also particle image velocimetry (PIV) image analysis data could be used in conjunction with soil pressure measurements to determine the main features of the soil-structure interaction mechanisms found in masonry arch bridges, both in the region beneath the load and on the passive side of the arch barrel.
ACKNOWLEDGEMENTS
The authors wish to acknowledge the support of the UK Engineering and Physical Sciences Research Council (EPSRC), under grant references EP/I014357/1 and EP/I014489/1. The authors also wish to thank Dr Phillip Callaway for his contribution to the design of the test facility described.
REFERENCES
arch.” Proceedings of XVI European Conference on Soil Mechanics and Geotechnical Engineering, Edinburgh, UK. 541–546.
Brencich, A. and Sabia, D. (2008). “Experimental identification of a multi-span masonry bridge: The Tanaro Bridge.” Construction and Building Materials, 22(10), 2087–2099.
Callaway, P. (2007). “Soil-Structure Interaction in Masonry Arch Bridges,” PhD thesis, University of Sheffield.
Carpinteri, a. and Lacidogna, G. (2007). “Damage Monitoring of an Historical Masonry Building by the Acoustic Emission Technique.” Materials and Struc-tures, 39(2), 161–167.
Carpinteri, A., Stefano, I., and Giuseppe, L. (2007). “Structural assessment of a 17th-century masonry vault with acoustic emissions and numerical techniques.”
International Journal of Architectural Heritage, 1(2), 214–226.
Diamanti, N., Giannopoulos, A., and Forde, M. C. (2008). “Numerical modelling and experimental verification of GPR to investigate ring separation in brick masonry arch bridges.” NDT & E International, 41(5), 354–363.
Fang, Y., Chen, T., Holtz, R., and Lee, W. (2004). “Reduction of boundary friction in model tests..” Geotechnical Testing Journal, 27(1), 3–12.
Gilbert, M. and Melbourne, C. (1994). “Rigid-block analysis of masonry struc-tures.” Structural Engineer, 72(21), 356–361.
Invernizzi, S., Lacidogna, G., Manuello, A., and Carpinteri, A. (2011). “AE mon-itoring and numerical simulation of a two-span model masonry arch bridge subjected to pier scour.” Strain, 47(SUPPL. 2), 158–169.
Melbourne, C. and Gilbert, M. (1995). “Behaviour of multi-ring brickwork arch bridges.” Structural Engineer, 73(3), 39–47.
Melbourne, C. and Tomor, A. K. (2006). “Application of Acoustic Emission for Masonry.” Strain, 42, 165–172.
Page, J. (1993). Masonry Arch bridges. TRL State of the Art Review: HMSO, London, UK.
Royles, R. (1991). “Acoustic emission monitoring of masonry arch bridges.”
British Journal of Non-Destructive Testing, 33(7), 339–343.
Smith, C., Gilbert, M., and Callaway, P. (2004). “Geotechnical issues in the anal-ysis of masonry arch bridges.” Proceedings of the 4th International Conference on Arch Bridges. 343–352.
Smith, C. C., Gilbert, M., Melbourne, C., and Wang, J. (2006). “Development of a test appratus for full scale modelling of soil-structure interaction in masonry arch bridges.”Proceedings of the 6th International Conference on Physical Mod-elling in Geotechnics. 247–252.
Swift, G., Augusthus-Nelson, L., Melbourne, C., and Gilbert, M. (2013). “Physi-cal modelling of masonry arch bridges.” Proceedings of 7th International Con-ference on Arch Bridges. 621–628.