International Journal of Emerging Technology and Advanced Engineering
Website: www.ijetae.com (ISSN 2250-2459, ISO 9001:2008 Certified Journal, Volume 5, Issue 10, October 2015)
145
A Study on the Potential of Clay Tile Waste as a Partial
Replacement of Fine Aggregate in Mortar
Anooja Sathian
1, Prof. Jiji Antony
21Student, Department of Civil Engineering, Ilahia College of Engineering & Technology, Muvattupuzha, Kerala, India 2 Assistant Professor, Department of Civil Engineering, FISAT Engineering College, Angamali, Kerala, India
Abstract—In this constructed environment, the rising cost of building construction materials is the factor of great concern. The prices of building materials are rising day by day. Most of the researchers are doing the research on the material which can reduce the cost of construction as well as increase the strength. The fine aggregates are the main ingredients of construction industry. Now a day’s sand is becoming a very scarce material, in this situation research began for inexpensive and easily available alternative material to natural sand. The alternative material selected here is Clay tile waste (CTW). Crushed clay tiles, being lighter in weight and abundantly available at low cost. This study examines the feasibility of using clay tile waste from ceramic industries in mortar as a replacement of fine aggregate.
Keywords-compressive strength, mortar, clay tile waste, water absorption, fine aggregate
I. INTRODUCTION
Now a day’s sand is becoming a very scarce material, in this situation research began for inexpensive and easily available alternative material to natural sand. Some alternative materials have already been used as a part of natural sand e.g. fly-ash, slag limestone and siliceous stone powder are used in concrete mixtures as a partial replacement of natural sand. However, scarcity in required quality is the major limitation in some of the above materials. Now a day’s sustainable infrastructural growth demands the alternative material that should satisfy technical requisites of fine aggregate as well as it should be available abundantly.
The negative impact of ceramic industry growth, on both large and small scales, is the waste of roof tiles. The waste from the roof tile industry is mainly in the solid form of roof-tile fragments and the failed processing of roof tiles. That waste can also be found as un-used material in damaged house renovations or demolitions. Roof-tile fragments actually can be used and processed into valuable materials that can be recycled to replace expensive and rare natural stone for aesthetic purposes.
With the increased shortage of natural river sand for construction due to over exploitation from sources and the inability of the nature to replace it and increasing pressures from local bodies, to protect the environment, either replacement or substitution for sand is warranted during this decade and for future. Thus, there is an increasing need to source alternative locally-available materials that could serve as suitable replacement to sand as fine aggregate in concrete. The alternative material selected here is Clay Tile Waste (CTW). So, this study examines the potential of using clay tile waste from ceramic industries in mortar as a replacement of fine aggregate.
II. OBJECTIVES OF THE STUDY
To investigate the potential of clay tile waste as a partial replacement for fine aggregate in building applications
To optimize the percentage replacement of fine aggregate by clay tile waste in cement mortar.
To study the effect of clay tile waste on the properties of modified mortar.
III. MATERIALS USED IN EXPERIMENTATION
The materials used in this study are cement, fine aggregate, and clay tile powder. All the materials used were tested as per IS standard procedures to assess their engineering properties
A. Cement
International Journal of Emerging Technology and Advanced Engineering
Website: www.ijetae.com (ISSN 2250-2459, ISO 9001:2008 Certified Journal, Volume 5, Issue 10, October 2015)
146
TABLEI PROPERTIES OF CEMENT
Sl.no Properties Magnitude
1 Specific gravity 3
2 Standard consistency 30% 3 Initial setting time 115 minutes 4 Final setting time 195 minutes
B. Fine aggregate
Manufactured sand (M sand) was used as fine aggregate. Generally for research works river sand is considered, but nowadays due to the lack of availability of river sand, M sand is usually preferred by people. Hence to simulate this, M sand was used for this project work. The aggregates were taken as per IS: 2116-1980. Sieve analysis was performed at regular intervals to check the uniformity in the used aggregates. The various properties of aggregates are as follows:
TABLEII
PROPERTIES OF FINE AGGREGATE
Sl.no Properties Magnitude
1 Specific gravity 2.58
2 Grading zone Zone II
3 Fineness modulus 4.6
4 Bulking Max bulking at 6% moisture content
C. Clay tile waste
In the Thrissur area there are about 50 tile factories, which are operational. Broken clay tile samples for this study were obtained from such factories in the area. Clay tile waste (CTW) is collected from a roof tile factory located in Thrissur. Mechanical crushing was investigated by applying waste samples to Los Angeles abrasion testing machine for 100 revolutions and after that it was sieved through 4.75mm sieve.The test results are tabulated below-
TABLEIII
PROPERTIES OF CLAY TILE POWDER
Sl.no Properties Magnitude
1 Specific gravity 2.57
2 Grading zone Zone II
3 Fineness modulus 4.3
4 Bulking Max bulking at 6%
moisture content 5 Surface area 2,53,690 cm2/gm
Figure I Clay tile waste powder
IV. EXPERIMENTAL PROCEDURE
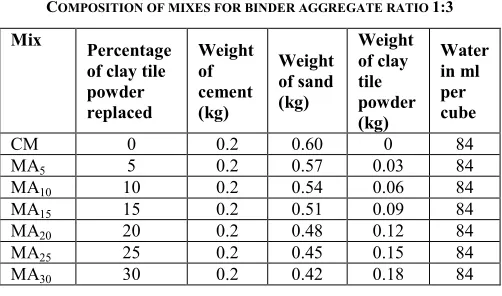
The experimental program consists of casting mortar cubes with clay tile waste powder at various replacement levels. Mortar cubes of 70.6mm X 70.6mm X 70.6mm were casted by replacing cement with 5%, 10%, 15%, 20%, 25%, and 30% of clay tile waste powder with mix proportions 1:3 and 1:5. Specimens with 1:3 mix proportions are designated as MA and those with 1:5 as MB. Each replacement level under 1:3 mix are designated as MA5, MA10, MA15, MA20, MA25 and MA30 and those for 1:5 as MB5, MB10, MB15, MB20, MB25 and MA30.12 specimens were prepared for each percentage. Water-binder ratio adopted was 0.45.Composition of mixes for binder aggregate ratio 1:3 and 1:5 are shown in Table V and Table VI.
TABLEIV
COMPOSITION OF MIXES FOR BINDER AGGREGATE RATIO 1:3
Mix Percentage of clay tile powder replaced
Weight of cement (kg)
Weight of sand (kg)
Weight of clay tile powder (kg)
Water in ml per cube
CM 0 0.2 0.60 0 84
MA5 5 0.2 0.57 0.03 84
MA10 10 0.2 0.54 0.06 84
MA15 15 0.2 0.51 0.09 84
MA20 20 0.2 0.48 0.12 84
MA25 25 0.2 0.45 0.15 84
[image:2.612.319.570.470.618.2]International Journal of Emerging Technology and Advanced Engineering
Website: www.ijetae.com (ISSN 2250-2459, ISO 9001:2008 Certified Journal, Volume 5, Issue 10, October 2015)
147
TABLEV
COMPOSITION OF MIXES FOR BINDER AGGREGATE RATIO 1:5
Mix Percentage of clay tile powder replaced
Weight of cement (kg)
Weight of sand (kg)
Weight of clay tile powder (kg)
Water in ml per cube
CM 0 0.13 0.67 0 84
MB5 5 0.13 0.63 0.03 84
MB10 10 0.13 0.60 0.06 84
MB15 15 0.13 0.57 0.09 84
MB20 20 0.13 0.53 0.12 84
MB25 25 0.13 0.50 0.15 84
MB30 30 0.13 0.47 0.18 84
A. Compression test of mortar cubes
Mortar cubes (70.6 mm x 70.6 mm x 70.6 mm) were cast by replacing fine aggregate with 5%, 10%, 15%, 20%, 25%, and 30% of clay tile powder. 12 specimens were prepared for each percentage. After being demoulded, all samples were subjected to curing by means of sprinkling with twice a day until the age of 7, 28, & 90 days.
B. Flexural strength of mortar bomb
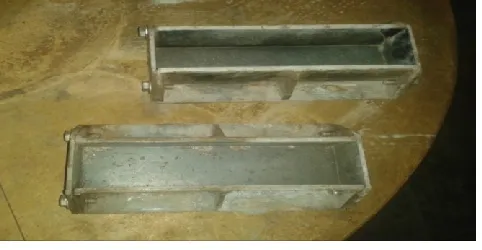
[image:3.612.49.290.508.633.2]Flexural strength tests were carried out on 40 mm x 40mm x160 mm beam specimen at the age of 28 days. The moulds for casting flexural test specimen are shown in Figure II.12specimens were prepared for each percentage. As per ASTM C 348, Flexural strength is the product of breaking load and .0028.
Figure II Moulds for Flexural strength test
C.Shrinkage test
Prism specimens of 285x 25x 25mm were cast for different proportions of the mortar mixes.12 specimens were prepared for each percentage.
Immediately after demoulding, the specimen is placed in an extensometer consisting of a dial gauge of 0.01mm least count for measuring the rate of shrinkage based on the mortar age. With respect to the age, the corresponding changes in dimension due to volumetric shrinkage are observed. The moulds for casting shrinkage test specimen are shown in Figure III.
FigureIII Shrinkage test moulds
D. Water absorption test
Water absorption test is a measure of the capillary forces exerted by the pores structure causing fluid to be drawn into the body of material. The amount of water absorbed by mortar mixes depends on the water tightness of the mixes. All mixes were subjected to water absorption test at the end of curing period of 7 and 28 days after demoulding. For this test the sample will keep inside the oven at 150oc for 24 hrs.
V. RESULT AND DISCUSSIONS A. Compression test of mortar cubes
From the results obtained, it is seen that compressive strength of mortar cubes decreases with the increase in replacement level. The strength results of samples containing 5% and 10% CTW gives strength at 28th day comparable to reference samples. So clay tile waste can replace fine aggregate up to 10% is possible in construction works. Results are shown in Table VI and Table VII. The variation in 7th and 28th day compressive strengths for different replacement levels are in illustrated in the Figure IV and Figure V.
International Journal of Emerging Technology and Advanced Engineering
Website: www.ijetae.com (ISSN 2250-2459, ISO 9001:2008 Certified Journal, Volume 5, Issue 10, October 2015)
148
TABLEVI
COMPRESSIVE STRENGTH OF MODIFIED MORTAR 1:3
Replacement level (%)
Compressive strength (n/mm2)
7DAY 28DAY
0 21.48 42.17
5 31.17 41.39
10 15.22 41.35
15 13.36 12.51
20 12.29 7.33
25 10.90 6.78
30 8.35 6.39
TABLEVII
COMPRESSIVE STRENGTH OF MODIFIED MORTAR 1:5
Replacement level (%)
Compressive strength (n/mm2)
7thDAY 28thDAY
0 29.54 43.14
5 18.49 21.63
10 18.15 20.87
15 9.45 10.43
20 8.27 7.33
25 5.59 6.49
30 3.30 6.68
Figure IV Compressive strength of modified mortar 1:3
Figure V Compressive strength of modified mortar 1:5
B. Flexural strength
From the results obtained, it is seen that flexural strength of beams with increasing percentage replacement of clay tile waste decreases and maximum flexural strength were obtained for 5% replacement level. The decrease of flexural strength may be due to smooth texture of clay tile powder and improper bonding between the cement paste and aggregates.The flexural strength results of modified mortar bar specimen of Binder Aggregate ratio =1:3 & 1:5 are shown in table VIII & table IX. The variation in 28th day flexural strengths for different replacement levels are in illustrated in the Figure VI and Figure VII.
TABLEVIII
FLEXURAL STRENGTH OF MORTAR BEAM OF BINDER AGGREGATE RATIO 1:3
Percentage
replacement Maximum load p (n) =0.0028p (n/mmFlexural strength 2)
CM 1100 3.08
5 820 2.29
10 760 2.12
15 710 1.98
20 600 1.68
Figure VI Flexural strength of Mortar Beam of binder aggregate ratio (1:3)
TABLEIX
FLEXURAL STRENGTH OF MORTAR BEAM OF BINDER AGGREGATE RATIO 1:5
Percentage replacement
Maximum load p (n)
Flexural strength =0.0028p (n/mm2)
CM 950 2.66
5 800 2.24
10 740 2.07
15 700 1.96
International Journal of Emerging Technology and Advanced Engineering
Website: www.ijetae.com (ISSN 2250-2459, ISO 9001:2008 Certified Journal, Volume 5, Issue 10, October 2015)
[image:5.612.53.284.129.243.2]149
Figure VII Flexural strength of Mortar beam of binder aggregate ratio (1:5)
C. Shrinkage test
The shrinkage in mortar with recycled clay tile as an aggregate is higher than the shrinkage in control mix. The shrinkage is in correlation with the size of aggregate particles used in concrete production. From the results obtained, it is seen that shrinkage of specimen increasing with respect to the days. It was seen that mortar specimen with 5% replacement have shown least shrinkage than other replacement levels. Test results are shown in table X and table XI.
TABLEX
SHRINKAGE READINGS OF MORTAR SPECIMEN 1:3
Replacement level (%) Shrinkage
0 1.09
5 1.01
10 1.12
15 2.01
20 2.51
Figure VIII Shrinkage readings of mortar specimen 1:3
TABLEXI
SHRINKAGE READINGS OF MORTAR SPECIMEN 1:5
Replacement level (%) Shrinkage
0 1.05
5 1.02
10 1.21
15 1.31
20 1.82
Figure IX Shrinkage readings of mortar specimen 1:5
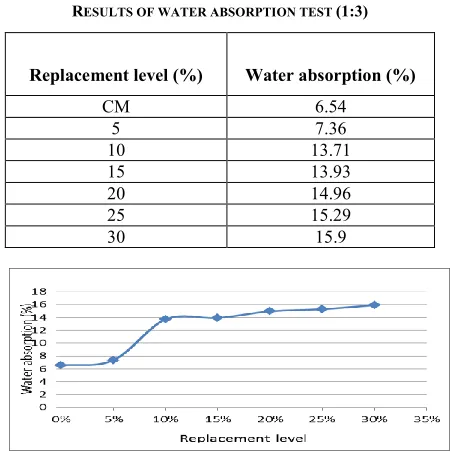
D.Water Absorption
From the results obtained, it is noted that the water absorption is more in the clay tile powder replaced cube comparing to the reference cube. Higher water absorption is observed for clay tile waste aggregate because of surface area, pore structure and clay content.
TABLEXII
RESULTS OF WATER ABSORPTION TEST (1:3)
Replacement level (%) Water absorption (%)
CM 6.54
5 7.36
10 13.71
15 13.93
20 14.96
25 15.29
30 15.9
[image:5.612.323.568.153.352.2] [image:5.612.334.559.458.684.2]
International Journal of Emerging Technology and Advanced Engineering
Website: www.ijetae.com (ISSN 2250-2459, ISO 9001:2008 Certified Journal, Volume 5, Issue 10, October 2015)
150
TABLEXIII
RESULTS OF WATER ABSORPTION TEST (1:5)
Replacement level (%) Water absorption (%)
CM 9.78
5 12.00
10 15.39
15 16.43
20 17.57
25 18.85
30 21.65
Figure XI Results of water absorption test (1:5)
VI. CONCLUSIONS
This investigation determines the constituent mortar strength when unconventional crushed Clay tile wastes are used as a replacement to sand. The Compressive Strength of mortar decreases with increase in Crushed Clay Tile wastes for, 7 and 28 days. The strength results of samples containing 5% and 10% CTW gives strength at 28th day comparable to reference samples. Strength of mortar decreases due to many reasons such as improper compaction, improper bonding of the aggregate and higher water absorption of the clay tile waste aggregate.
It was observed that modified mortars have shown variations in shrinkage than in reference mortar specimen. This can be attributed to the presence of fines in it. The water absorption rate of samples containing 5% CTW has comparable result as that of reference mortar. The water absorption rates of samples containing other replacement levels have shown high variations from the reference mortar, it can be attributed to its porosity and specific surface area.
REFERENCES
[1] WANG Gong-xun , SU Da-gen “Preparation of high performance ceramic tiles using waste tile granules and ceramic polishing powder” Journal of Chongqing University (English Edition) [ISSN 1671-8224], Vol. 7 No. 4 December 2008.
[2] Paulo B.Cachim, “Mechanical Properties of brick aggregate Concrete”, Construction and Building Materials, issue 23, pp.1292-1297, 2009.
[3] Veera Reddy.M , “Investigations on Stone dust and Ceramic Scrap as aggregate replacement in Concrete”, International Journal of Civil And Structural Engineering, Vol.1 No3, 2010.
[4] RM. Senthamarai, P. Devadas Manoharan and D.Gobinath, “Concrete made from Ceramic industry Waste: Durability properties”, Construction and Building Materials, issue 25, pp.2413-2419, 2011.
[5] DrT.Sekar, N.Ganesan, and DR NVN.Nampoothiri “Studies on strength characteristics on utilization of waste materials as coarse aggregate inconcrete”, International journal of Engineering Science and Technology (IJEST), issue.3, No7, July 2011
[6] Pincha Torkittikul, Arnom Chaipanich, “Utilization of ceramic waste as fine aggregate within portland cement and fly ash concretes”, cement and concrete composites volume 32 pages 440-449, 2010. [7] Medina C, M.I Sanchez de Rojas and M.Frias, “Reuse of sanitary
ceramic waste as coarse aggregate in eco-efficient concretes”, Cement and Concrete composites, issue 34, pp.48-54, 2012. [8] T.Geetha Kumari Sudin. D. S2 Srinidhi. M3, “Use of Crushed