International Journal of Emerging Technology and Advanced Engineering
Website: www.ijetae.com (ISSN 2250-2459,ISO 9001:2008 Certified Journal, Volume 4, Issue 6, June 2014)
313
Taguchi Method and ANOVA: An Approach for Selection of
Process Parameters of EDM of EN-353 Steel.
Dinesh Kumar.Kasdekar
1, Vishal Parashar
2, Jasveer singh
3, M.K.Gour
41,3,4Department of Mechanical Engineering, Madhav Institute of Technology & Science, Gwalior-474005, India. 2
Department of Mechanical Engineering, Maulana Azad National Institute of Technology, Bhopal-462051, India.
Abstract:-The various process parameters affecting the quality characteristics of the EDM during the process were identified using the Ishikawa diagram. In this paper,Taguchi method is applied to find optimal process parameters for EDM while hard machining of hardened steel (En-353).A L9 Orthogonal Array signal to Noise ratio and Analysis of Variance (ANOVA) are applied to study Performance characteristics of machining parameters (Discharge Current, Pulse on time ,Pulse off time ,Di-electric fluid ) with consideration of Material (MRR),Tool wear rate (TWR), Surface Roughness (Ra)
Keywords:- EDM, Ishikawa diagram, Taguchi Method, S/N Ratio, ANOVA
I. INTRODUCTION
Electrical Discharge Machining (EDM) is a unconventional machining process which is more efficient than Conventional Machining process due to ease of machining of difficult-to-machine materials with complex shapes. EDM is used for machining of toughened and high strength conductive materials which is hard enough to cut by traditional processes. It has many applications in manufacturing sectors especially industries like aerospace, ordinance, automobile and general engineering[1].This technique has been widely used in modern metal working industry producing complex cavities in dies and moulds, which are otherwise difficult to create by conventional machining [2]. EDM can be used to machine difficult geometries in small batches or even on job-shop basis. Work material to be machined by EDM has to be electrically conductive, the attainments of accurate and consistent. EDM performance are mainly dependent on eight main factors; polarity, open-circuit or no-load voltage, discharge current, pulse duration, electrode material, pulse interval, gap control and circulation rate. The first four of these are called planning parameters that are dependent on the type of machining operation and whether the cut is roughing or finishing operation .The last four are adjusted to give the best operating conditions for the machine used and the results required. The pulse interval, gap control and circulation rate are the operating parameters, which are automatically monitored and corrected in modern machines [3].
Several researchers carried out various investigations for improving the process performance. The important output parameters of the process are the material removal rate (MRR) and surface roughness (Ra). Optimisation of the EDM process is concerned with maximising MRR while minimising TWR, and also producing the optimum (Ra) usually, the finish should be as smooth as possible. Optimisation is concerned with maximising material removal rate, minimising the tool wear ratio and obtaining a good surface finish. There are many input parameters which can be varied in the EDM process which have different effects on the EDM performance characteristics [4].Taguchi proposes a procedure that applies orthogonal arrays from statistical design of experiments to efficiently obtain the best model with the least number of experiments[5].
In this work, the selected EN-353 stainless steel material for the present investigation is having a wide range of applications in the industrial field. The taguchi method was used early on in the process of this experiment, inspecting the effects of different parameters and levels in EDM on the various characteristics of EDM, including material (MRR), and Surface roughness (SR).The taguchi methodologies to optimize the finishing parameter in EDM use EN-353 and Electrode tool is Copper. Author analysed the data using ANOVA with the help of Commercial software packing MINITAB-15.A series of experiment based on the L9 orthogonal array is utilized for experiment planning for EDM. In this paper the finishing of EN-353 with parameters of finishing at three levels and four factors each.The main and interaction effects are analyzed using the analysis of variance.
II. EXPERIMENTAL DETAILS
International Journal of Emerging Technology and Advanced Engineering
Website: www.ijetae.com (ISSN 2250-2459,ISO 9001:2008 Certified Journal, Volume 4, Issue 6, June 2014)
314
[image:2.612.349.541.266.405.2] [image:2.612.34.307.314.641.2]The dielectric fluid used for the EDM machine was I-POL EDM 30, which is commercially available dielectric fluid with a flash point of 930C. The materials normally used in EDM electrodes are various types of copper, graphite, tungsten, brass and silver. Copper is the most appropriate material with excellent electrical and thermal conductivity and one of the major commercial materials. In EDM which maintained uniform sparking gap between work piece and electrode. Guide pin of work holding fixture helped to position the work piece with respect to the axis of electrode. The electrode having a diameter (Ø17.5 mm and L=18 mm).The electrode material Composition are 99.9% copper[16] shown in table 1.
Table 1.
Electric discharge machining process variables.
Working Conditions
Description
Work piece EN-353 (Density 8.904 g/cm3)
Composition: C-0.171 %, S-0.3 %,Mg-0.56 %, P- 0.012 %,S- 0.13 %, Cr – 0.953 %, Ni-0.989 %, Mo - 0.16 % and remaining percentage is iron
Hardness:260 HB
Electrical Resistivity: 1.74X10-05 Ohm-m
Thermal conductivity [W/m·K] : 51.9W/mK Specific heat [cal/g·°C]: 0.472 J/gm-K
Melting point [°C]: 1510oC
Electrode Electrolytic Copper (Density:8.95g/cm3)
Tube Electrode of Ø17.5 and 18mm Lenght
Hardness: 100HB Yield stress:65N/mm2
Thermal conductivity [W/m·K]: 380.7
Specific heat [cal/g·°C]: 0.092 Melting point [°C]: 1083
Electrical Resistivity:1.67X10⁻⁸ ohm-m
Polarity Workpiece:-ve;Electrode:+ve
Power supply
voltage
75V
Current 9A,23A,25A
Pulse on time 10 µs ,70 µs,87 µs
Pulse off time 4 µs,9 µs,11 µs
Dielectric Fluid 1l/g,3l/g,5l/g
2.1 Material:
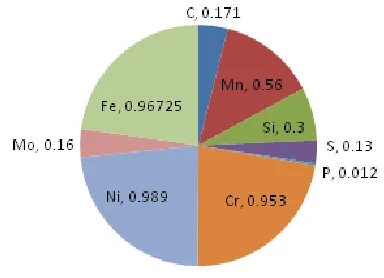
En 353 steel has carbon content of 0.17% and the most common form of steel as it‟s provides material properties that are acceptable for many automobile applications such as heavy duty gear, shaft, pinion, cam shafts, gudgeon pins etc[14,15] .
It is neither externally brittle nor ductile due to its lower carbon content and lower hardness. As the carbon content increases, the metal becomes harder and stronger. The chemical analysis, carbon - 0.171 %, silicon - 0.3 %, manganese - 0.56 %, phosphorus - 0.012 %, sulphur - 0.13 %, Chromium – 0.953 %, Nickel - 0.989 %, molybdenum - 0.16 % and remaining percentage is iron respectively. In this study, EN-353 steel was applied as work material for experimentation. The chemical composition of the selected work material is shown in Fig.1 Contribution of Substrate materials.
2.2 Surface Roughness:
Roughness is often a good predictor of the performance of a mechanical component, since irregularities in the surface may form nucleation sites for cracks or corrosion [13]. Roughness is a measure of the texture of a surface. It is quantified by the vertical deviations of a real surface from its ideal form. If these deviations are large, the surface is rough; if small, the surface is smooth. Roughness is typically considered to be the high frequency, short wavelength component of a measured surface. The parameter mostly used for general surface roughness is Ra. It measures average roughness by comparing all the peaks and valleys to the mean line, and then averaging them all over the entire cut-off length. The surface roughness (Ra) is measured with a mitutoyo surf test SJ-201 series 178 Portable surface roughness tester instrument.
III. PROBLEM IDENTIFICATION AND METHODOLOGY
International Journal of Emerging Technology and Advanced Engineering
Website: www.ijetae.com (ISSN 2250-2459,ISO 9001:2008 Certified Journal, Volume 4, Issue 6, June 2014)
315
Finally the confirmation experiments are conducted to make sure that the optimized levels of each parameters result in the optimum value of EDM characteristics (response).
IV. ISHIKAWA DIAGRAM OR FISHBONE DIAGRAM
Cause and effect diagram is a tool for identifying the root causes of quality problems. It is also called as the Ishikawa diagram or fishbone diagram [18]. The C-E diagram to obtain quality parts in EDM is constructed. Figure 4 shows the various EDM parameters affecting the Surface roughness quality, MRR and TWR of EDM. From Ishikawa cause –effect diagram the various process parameters has been selected to increase the MRR, and decrease SR, TWR.
The process parameters of EDM are shown in the
Ishikawa cause-effect diagram (Figure 2). Four parameters,
namely Discharge current, pulse-on time, pulse-off time, di-electric fluid, have been selected for the present study. The ranges of these parameters were selected on the basis of preliminary experiments conducted by using the „change
[image:3.612.49.287.422.568.2]one variable at a time approach
.
Fig.2 Cause & Effect diagram
V. EXPERIMENTAL DESIGN AND DATA ANALYSIS
Taguchi uses a special design of orthogonal arrays to study the entire process parameter space with only a small number of experiments. The taguchi design of experiments approach eliminates the need for repeated experiments and thus saves time, material, and cost[6].Taguchi technique is a powerful tool for the design of high quality systems[7,8].The taguchi approach to experimentation provides an orderly way to collect, analyze, and interpret data to satisfy the objectives of the study.
In the design of experiments one can obtain the maximum amount of information for the amount of experimentation. Taguchi parameter design can optimize the performance characteristics through the setting of design parameter and reduce the sensitivity of the system performance to the source of variation [9, 10]. This is carried by the efficient use of experiment runs to the combinations of variables to be studied. This technique is a powerful tool for acquiring the data in a controlled way and to analyze the influence of process parameters over specific parameters which is unknown function of these process variables. the crucial stage in the plan of experiments is selection of factors. Which have effects on the process. taguchi technique creates a standard orthogonal array to consider the effect of several factors on the target value and defines the plan of experiments[11].In this work experimental design L9 orthogonal array design matrix is used to set the control parameters to evaluate the process performance.
[image:3.612.317.570.431.699.2]In a EDM process with the help of copper electrode on En-353 as work piece material for each combination of parameters considered according to the Orthogonal Array. The work piece and tool electrode were weighed before and after the machining by using the electronic weight-balance.
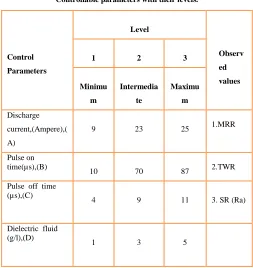
Table 2
Controllable parameters with their levels.
Control
Parameters
Level
Observ
ed
values
1 2 3
Minimu
m
Intermedia
te
Maximu
m
Discharge
current,(Ampere),(
A)
9 23 25 1.MRR
Pulse on time(µs),(B)
10 70 87 2.TWR
Pulse off time (µs),(C)
4 9 11 3. SR (Ra)
Dielectric fluid (g/l),(D)
International Journal of Emerging Technology and Advanced Engineering
Website: www.ijetae.com (ISSN 2250-2459,ISO 9001:2008 Certified Journal, Volume 4, Issue 6, June 2014)
316
Table 3.Shows the design matrix used in this work.
Experiment
No
Discharge
Current
Pulse
on
Time
Pulse
off
Time
Di-electric
fluid
1 9 10 4 1
2 9 70 9 3
3 9 87 11 5
4 23 10 9 5
5 23 70 11 1
6 23 87 4 3
7 25 10 11 3
8 25 70 4 5
9 25 87 9 1
5.1 Signal to noise (S/N) ratio:
Taguchi method is one of the simple and effective solutions for parameter design and experimental planning [5]. In this method signal-to-noise ratio approach to measure the quality characteristic deviating from the desired value. S/N ratio is used as an objective function for optimizing parameters. Control factors are easily adjustable, and it is set by the manufacturer. These factors are most important in determining the quality characteristics. Noise factors are difficult, impossible, or expensive to control (weather, temperature, humidity, etc.). The S/N ratio is the ratio of mean (signal) to the standard deviation (noise).There are several S/N ratios available depending on the type of characteristics [19]. There are three types of S/N ratio the lower-the- better, the higher-the-better, and the nominal-the-better. The S/N ratio with a lower-the-better characteristic that can be expressed as:
The S/N ratio with a higher-the-better characteristic can be expressed as:
The S/N ratio with a nominal-the-better characteristic can be expressed as:
[image:4.612.314.575.242.460.2]Where, yij is the ith experiment at the jth test, n is the total number of the tests, and s is the standard deviation.
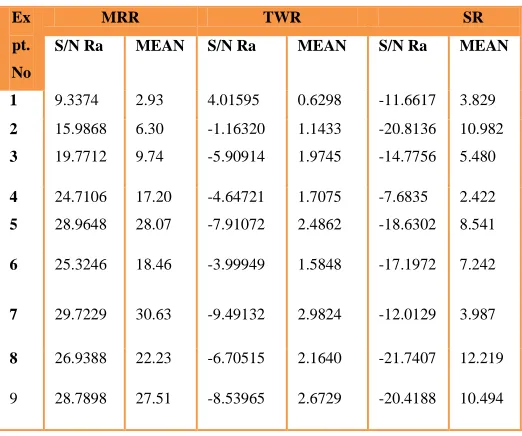
Table 4.
S/N ratios of different experiments for MRR ,TWR and SR.
Ex
pt.
No
MRR TWR SR
S/N Ra MEAN S/N Ra MEAN S/N Ra MEAN
1 9.3374 2.93 4.01595 0.6298 -11.6617 3.829
2 15.9868 6.30 -1.16320 1.1433 -20.8136 10.982
3 19.7712 9.74 -5.90914 1.9745 -14.7756 5.480
4 24.7106 17.20 -4.64721 1.7075 -7.6835 2.422
5 28.9648 28.07 -7.91072 2.4862 -18.6302 8.541
6 25.3246 18.46 -3.99949 1.5848 -17.1972 7.242
7 29.7229 30.63 -9.49132 2.9824 -12.0129 3.987
8 26.9388 22.23 -6.70515 2.1640 -21.7407 12.219
9 28.7898 27.51 -8.53965 2.6729 -20.4188 10.494
5.2 Analysis Of Variance (Anova)
ANOVA is to investigate the design parameters and to indicate which parameters are significantly affecting the output parameters. In the analysis the sum of squares and variance are calculated. An F-test value at 95 % confidence level is used to decide the significant factors affecting the process. Larger F- value indicates that the variation of process parameters makes a big change on the performance [12,17].
VI. RESULTS AND DISCUSSION
The observed values of MRR and TWR & SR for each run are recorded in table 4. The analysis of results was computed by using software MINITAB.
International Journal of Emerging Technology and Advanced Engineering
Website: www.ijetae.com (ISSN 2250-2459,ISO 9001:2008 Certified Journal, Volume 4, Issue 6, June 2014)
[image:5.612.317.571.158.360.2]317
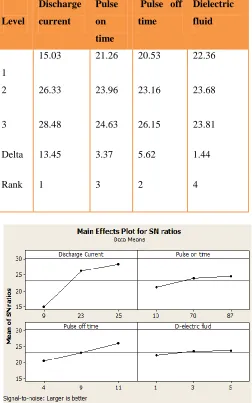
Table 5Response Table for Signal to Noise Ratios (MRR)
Level
Discharge
current
Pulse
on
time
Pulse off
time
Dielectric
fluid
1
15.03 21.26 20.53 22.36
2 26.33 23.96 23.16 23.68
3 28.48 24.63 26.15 23.81
Delta 13.45 3.37 5.62 1.44
Rank 1 3 2 4
Fig.3Main effect plot of S/N ratio for MRR
Table 6.
Analysis of Variance for S/N Ratio, using for F-Tests (MRR)
Paramet er
DO F
Sum of Squar e
Mean Varian ce
F-rati o
P (% Contributi on)
Ran k
Discharg e Current
2 313.3
08
156.65 4
** 0.81654 1
Pulse on time
2 19.13
5
9.568 ** 0.04987 3
Pulse of time
2 47.43
2
23.716 ** 0.12362 2
Di-electric fluid
2 3.825 1.913 ** 0.00997 4
Error 0 0 0 0 0
Total 8 383.7
01
191.85 1
100
Note:** Significant Parameter, * Sub-significant Parameter
[image:5.612.45.297.162.565.2]As response parameter, MRR of the samples is given in Table 5. The relative contribution percentage (P) and F-value of each factor obtained by the ANOVA method are given in Table 6. It can be concluded from Tables 5 and 6, based on F-value, that the significance of factors prevails in the following order of importance: (1) Discharge current; (2) Pulse off time (3) Pulse on time (4) Di-electric fluid. The most significant factor is Discharge current; the percentage contribution of that parameter to MRR was 81.654%. The next significant factor is Pulse off time which contributed 12.362%, and the third significant factor is the Pulse on time with percentage contribution of 4.987%. and the forth significant factor is the Di-electric fluid with percentage contribution of 0.997%.
Table 7
Response Table for Means (MRR)
Level
Discharge current
Pulse on time
Pulse off time
Dielectric fluid
1 6.2333 16.9200 14.5400 19.5033
2 21.2433 18.8667 17.0033 18.4633
3 26.7900 18.5700 22.8133 16.3900
Delta 20.4667 1.9467 8.2733 3.1133
International Journal of Emerging Technology and Advanced Engineering
Website: www.ijetae.com (ISSN 2250-2459,ISO 9001:2008 Certified Journal, Volume 4, Issue 6, June 2014)
[image:6.612.53.527.125.536.2]318
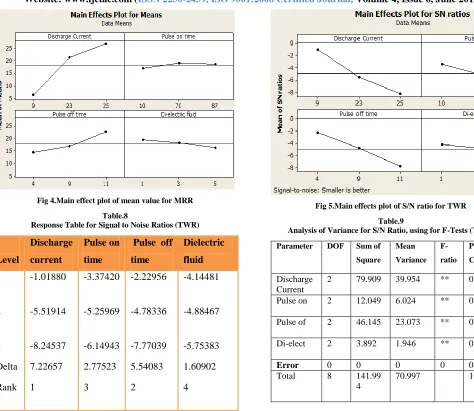
Fig 4.Main effect plot of mean value for MRRTable.8
Response Table for Signal to Noise Ratios (TWR)
Level
Discharge
current
Pulse on
time
Pulse off
time
Dielectric
fluid
1
-1.01880 -3.37420 -2.22956 -4.14481
2 -5.51914 -5.25969 -4.78336 -4.88467
3 -8.24537 -6.14943 -7.77039 -5.75383
Delta 7.22657 2.77523 5.54083 1.60902
Rank 1 3 2 4
Fig 5.Main effects plot of S/N ratio for TWR
Table.9
Analysis of Variance for S/N Ratio, using for F-Tests (TWR)
Parameter DOF Sum of
Square
Mean
Variance
F-ratio P (%
Contribution) Rank
Discharge Current
2 79.909 39.954 ** 0.56276 1
Pulse on 2 12.049 6.024 ** 0.08486 3
Pulse of 2 46.145 23.073 ** 0.32498 2
Di-elect 2 3.892 1.946 ** 0.02741 4
Error 0 0 0 0 0
Total 8 141.99
4
[image:6.612.44.292.133.530.2]International Journal of Emerging Technology and Advanced Engineering
Website: www.ijetae.com (ISSN 2250-2459,ISO 9001:2008 Certified Journal, Volume 4, Issue 6, June 2014)
319
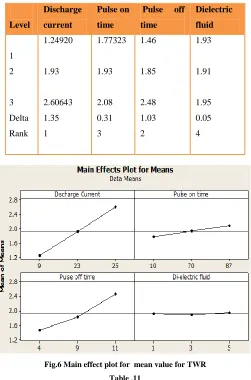
Table.10Response Table for Means (TWR)
Level
Discharge current
Pulse on time
Pulse off time
Dielectric fluid
1
1.24920 1.77323 1.46 1.93
2 1.93 1.93 1.85 1.91
3 2.60643 2.08 2.48 1.95
Delta 1.35 0.31 1.03 0.05
[image:7.612.321.599.147.502.2]Rank 1 3 2 4
Fig.6 Main effect plot for mean value for TWR
Table .11
Response Table for Signal to Noise Ratios (SR) (Smaller is better)
Level
Discharg ecurrent
Pulse on time
Pulse off time
Dielectric fluid
1
-15.7503 -10.4527 -16.8665 -16.9036
2 -14.5036 -20.3948 -16.3053 -16.6746
3 -18.0575 -17.4639 -15.1396 -14.7333
Delta 3.5539 9.9421 1.7270 2.1703
Rank 2 1 4 3
Fig 7 Main effect plot of S/N ratio for SR
Table 12.
Analysis of Variance for S/N Ratio, using for F-Tests (SR)
Parameter DOF Sum of Square
Mean Varia nce
F-ratio
P (% Contribu tion)
Rank
Discharge
current
2 19.507 9.754 ** 0.10305 2
Pulse on time 2 156.593 78.297 ** 0.82727 1
Pulse off
time
2 4.656 2.328 ** 0.0246 4
Di-electric
fluid
2 8.531 4.266 ** 0.04507 3
Error 0 0 0 0 0
[image:7.612.43.294.156.536.2]International Journal of Emerging Technology and Advanced Engineering
Website: www.ijetae.com (ISSN 2250-2459,ISO 9001:2008 Certified Journal, Volume 4, Issue 6, June 2014)
320
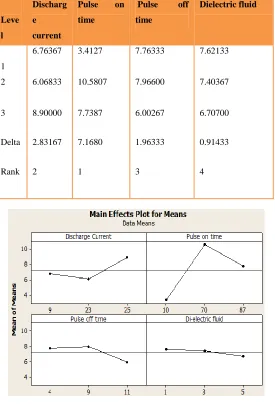
Table 13.Response Table for Means (SR)
Leve l
Discharg e current
Pulse on time
Pulse off time
Dielectric fluid
1
6.76367 3.4127 7.76333 7.62133
2 6.06833 10.5807 7.96600 7.40367
3 8.90000 7.7387 6.00267 6.70700
Delta 2.83167 7.1680 1.96333 0.91433
[image:8.612.326.561.121.313.2]Rank 2 1 3 4
Fig 8. Main effect plot of mean value for SR
Fig 9. 3-D surface plot of MRR Vs TWR and SR.
3D surface graphs for the responses are shown in fig. 9. The figs. show the effects of Surface roughness (SR) and Tool wear rate (TWR) on Material Removal rate (MRR).It is clear that, for a particular SR on Material removal rate (MRR) decreases with increase in TWR.
VII. CONCLUSION
Ishikawa diagram or cause and effect diagram is very effective to sort out all the possible causes affecting the quality of EDM Process Performance.
Taguchi method of experimental design has been applied for optimizing multi-response characteristics such as MRR (Material Removal Rate), Tool wear rate and Surface Roughness of En-353 during EDM process. For EDM while hard machining of hardened steel are optimized with L9 orthogonal array. Results obtained from taguchi method closely match with ANOVA.The conclusions of this work are summarized as follows:
[image:8.612.33.308.161.565.2]International Journal of Emerging Technology and Advanced Engineering
Website: www.ijetae.com (ISSN 2250-2459,ISO 9001:2008 Certified Journal, Volume 4, Issue 6, June 2014)
321
The optimal parameters combination TWR wasdetermined as A1B1C1D1 i.e. Discharge current at 9A, pulse ON time at 10μs ,pulse OFF time at 4μs and Di-electric fluid at 1l/g.
The optimal parameters combination SR was determined as A2B1C3D3 i.e. Discharge current at 23A, pulse ON time at 10μs ,pulse OFF time at 11μs and Di-electric fluid at 5l/g.
This work demonstrates the method of using Taguchi methods for optimizing the EDM parameters for multiple response characteristics.
Acknowledgements
The author would like to thank Director, MITS and Engineer, R.K Engineering Works Limited, Faridabad, India, for supporting this research with their valuable inspiration, and co-operation.
REFERENCES
[1] Ramakrishna, R. And Karunamoorthy, “Multi response optimization of wire EDM operations using robust design of experiments”, International Journal of Advance Manufacturing Technology, 2006, 29, p. 105
[2] Seung-Han Yanga,J. Srinivas , Sekar Mohan, Dong-Mok Lee, Sree
Balaji, “Optimization of electric discharge machining using simulated annealing” , Journal of Materials Processing Technology 209 (2009) 4471–4475 .
[3] T.M. Chenthil Jegan, M.Dev Anand,D.Ravindran, “Determination of EDM parameters in AISI202 Stainless steel using Grey relational analysis.” Procedia Engineering 38 (2012) 4005-4012.
[4] Jose Marafona, Catherine Wykes, “A new method of optimising material removal rate using EDM with copper–tungsten Electrodes”, International Journal of Machine Tools & Manufacture 40 (2000) 153–164.
[5] Ross P.J. Taguchi, “Techniques for quality Engineering “, USA: McGraw-Hill;1996.
[6] Natarajan N,Arunachalam RM,”Optimization with micro EDM with multi performance characterstics using taguchi method and grey relational analysis.Journal of sci. Ind Research 2011;70:500-5. [7] Taguchi G, Introduction to quality engineering Tokyo, (Japan):
Asian Productivity;1990.
[8] Suresha B,Chandramohan G,Kishore,Sampath Kumaran P,Seetharamu S,” Mechanical and three body abrasive wear behaviour of SiC filled glass-epoxy composites,Poly Compos 2008;29(9):1020-5.
[9] Basavarajappa S, Chandramohan G,Paulo Davim J,”Application of taguchi techniques to study dry sliding wear behaviour of metal matrix composites.Mater Des 2007;28(4):1393-8.
[10] Palani kumar K,Latha B, Senthi K VS,Davim JP,”Analysis of drilling of GRFP composites using grey relational analysis. Mater Manuf Process 2012;27(3):297-305.
[11] Yang chao-Lieh. Optimizing the glass fiber cutting process using the taguchi methods and grey relational analysis,”New Journal glass ceram 2011;1:13-9.
[12] Bala Murugan Gopalsamy , Biswanath Mondal and sukamal ghosh , “Taguchi method and ANOVA : An approach for process parameters optimization of hard machining while machining hardened steel‟‟ Journal of Scientific & Industrial Research Vol 68 , August 2009 , p 686-695.
[13] Kadirgama, K., Noor. M.M., Zuki.N.M, Rahman, M.M., Rejab M.R.M, Daud, R., K. Abou-El-Hossein, A.,“Optimization of S urface Roughness inEnd Milling on Mould Aluminium Alloys (AA6061-T6) Using Response Surface Method and Radian Basis Function Network”, Jordan Journal ofMechanical and Industrial Engineering, Vol 2, 2008.
[14] A. Bensely, S. Stephen Jayakumar, D. Mohan Lal, G. Nagarajan , and A. Rajadurai, “Failure investigation of crown wheel and pinion”, Engineering Failure Analysis, 13, 2006, 1285–1292.
[15] H. Khorsand, S.M. Habibi, h.Yoozbashizadea, K. Janghorbon, S.M.S. Reihani, H. Rahmani Seraji, and M.ashtari “The role of heat treatment on wear behavior of powder metallurgy low alloy steels”, Material and Design, 23, 2002, 667-670.
[16] Fischer, U., Heinzle, M., Näher, F., Paetzold, H., Gomeringer, R., Kilgus, R., Oesterle, S.,Stephan, A. (2008). Tabellenbuch Metall. Verlag Europa-Lehrmittel, Nourney, Vollmer GmbH & Co. KG, Haan-Gruiten.
[17] M .N .Das , N. C. Giri, New Age international (p) Ltd. Publisher , New Delhi „‟Design and Analysis of experiments‟‟ 1999,P 13-15 [18] Ilie G, Ciocoiu CN (2010) Application of fishbone diagram to
determine the riskof an event with multiple causes. Manag Res Pract 2(1):1–20.