International Journal of Pharmaceutical Sciences and Research 1387 IJPSR (2019), Volume 10, Issue 3 (Research Article)
Received on 02 July 2018; received in revised form, 02 September 2018; accepted, 06 September 2018; published 01 March 2019
METHOD DEVELOPMENT AND VALIDATIONS OF APIXABAN IN BULK AND ITS FORMULATIONS BY UV-SPECTROSCOPY (AREA UNDER CURVE)
M. Akiful Haque, Vasudha Bakshi, Narender Boggula * and Santhoshi Priya Dandamudi
Department of Pharmaceutical Chemistry, School of Pharmacy, Anurag Group of Institutions, Venkatapur, Ghatkesar - 500088, Telangana, India.
ABSTRACT: The aim of the present research work is to validate the apixaban content in bulk and pharmaceutical dosage formulation and validate it as per ICH guidelines. A simple, rapid, precise and highly selective spectrophotometric method was developed for estimation of apixaban in tablet dosage form by the area under curve method. The area under curve method involves the measurement of absorbances of apixaban at the wavelength of 269 nm-289 nm. Methanol was used as a solvent. Linearity was observed in the concentration range of 5-25 µg/ml for apixaban. The accuracy of the method was confirmed by recovery studies of tablet dosage forms and was found to be 100% for Apixaban. The method showed good reproducibility and recovery with % RSD less than 0.988%. The LOD of apixaban was found to be 0.335 µg/ml, and LOQ of apixaban was found to be 1.015 µg/ml. Thus the proposed method was found to be rapid, specific, precise, accurate and cost-effective quality control tool for the routine analysis of Apixaban in bulk and tablet dosage form. Drug stability studies have been determined for the formulation under specified conditions, and it was found stable.
INTRODUCTION: Analytical chemistry is a scientific discipline used to study the chemical composition, structure, and behavior of matter. The purposes of chemical analysis are together and interpret chemical information that will be of value to society in a wide range of contexts. Quality control in manufacturing industries, the monitoring of clinical and environmental samples, the assaying of geological specimens, and the support of fundamental and applied research are the principal applications. Analytical chemistry involves the application of a range of techniques and methodologies to obtain and assess qualitative, quantitative and structural information on the nature of matter 1.
QUICK RESPONSE CODE
DOI:
10.13040/IJPSR.0975-8232.10(3).1387-91
The article can be accessed online on
www.ijpsr.com
DOI link: http://dx.doi.org/10.13040/IJPSR.0975-8232.10(3).1387-91
Spectroscopy is the measurement and interpretation of electromagnetic radiation absorbed or emitted when the molecules or atoms or ions of a sample move from one energy state to another energy state. Spectroscopy is a general methodologythat can be adapted in many ways to extract the information you need (energies of electronic, vibrational, rotational states, structure and symmetry of molecules, dynamic information).
Ultraviolet-Visible spectrophotometry is one of the
most frequently employed techniques in
Pharmaceutical analysis 2. It involves the measurement of the amount of Ultraviolet (190-380 nm) radiation by a substance in a solution. A compound or drug which possesses conjugated double bond absorbs UV radiation at a specific wavelength and this character of the drug is specific for a fixed solvent system. The wavelength at which maximum absorption occurs is called λmax.
It is independent of concentration. For a drug to be measured by the ultraviolet analytical method, it should follow the Beer’s-Lambert’s law 3
.
Keywords:
Apixaban, Area under the curve, Analytical method validation,
ICH Q2 (R1) guideline
Correspondence to Author: Narender Boggula
Associate Professor,
Department of Pharmaceutical Chemistry, School of Pharmacy, Anurag Group of Institutions, Venkatapur, Ghatkesar - 500088, Telangana, India.
Apixaban is an anticoagulant drug. Chemically it is 1- (4- methoxyphenyl)– 7– oxo– 6– [4–(2–oxopi-peridinin-1-yl) phenyl]–4, 5, 6, 7–tetrahydropyrrole [3, 4–c] pyridine-3-carboxamide Fig. 1. The molecular formula and molecular weight of apixaban are C25H25N5O4 and 459.497 g/mol
[image:2.612.48.298.299.440.2]respectively. Apixaban is white to pale yellow in color and available in powder form and it is stored between 20 ºC to 25 ºC temperature. Apixaban is an inhibitor of coagulation factor Xa, thereby interfering with the conversion of prothrombin to thrombin and preventing the formation of cross-linked fibrin clots. The drug is indicated for the prophylaxis of deep vein thrombosis. According to literature survey studies, only few HPLC methods are established for determination of apixaban from pure and pharmaceutical formulations 4.
FIG. 1: CHEMICAL STRUCTURE OF APIXABAN
This study was established new, precise and reproducible spectrophotometric methods for quantification of apixaban from bulk and its tablet dosage form 6. Apixaban content in bulk and pharmaceutical dosage formulation and validate it as per ICH guidelines 6.
MATERIALS AND METHODS: Apixaban was provided as a gift sample by Honour Lab Limited, Visakhapatnam, India. HPLC grade methanol was used to prepare solutions; Apixaban 5 mg tablets were purchased from a local pharmacy in Hyderabad. Shimadzu UV 1800 (Japan) with matched quartz cells, connected to a computer loaded with UV Prob Software and Single pan electronic balance (Shimadzu, ATY 224) was used for weighing purpose.
Sonication of the solutions was carried out using an Ultrasonication (Spectra lab UCB 40 India). Calibrated volumetric glassware (Borosil) was used to perform the study.
Method Development:
Preparation of Standard Solution: Accurately weighed 100 mg quantity of Apixaban was transferred into 100 ml volumetric flask, to this 70 ml of methanol was added and sonicated until all the drug got dissolved. After that, volume was made up by methanol to obtained 1000 μg/ml solution. From the resulting solution 10 ml solution was pipetted out into 100 ml volumetric flask and volume were adjusted with methanol to obtained 100 μg/ml standard stock solution. This solution was further diluted with methanol to obtain desired concentrations of working standard solutions in the range of 5 - 25 μg/ml.
Wavelength Selection: Apixaban 10 μg/ml working standard solution was scanned between 400.00 nm - 200.00 nm in UV spectrophotometer by using methanol as blank after baseline correction. 269.00 nm - 289.00 nm wavelength was selected for further analysis.
Method: Area Under Curve spectrophotometry: This method involves the calculation of the integrated value of absorbance concerning the wavelength in the indicated range. Area calculation processing calculates the area bounded by the curve and horizontal axis. Here horizontal axis represents baseline. Whereas α is the area of portion bounded by curved at a and a straight line connecting the start and end point, β is an area of portion bounded by a straight line connecting the start and end point on curve data and horizontal axis, λ1 and λ2 are
wavelengths representing the start and end point of curve region. In this study area was integrated between wavelength ranges from 269.00 nm - 289.00 nm.
Preparation of Calibration Curve: Solutions of apixaban were prepared of concentrations 5, 10, 15, 20 and 25 μg/ml from 100 μg/ml standard stock solution using methanol as a solvent.
For Method: Above solutions were scanned from 400.00 nm - 200.00 nm and Area Under Curve was integrated into the range of 269.00 nm - 289.00 nm. A calibration curve was plotted for the area under the curve against concentration.
powder; from this 10 mg powder was weighed and transferred into 100 ml volumetric flask. To this, 70 ml of methanol was added and sonicated for 30 min to dissolve the drug completely. After attaining room temperature, volume was made up with the same solvent and shaken well to obtain a homogeneous solution. The resulting solution was filtered by 0.45μ syringe filter after discarding first 5 ml of solution. The resulting solution was 100 μg/ml sample stock solution, which was further diluted with methanol to obtain working stock solutions. Working stock solutions were prepared in triplicate and scanned at 269.00 nm - 289.00 nm.
Analytical Method Validation: The objective of validation of an analytical procedure was to demonstrate that it is suitable for its intended purpose. The present method was validated according to ICH Q2 (R1) guideline for range, linearity, accuracy, precision, limit of detection (LOD) and limit of quantitation (LOQ).
Linearity and Range: By using 5 - 25 μg/ml working standard solutions linearity was determined.
Method: Calibration plot constructed for the area under curve against concentration and regression equation calculated. The area under curve integrated into the range of 269.00 nm - 289.00 nm.
Intermediate Precision (Reproducibility): The three concentrations of apixaban, i.e., 10 μg/ml, 15 μg/ml and 20 μg/ml each were analyzed in triplicate on the same day (Intraday precision), and same solutions were analyzed in triplicate on a different day (Interday precision). The results were calculated and % RSD was determined and tabulated in Table 3.
Accuracy: Accuracy studies were carried out at 80%, 100% and 120% levels of standard solutions. At the range of 269.00 nm-289.00 nm, Area under curve values was measured, and percent recoveries were calculated for respective levels. % RSD was calculated by analyzing each level in triplicate. The results were tabulated in Table 4.
Method Precision:
Repeatability: The repeatability study was carried out by repeatedly analyzing (n = 6) working standard solutions of Apixaban (10 μg/ml) at
269.00 nm - 289.00 nm range area under the curve (AUC) measured and percent relative standard deviation (% RSD) was determined.
Limit of Detection (LOD) and Limit of Quantitation (LOQ): Solutions of concentrations 5 μg/ml - 25 μg/ml were prepared five times (five sets), and calibration curves were determined for each set. The values of LOD and LOQ were calculated by using the following formulae:
LOD = 3.3 × SD/S LOQ = 10 × SD/S
Where; SD is the standard deviation of y-intercept of the calibration curve, and S is the mean slope of six calibration curves.
RESULTS AND DISCUSSION: The results are found to be within limits and results are summarized as follows.
TABLE 1: ASSAY OF MARKETED TABLETS OF APIXABAN
Method Label
claim
Amount is taken
Amount found (mg/tab)
% Assay
Area Under Curve
[image:3.612.315.564.358.572.2]5 mg 10 mg 9.966 99.6%
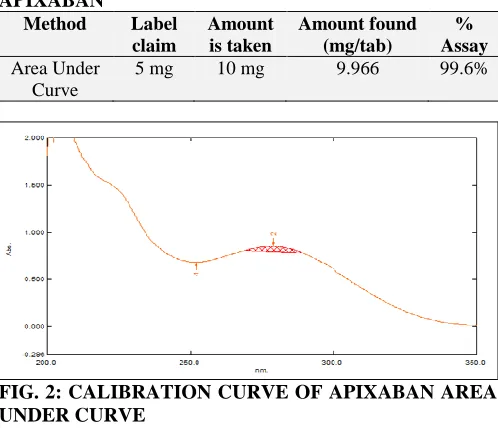
FIG. 2: CALIBRATION CURVE OF APIXABAN AREA UNDER CURVE
TABLE 2: APIXABAN CALIBRATION DATA
Concentration (µg/ml) Absorbance (Area Under Curve)
5 0.245
10 0.522
15 0.758
20 0.984
25 1.304
TABLE 3: PRECISION DATA OF APIXABAN Precision (µg/ml) Area Under Curve (% RSD)
5 0.548%
10 0.988%
15 1.097%
20 0.101%
[image:3.612.313.567.444.743.2]TABLE 4: RESULTS FOR RECOVERY OF APIXABAN Test
sample (µg/ml)
Accuracy level (%)
Amount of standard drug added (µg/ml)
% Recovery
10 µg/ml
80% 18 µg/ml 100% 100% 20 µg/ml 100% 120% 22 µg/ml 100%
TABLE 5: LOD AND LOQ DATA OF APIXABAN
Method Area Under Curve
LOD 0.335
LOQ 1.015
A specific and reproducible zero order derivative and Area under Curve spectroscopy methods were attempted for determination of Apixaban in the tablet dosage form. The following regression equations were obtained,
AUC = ʃ 0.2562x - 0.0042; R² = 0.9965
ʃ is amplitude difference, x is concentration, and R² is the correlation coefficient. The R² value was 0.9965 for Area Under Curve, showed that the method is linear.
The method was precise as % RSD for intraday, and interday precision are within limits. In accuracy studies percent recoveries were satisfactory for each 80%, 100% and 120% level, which is in the range of 99.00% - 100.00%. From these values, the above method was found to be accurate. The LOD and LOQ values found to be 0.335 μg/ml and 1.015 μg/ml. The assay was found to 100% for a pharmaceutical tablet dosage form which is consistent with the label claim. From overall studies, it was shown that present methods are reproducible and precise to carry out routine analysis of apixaban in the tablet dosage form. Results for validation studies were summarized in Table 6.
TABLE 6: VALIDATION PARAMETERS OF
APIXABAN BY UV–SPECTROSCOPIC METHOD Validation Parameter Area Under Curve
Range 269.00 nm - 289.00 nm Linearity 5-25 µg/ml Regression Equation
(y = mx + c)
0.2562x - 0.0042 Slope (m) 0.2562 Intercept ( c ) 0.0042 Correlation coefficient (R2) 0.9965 Repeatability (% RSD) 0.5469 Intraday (% RSD) 0.988 Interday (% RSD) 0.438 Accuracy (Mean % Recovery) 100% LOD (µ/ml) 0.335 LOQ (µg/ml) 1.015
CONCLUSION: There was no method reported for determination of Apixaban from the bulk and pharmaceutical dosage form, by an area under curve spectrophotometry. So, from the present research work, it is concluded that the method is economical and reproducible. The area under the curve spectrophotometric method was developed and validated as per ICH Q2 (R1) guideline. The proposed method can be employed for the routine analysis of apixaban from the pharmaceutical dosage form. The results obtained on the validation parameters were met ICH and USP requirements. It inferred the method found to be simple, accurate, precise and linear. The method was found to be having suitable application in routine laboratory analysis with a high degree of accuracy and precision.
ACKNOWLEDGEMENT: The authors wish to thank the management of School of Pharmacy, Anurag Group of Institutions, Venkatapur, Ghatkesar, Telangana, India for providing necessary equipment for research, constant encouragement, praiseworthy inspiration, facilities, and support.
AUTHOR’s CONTRIBUTIONS: All authors have made considerable contributions to the work reported in the manuscript.
SPONSORSHIP: Nil
CONFLICT OF INTEREST: The authors declare that there is no conflict of interests regarding the publication of this paper.
REFERENCES:
1. Skoog: Fundamentals of analytical chemistry. Thomson Asia Pvt. Ltd., Singapore 2012: 2-11.
2. Willard H: Instrumental methods of analysis. CBS publishers and distributors, New Delhi 1984: 580-600. 3. Bioanalytical method validation, U.S. Department of
Health and Human Services, Food and Drug Administration, USA 2013; 1-28.
4. Sonawane AM, Dudhe PB and Kamble MC: Development and validation of UV spectrophotometric method for the estimation of Cycloserine in bulk and pharmaceutical dosage form. Inventi Rapid: Pharm Analysis & Quality Assurance 2016; 3: 1-4.
5. Akram NMD, Umamahesh M and Ramachari T: A new validated RP-HPLC method for the determination of Elbasvir and Grazoprevir in its bulk and pharmaceutical dosage forms. International Journal of Chemical and Pharmaceutical Analysis 2017; 4(3): 1-11.
International Conference on Harmonization, Geneva 2005; 1-13.
7. Becattini C, Vedovati MC and Agnelli G: Old and new oral anticoagulants for venous thromboembolism and atrial fibrillation: a review of the literature. Thrombosis Research 2012; 129(3): 392-400.
8. Haque MA, Bakshi V and Boggula N: Method development and validations of apixaban in bulk and its formulations by UV-spectroscopy (zero derivatives). IOSR-Journal of Pharmacy Biological Sciences 2018; 13(2): 18-22.
9. Delavenne X, Mismetti P and Basset T: Rapid determination of apixaban concentration in human plasma by liquid chromatography/tandem mass spectrometry: Application to a pharmacokinetic study. J Pharm Biomed Anal 2013; 78: 150-153.
10. Dudhe PB, Kamble MC, Van S, Rajpurohit VJ, Komerwar A and Gondane SJ: Development and Validation of a Spectrophotometric Method for Glibenclamide in Bulk and Tablet Dosage Forms. International Journal of Pharm Tech Research 2016; 9(2): 19-23.
11. Dudhe PB and Sonawane AM: Spectrophotometric determination of cyclosporin in bulk and capsule dosage form by the area under the curve and first-order derivative methods. International Journal of Pharmtech Research 2016; 9(8): 131-139.
12. Dudhe PB, Kamble MC, Komerwar A, Sonawane AM and Van S: Development and validation of first-order derivative method for metronidazole in bulk and tablet Using UV-visible spectroscopy. International Journal of ChemTech Research 2016; 9(04): 140-144.
13. Dudhe PB, Shinde AP and Salgar K: Development and validation of analytical methods for Simultaneous estimation of domperidone and esomeprazole Magnesium in bulk and pharmaceutical formulations Using UV-Visible spectroscopy. International Journal of PharmTech Research 2014; 6(5): 1501-1508.
14. Dudhe PB, Shivarkar NA and Nagras MA: Development and Validation of HPTLC Method for Simultaneous Estimation of Flunarizine dihydrochloride and Propranolol hydrochloride in Capsule Dosage Form. Indian Journal of Pharmaceutical Sciences 2013; 75(3): 251-384.
15. Pursley J, Shen JX, Schuster A, Dang OT, Lehman J, Buonarati MH, Song Y, Aubry AF and Arnold ME: LC-MS/MS determination of apixaban (BMS-562247) and its major metabolite in human plasma: an application of polarity switching and monolithic HPLC column Bioanalysis 2014; 6(15): 2071-2082.
16. Dudhe PB: Determination of apixaban from bulk and tablet dosage form by the area under the curve and first-order derivative spectrophotometric methods. International Journal of ChemTech Research 2017; 10(5): 703-711. 17. Katta R, Nagaraju C, Ramasrinivas and Rao GN: Two
novel validated RP-HPLC and UV spectrophotometric methods for estimation of apixaban in bulk and pharmaceutical dosage forms. Am J PharmTech Res 2015; 5(4): 450-460.
18. Dandamudi SP, Battineni JK, Bakshi V, Peddapalli H and Boggula N: Validated RP-HPLC method for estimation of daclatasvir in the tablet dosage form. International Journal of Advanced Research and Development 2018; 3(2): 1170-1174.
All © 2013 are reserved by International Journal of Pharmaceutical Sciences and Research. This Journal licensed under a Creative Commons Attribution-NonCommercial-ShareAlike 3.0 Unported License.
This article can be downloaded to Android OS based mobile. Scan QR Code using Code/Bar Scanner from your mobile. (Scanners are available on Google Play store)
How to cite this article: