Citation:
Wilson, AD and Weightman, A and Bingham, GP and Zhu, Q (2016) Using Task Dynamics to Quantify the Affordances of Throwing for Long Distance and Accuracy. Journal of experimental psychology. Human perception and performance, 42 (7). pp. 965-981. ISSN 0096-1523 DOI: https://doi.org/10.1037/xhp0000199
Link to Leeds Beckett Repository record: http://eprints.leedsbeckett.ac.uk/2218/
Document Version: Article
The aim of the Leeds Beckett Repository is to provide open access to our research, as required by funder policies and permitted by publishers and copyright law.
The Leeds Beckett repository holds a wide range of publications, each of which has been checked for copyright and the relevant embargo period has been applied by the Research Services team.
We operate on a standard take-down policy. If you are the author or publisher of an output and you would like it removed from the repository, please contact us and we will investigate on a case-by-case basis.
RUNNING HEAD: AFFORDANCES OF THROWING FOR DISTANCE AND ACCURACY
Using Task Dynamics to Quantify the Affordances of Throwing for Long Distance and Accuracy
Andrew D Wilson1* Andrew Weightman2 Geoffrey P Bingham3
& Qin Zhu4
1*Corresponding Author
School of Social, Psychological & Communication Sciences Leeds Beckett University
Calverley Building Portland Way Leeds LS1 3HE UK
Email: [email protected] / [email protected] Web: https://cognitioninaction.wordpress.com/
Twitter: @PsychScientists
2 School of Mechanical, Aerospace and Civil Engineering, The University of Manchester, Manchester M13 9PL, UK; [email protected]
3Department of Psychological & Brain Sciences, Indiana University, 1101 E. 10th St, Bloomington, IN 47401, USA; [email protected]
4Division of Kinesiology and Health, University of Wyoming, Dept. 3196, 1000 E. University Avenue, Laramie, WY 82071, USA; [email protected]
© APA. (Link to copy of record will be here once available)
Acknowledgements
Abstract
The ecological approach to explaining behaviour begins by identifying the task affordances. Affordances are perceptible, task specific, organism-relative properties of objects and events; not ‘how large is that object?’ but ‘can the object be grasped by me?’ or ‘can the object be stepped over by me?’ (Gibson, 1979; Turvey, Shaw, Reed & Mace, 1981). Affordances have been studied in a variety of contexts, including locomotion (e.g. Adolph, Eppler & Gibson, 1993; Fajen, 2007; Snapp-Childs & Bingham, 2009; Warren, 1984; Warren & Whang, 1987), prehension (e.g. Bingham & Muchisky, 1993a, b; Mark, Nemeth, Gardner, Dainoff, Paasche, Duffy & Grandt, 1997; Mon-Williams & Bingham, 2011, Bingham, Snapp-Childs, Fath, Pan & Coats, 2014), bouncing a ball on a racquet (e.g. Schall, Atkeson & Sternad, 1996; Siegler, Bazile & Warren, 2013; Sternad, Duarte, Katsumata & Schaal, 2001), and interception (e.g. Fink, Foo & Warren, 2009; Oudejans, Michaels, Bakker & Dolné, 1996). More recent work has investigated the affordances of objects for maximum distance
throwing (Bingham, Schmidt & Rosenblum, 1989; Zhu & Bingham, 2008, 2010; Zhu, Dapena & Bingham, 2009; Zhu, Mirich & Bingham, 2014; Zhu, Shockley, Riley & Bingham, 2013). The current study extends this latter work to long distance targeted throwing; throwing for both distance and accuracy.
Throwing for distance and accuracy
Throwing for distance and accuracy is a uniquely human skill. Other animals, mostly primates, are known to be capable of throwing (chimps, e.g. De Wall, 2013, Goodall, 1986; capuchin monkeys, e.g. Westergaard & Suomi, 1994) but none for the kind of distance and accuracy demonstrated by human throwers1. Humans are uniquely specialised for throwing. We exhibit a range of throwing-specific anatomical adaptations (Roach, Venkadesan, Rainbow & Lieberman, 2013) that enabled the species to survive the ice ages by hunting and eating large prey animals (e.g. Isaac, 1987). Such hunting entailed socially coordinated use of throwing mediated by speech. The neural mechanisms
that support the exquisite timing required for long distance throwing also likely enable speech (PM Bingham, 1999; Calvin, 1983; Hopkins, Russell & Schaeffer, 2011). Furthermore, the well-known size-weight illusion may merely reflect a species specific adaptive tuning for the perception of object affordances for throwing (Bingham, et al., 1989; Zhu & Bingham 2011; Zhu, Shockley, Riley, Tolston & Bingham, 2013; see also Shockley, Carello & Turvey, 2004 for related work).
Throwing for distance and/or accuracy is a key feature of many professional sports and the biomechanics of the action are therefore well understood. However, as noted in a recent review (Urbin, 2012), we know very little about the underlying perception-action control mechanisms that produce the observed biomechanical outcomes. How does a thrower select the correct parameters to hit a target or maximize distance? This control question brings us to the issue of affordances, and how we might characterise and study these properties.
Affordances and Task Dynamics
Affordances are task specific (Bingham & Muchisky, 1995). They are dispositional properties of objects or events that support actions in specific tasks. The properties are dispositional because they are defined relative to properties of organisms that enable those organisms to perform the required actions. A classic example is grasping to move a graspable object. Graspable objects are of shapes, sizes, weights, and so on that are graspable by human hands, given the characteristic properties of those hands (e.g. Mon-Williams & Bingham (2011) for discussion and a model of graspability). Furthermore, affordances are about goal directed behaviour, that is, possible relations that might be achieved in the future by performing task specific actions, e.g. by performing a reach-to-grasp an object can be held in the hand and moved.
tokens were inevitably different, but each was nevertheless an instance of a particular identifiable type of action. The task dynamic approach describes the identity at the level of the generative task dynamics2. Because affordances are task specific, they are determined by the relevant task dynamics.
When throwing for distance and/or accuracy, the relevant dynamics are the dynamics of throwing coupled to the dynamics of projectile motion. The interface between the two dynamics occurs at the moment when the projectile is released from the hand and consists of three release parameters: release angle, release speed and release height. These are then the initial conditions of the object’s projectile motion (motion that unfolds without further interference from the thrower). The result is a successful throw if the release parameters lead to a projectile motion whose
trajectory either maximises distance or intercepts the target, depending on the task goals.
The task dynamics and affordances of throwing for maximum distance
The variables that determine the distance travelled under projectile motion are the object size and weight, the release angle, speed and height (strictly speaking, the difference between the release and landing heights), the air density and gravity. Maximizing distance requires a release angle of ~36° and a maximum release speed (Linthorne & Everett, 2006). Skilled throwers have been found to readily produce these release parameters when executing maximum distance throws (Zhu et al, 2009).
Assuming the optimal release angle of 36°, each individual thrower is able to generate a particular maximum release speed at a characteristic release height. The only remaining way to affect the distance of a throw is to perceptually identify and use an object of a size and weight that produces the maximum distance for those parameters. In other words, to achieve the largest thrown
distance, people must be able to perceive which objects best afford throwing for maximum distance. Ball weight affects the dynamics of both throwing and projectile motion while ball size only affects projectile motion, via air resistance (Zhu et al, 2009). Given a release speed and height and the optimal release angle, there is a function that relates object size and weight to distance travelled. For each object size, a certain weight produces a peak distance. As the size decreases the peak distance increases. So, changes of object size and weight map to a distance surface with a ridge of peaks (one for each size) and an overall peak at a smaller size. In this three dimensional space (size by weight by distance), the surface represents the affordance property for thrown objects (see Zhu & Bingham, 2008, Figure 2).
Research on the perception of the affordance property showed that skilled throwers are able to select objects that they can throw the farthest (Bingham, et al., 1989; Zhu & Bingham, 2008, 2010). For each object size, they selected the weight that they were able to throw the farthest. This showed that skilled throwers are able to perceive the affordance property. However, people are not born with the ability to perform long distance throws, only with the potential to acquire throwing skill. Likewise, people are not born with the ability to perceive the object affordance for throwing. Like the ability to throw long distance, the ability to perceive the affordance for throwing has to be learned. Zhu and Bingham (2010) found that the ability to perceive the affordance can be learned at the same time that the ability to throw long distance is acquired. Learning to perceive the
affordance requires that learners be able to see the distance to which they throw objects during training and practice of throwing. If learners are blindfolded to prevent their seeing the distance of their throws during practice, then they do learn to throw long distance, but they do not learn to perceive the affordance. If allowed to see the distances of their throws, then they do learn to perceive the affordance.
sampling of the space was sufficient to enable throwers to learn to perceive the affordance in general. The affordance was learned by sampling only different weights for a single object size, or different object sizes for a single object weight, or different sizes and weights of objects of a single density. Each of these allowed learners to acquire the ability to perceive the affordance over the entire space of throw-able sizes and weights. The restricted sampling was sufficient to allow
learners to attune to the information that specifies the affordance property. Once they were able to detect the relevant information, the information generalized to allow them to perceive the
affordance over the entire space.
The task dynamics and affordances of throwing for distance and accuracy: the current study
baseball, for instance, minimising flight time is often a critical constraint on action selection. This would entail using the portion of the affordance space corresponding to small angles and large release speeds. Other targeted throwing tasks entail different sub-goals. Lobbing a ball to your 5 year old child requires much lower speeds of release and consequently larger release angles. To be able to hit targets spontaneously and reliably in different targeted throwing tasks, throwers must be able to apprehend the entire affordance space. The portion of the affordance space used by a particular thrower will also be a subspace of the affordance for all throwers, depending on individual differences in the perceivers’ abilities to throw. So, for example, given gender differences in upper body strength that determine possible release speeds, women throwers may use a different portion of the affordance space than men do. Nevertheless, a given individual can train to develop the ability to use new and different portions of the full space. The goal of such training is to access those additional sub-spaces within the full space, so to formulate training goals, throwers must be able to apprehend the entire affordance space.
We now set out to investigate the affordance space for long distance targeted throwing. In Experiment 1, we varied locations of vertical target surfaces (three distances and three heights) while keeping the target size constant as well as the size and weight of the projectile, a tennis ball. We performed simulations of the relevant task dynamics to model the affordance space. Then, we tested three different groups of skilled throwers: US male college varsity baseball players, US female college varsity softball players, and UK university male cricket players. We tested their ability to hit the targets, which we found they achieved with ≈100% reliability. This suggested that they were able to perceive the affordance space. We recorded their throwing motions and measured the release speeds, angles and heights. We compared the measured release parameters with the modelled affordance space to determine how the space was being used by the different groups. We predicted that optimal portions of the space would be used depending on the abilities of the throwers.
Experiment 1
Experiment 1 has two strands. First, we experimentally measured the release parameters of expert throwers as they threw tennis balls to hit a target at each of 9 target locations. We were interested in whether and how the throwers scaled their throws to the different conditions. Second, we generated computer simulations of the projectile motion of a tennis ball to hit a 4ft radius target for a wide range of release parameters and identified which parameter combinations resulted in a hit. This analysis quantified the affordance property (‘hitability’) of the target under each target location condition. We then compared the human data to the simulations to identify whether changes in throwing as a function of target location mapped onto the hitability space and to determine what portions of the affordance space were used by throwers given individual differences.
Methods
Participants
There were 10 participants in total. 4 were male right handed cricketers from the University of Leeds (aged 20-23), all of whom had played up to at least club level. 3 were male right handed baseball players (aged 19-23) and 3 were female right handed softball players (aged 21-22), from the University of Wyoming, all of whom played at varsity level. Data collection was ethically approved by both the University of Wyoming and the Biological Sciences Faculty Research Ethics committee at the University of Leeds.
Design
(degrees), release speed (metres/second) and release height (metres). We therefore measured these as dependent variables.
Equipment
Identical setups were established in gyms at both Leeds and Wyoming. Video recordings were made using a Fastec Sportscam high-speed camera set at 250Hz, placed 10m from the plane of movement and zoomed so that the throw and the initial flight of the ball could be captured. A calibration video was recorded with a metre ruler in the shot to be used as a reference point every time the camera was set up or moved and dated to correspond with the appropriate throw video files. High voltage lamps were set up either side of the camera to illuminate the participant & ball.
Participants threw regulation size and weight fluorescent tennis balls to hit a 4ft x 4ft Perspex vertically oriented target. The target had a 30cm diameter circle marked on it at the center with crosshair lines clearly indicating the target center. The target heights we manipulated denote the height of this target center, and participants were instructed to aim for the center on all throws. We placed blue floor mats along the path from the thrower to the target to clearly mark the ground surface, and the target was moved at various heights in each distance as needed so that the thrower and camera could remain in place and calibrated.
Data Analysis
Each video (with corresponding calibration frame) was imported into MaxTraq (Innovision Systems) for analysis. The point of release was manually identified and the (x,y) coordinates of the ball were measured at this point to get the release height. We then tracked the location of the ball for 10 frames on either side of this point. This time series was low pass filtered (cut off frequency = 15Hz) and differentiated, and the resultant speeds (in x and y) were computed at the point of release. We then used the speeds at this frame to compute the release angle as tan-1(Vx / Vy).
Participants were brought in one at a time to the gym. They wore comfortable athletic clothing and were allowed to throw the tennis ball several times to warm up, both for maximum effort and to the target. They read the Participant Information sheet and signed the consent form.
The participant stood at a marked spot in front of the camera and the target was placed at a random Height/Distance combination. One experimenter counted the participant down from 3, pressing ‘record’ on 2 so as to capture the full motion of the throw with the pre-set 3s recording time. The participant threw on 1 with an overhand motion and no step. This enabled us to minimise the required video length to shorten time between the trials while the video downloaded to the laptop. The experimenter noted whether the throw was a hit or a miss, and this was repeated for 5 hits at this target location. This was repeated for the other two heights, then the distance was changed and the next 15 valid throws were recorded. The final 15 throws at the third height were then recorded and the session was complete. At the end of the session, which took approximately 90 minutes in total, the participants were debriefed and thanked.
Results
We analysed the release angle, speed and height separately in three mixed design ANOVAs, with Distance (3 levels: 5m, 10m, 15m) and Height (3 levels: 1m, 1.5m, 2m) as within subjects factors and Sport (3 levels: Cricket, Softball, Baseball) as a between subjects factor. For each Distance x Height combination, we averaged the measured values for the 5 hits. There was some data lost due to technical glitches with the equipment in Leeds (Participant 1, one trial of 15m x 1m; Participant 2, one trial each of 5m x 1m, 5m x 1.5m, 15m x 1m and 15m x 1.5m) and these averages are therefore from the remaining 4 trials in the cell.
Release Angle
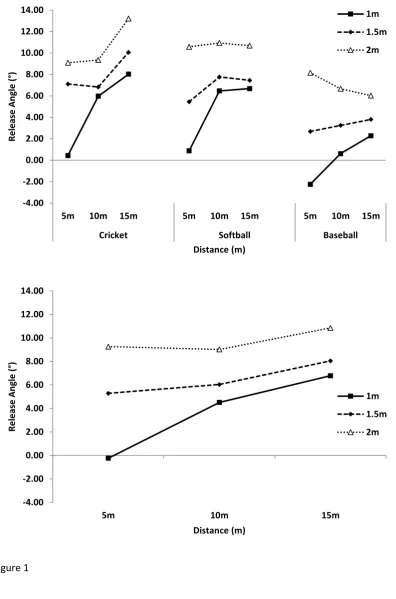
Target height affected release angle; throwers increased their angle as the center of the target moved up, and the amount of this change varied with Distance (Figure 1b). There were significant main effects of Sport (F(2,7) = 18.7, p<.01, Distance (F(2,14) = 42.2, p<.01) and Height (F(2,14) = 53.8, p<.01), as well as a significant Distance*Sport (F(4,14) = 5.0, p<.01) and Distance*Height (F(4,28) = 5.8, p<.01) interactions. All other effects were non-significant (ps >.75).
Release Speed
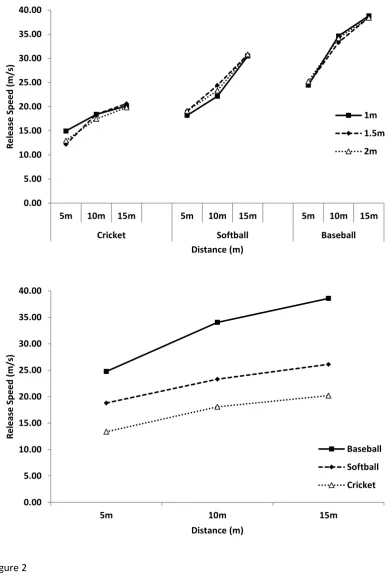
As shown in Figure 2, all groups increased their release speeds with target distance. Baseball players increased their speeds more for each change in distance than did participants in the other two groups (Figure 2b). Target Height had no effect on release speed. Cricketers threw much more slowly than baseball and softball players, in line with other work (Freeston & Rooney, 2014). There were significant main effects of Sport (F(2,7) = 17.7, p<.01) and Distance (F(2,14) = 300.6, p<.01) and a significant Distance*Sport interaction (F(4,14) = 17.3, p<.01). All other effects were non-significant (ps >.2).
The release speed and angle analyses showed that the expert throwers chose to throw balls with a fast and relatively flat trajectory. However, given the reliable variation in release speed as a function of target distance, participants did not simply select a maximum speed and vary the angle. They scaled their throws to the distance of the target by controlling both parameters. This, and the fact that accuracy was close to 100% suggests that they could clearly perceive, and thus use, the affordance space.
Release Height
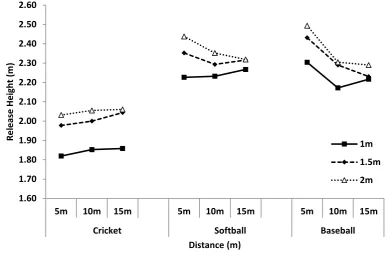
trajectory for those targets but suggests that there is a limit to how useful this trick is as the required distance increases. Release heights were not available for one cricketer in the 1m Height condition due to technical problems with the videos; this alters the degrees of freedom for the analysis. There were significant main effects of Sport (F(2,6) = 6.1, p<.05), Distance (F(2,12) = 9.6, p<.01) and Height (F(2,12) = 22.4, p<.01), as well as a significant Distance*Sport interaction (F(4,11) = 6.3, p<.01) and Distance*Height (F(4,24) = 6.5, p<.01). All other effects were non-significant (ps >.25).
Summary of the release parameter analysis
The first goal of this study was to determine which combination of release parameters expert throwers chose, and whether this choice varied as a function of the distance and height of the target. Participants from three ball sports all scaled their actions to the task requirements; release speed increased with Distance and release angle increased with both Distance and Height. There was also some variation in release height as a function of the target location. This pattern shows that experts prefer to ‘throw a rope’, i.e. produce fast, flat trajectories. These trajectories minimise the time it takes to cross the required distance, and time is typically a factor in these sports. So, a sub-goal emerged for the long distance targeted throwing task in the context of these sports, namely, hit the target in brief time. This, along with individual differences, appeared to determine which portions of the affordance space the throwers used.
Now that we have empirically characterised the behaviour of expert throwers, we turned to our affordance analysis to see whether this can explain the specific combinations of chosen release parameters.
Simulation Analysis
We implemented the equations of projectile motion in a bespoke Labview programme (National Instruments; see Appendix 1 for details). We specified the tennis ball (mass, drag
computed the outcome (hit or miss) of each simulated throw. We ran the equations within two loops, one for variation in release angle (ranging from -30° to 90°; this range emerged from the simulations as necessary to map the complete affordance structure for all target locations) and one for variation in release speed (here ranging from 0ms-1 to 45ms-1; our highest observed release speed across the two experiments reported below was 45.01ms-1). The number of increments for each loop defines the simulation resolution. We set these to 400 for each loop yielding 16,000 data points per plot. The resulting simulations were dense enough to reveal the affordance structure but not so dense as to require more than a standard PC to generate in a reasonable amount of time.
For this experiment, we generated 117 simulations (3 target distances x 3 target heights x 13 release heights (1.5m-2.7m in 0.1m increments, which spans the observed range of heights). We produced heat maps in Matlab R2013a (Mathworks) to illustrate which regions of the space produced hits and how this changed with changes in target parameters.
Target Affordances
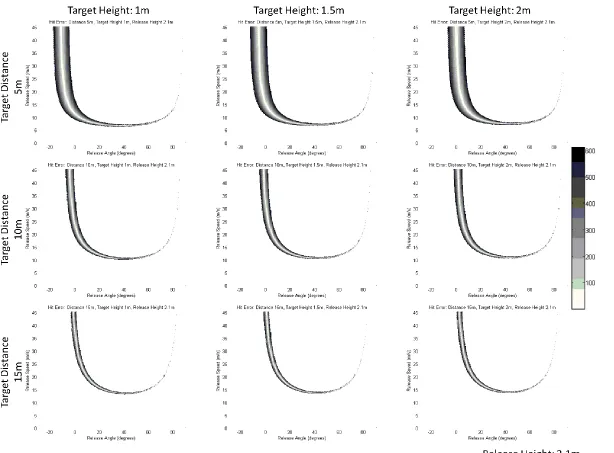
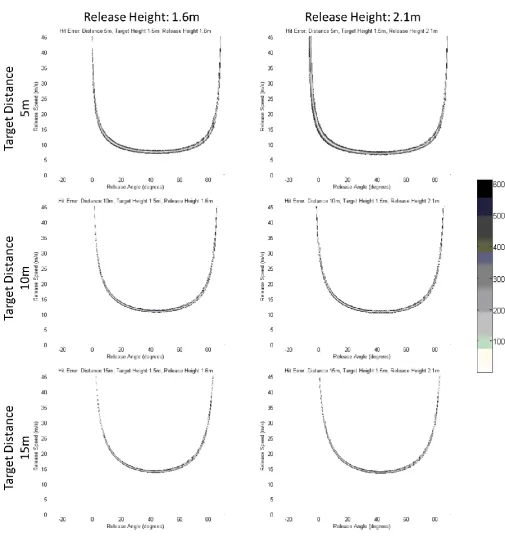
Refer to Figure 4 where we present example simulation results for a range of release
parameters. Target Height varies across the grid, target Distance down the grid; release height is set at 2.1m (mid-point of the observed range; see the online supplemental file ‘Animated Hit
The first thing to note is that the affordance is not a single value. There are many ways to successfully actuate this affordance and hit the target.
The second thing to note is that the location of the affordance in the release parameter space varies continuously with variation in the task parameters (see Slide 1 of the online supplement file ‘Animated Hit Canyons.pptx’ for a clearer demonstration of this). The whole hit canyon moves up or down with changes in required speeds, but it stretches and compresses with changes in required angles (the right hand side remains fixed). The basic pattern of variation is as follows (see Slide 2 of the online supplement for animated examples):
As the Target Height increases, the affordance moves steadily to the right (i.e. the required
release angle increases). The affordance subspace does not move up or down (i.e. the required release speed does not change).
As the Target Distance increases, the affordance moves both steadily to the right and up (i.e.
both the required release angle and speed increase).
As Target Distance increases, the affordance region becomes smaller (the target becomes
harder to hit). We computed the size of the hit canyons as a proportion of the total simulated space as a rough measure of this; at 5m the hit canyon was 10.3% of the space, at 10m, 5% and at 15m, 3.8%.
For a given target location (the same Distance and Height), the affordance subspace moves
steadily to the left as the release height increases (initially higher throws must be angled down to hit a given target).
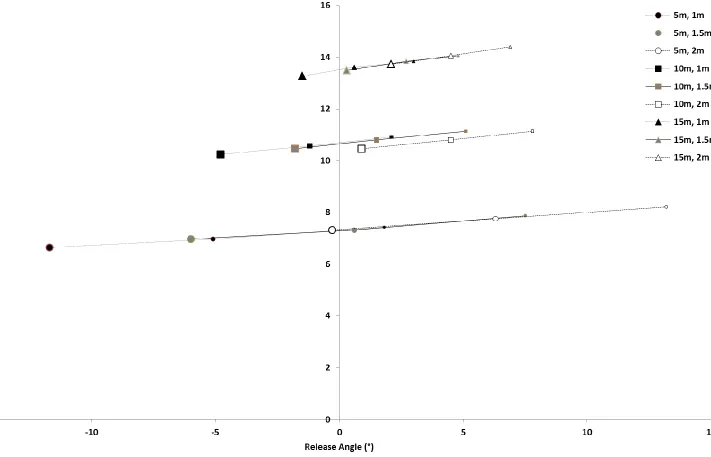
speed. For a given Height, increases in Distance increase both the most stable angle and the most stable speed (compare, for example, the large black circle, square and triangle on the plot and see that they are moving both up and to the right). This pattern accords nicely with the ANOVA results from the thrower’s data; participant release speeds varied with Distance only but release angles varied with both Distance and Height.
Some regions of the affordance subspace are therefore more stable than others. Rows where the ‘hit’ region is wide indicates a release speed with a high tolerance for error in release angle production. Conversely, columns where the ‘hit’ region is high indicates a release angle with a high tolerance for error in release speed production. There are tradeoffs; the widest region (at the bottom of the hit canyon) provides minimal tolerance for error in release speed, for example.
However, the thicker region to the left provides maximum tolerance for error in release speed with a modestly large tolerance for error in release angle. This area is the most stable region of the
affordance space. Were the throwers operating in this stable region?
Human performance vs. the simulations
We plotted both simulation data and human data on the same plots. The human data varied in release height as well as release speed and angle, and as described above the exact location of the 2D hit canyon varied with release height. While this accords nicely with the task dynamical analysis, it also meant that there was no single 2D affordance plot that allows for comparing with the collated human data. This made visualising the data somewhat difficult.
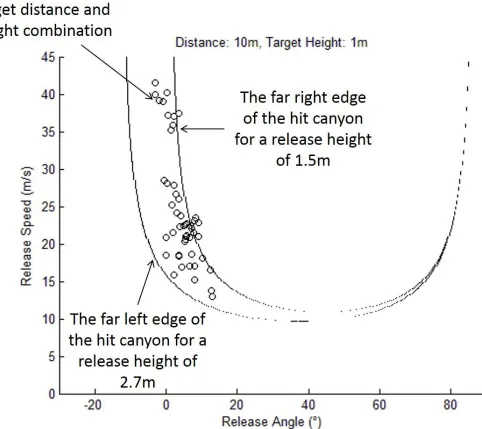
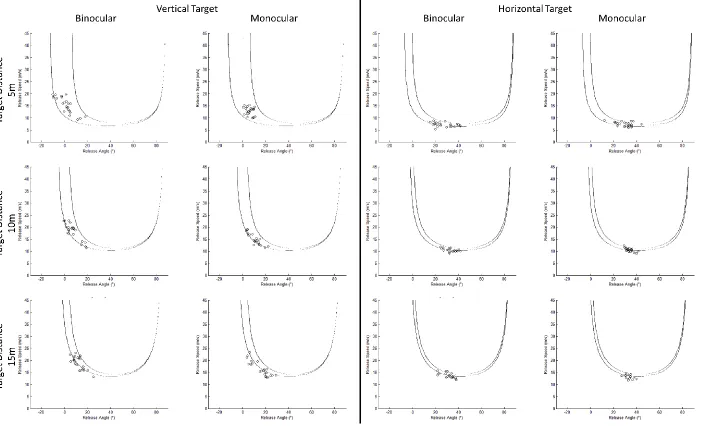
As shown in Figure 6, our solution was to plot the human data together with lines
release heights. For each of our 9 target locations, we therefore plotted the left hand edge of the 2.7m hit canyon and the right hand edge of the 1.5m hit canyon to show the maximum predicted spread in the data. We then plotted the release angle/speed data for each individual throw to a given target location (5 throws per participant, 10 participants = 50 throws per plot).
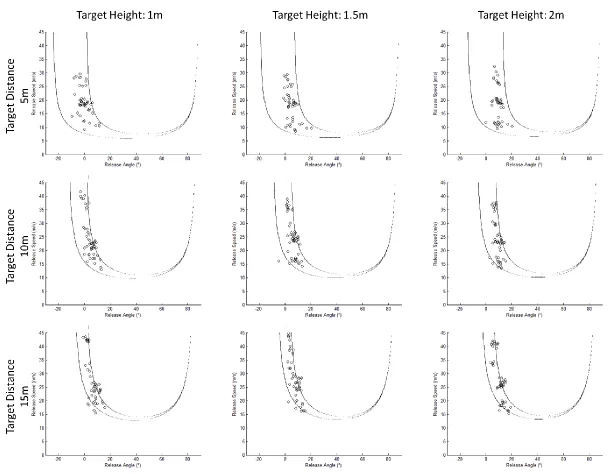
As shown in Figure 7, the simulations have, in general, done a good job of capturing both the location and the spread of the data. For targets at 5m, where there is a wide range of viable release parameters available, there is a wide range of parameters observed. As the distance increases and the target becomes significantly harder to hit (that is, the range of viable release parameters that are available becomes more narrow), performance becomes comparably less variable as the experts respond to the changing task demands.
The experts did use a highly stable region of the affordance space. They opted for maximum stability with respect to release speed and the consequent adequate stability with respect to release angle. This makes sense; high release speeds require exquisite timing between multiple body
segments and muscle groups and so it is this parameter that is the most susceptible to minor errors in execution. Nevertheless, there were also individual differences in respect to the portion of this more stable part of the space that participants used and in particular, in respect to the release speeds. For instance, the female softball players exhibited lower speeds than did the male baseball players.
The simulations, while effective, have clearly not captured everything about human performance; there are throws that produced hits on the real target but that the simulations
consider a miss. This could be due to the drag coefficient used in the simulations. We set this to 0.55 (Chadwick & Haake, 2000) but it is known to vary experimentally trial to trial from .51 to .7 (Mehta & Pallis, 2001; Štěpánek, 1988). Another possibility is that the simulations do not include any
Lindsey (2014) recently illustrated this effect. They also noted that texture on the ball’s surface can also alter the ball’s flight path.
Experiment 2
In Experiment 1, expert throwers executed their throws in response to changes in the target’s affordance generated by variations in target location (distance and height). This suggested that the throwers perceived the affordance and used it to generate the appropriate release parameters. However, it remained possible that our throwers (all fairly high level ball players) were simply highly practiced at ‘throwing a rope’ (fast and flat) at the targets tested in Experiment 1. The throwers may therefore have chosen and controlled their throws based on their extensive detailed past experience with the given target conditions. The fact that they operated in the most stable region of the
affordance space might simply reflect extensive past trial and error, rather than the result of perceiving the space of possibilities at the time of the throw and using the most robust option. Experiment 2 was designed to test these possibilities.
We also introduced a simple perceptual manipulation to begin investigating the visual perception of the affordances. We tested throwers using both binocular and monocular vision and compared performance in the two conditions. Because the target is always at least 5m away, we did not expect binocular vision to be necessary to perceive the target, although we did expect
monocular vision to lower the stability of that perception, as measured by performance (Bingham & Pagano, 1998).
Method
Participants
There were 5 participants in total, 4 male (3 right handed) and 1 female (right handed). All had at least 5 years’ experience in a throwing sport (cricket). Two other male participants did not
complete the data collection sessions. Data collection was ethically approved by the Biological Sciences Faculty Research Ethics committee at the University of Leeds.
Design
There were three within subject factors. The first was Distance to the target (3 levels: 5m, 10m and 15m). The second was the Orientation of the target (2 levels: Vertical, Horizontal). The third was the Vision manipulation (2 levels: Binocular, Monocular). Target Height was not manipulated in this experiment and was constant at 1.5m.
All participants performed 5 successful throws in each Distance * Orientation * Vision
condition for a total of 60 throws. Conditions were blocked. Participants threw to targets at 5m, then 10m, then 15m in the Vertical/Binocular condition, then in the Horizontal/Binocular,
Vertical/Monocular and finally the Horizontal/Monocular condition.
Procedure
The equipment, data analysis and basic procedure were the same as in Experiment 1. In particular, participants were not instructed how to perform their throws. Throwing modes were spontaneously chosen by the participants.
Results
We again analysed three release parameters; release angle, release speed and release height. Each participant made 5 successful throws in each of the 12 conditions (60 throws total) and for each participant we averaged these 5 throws for analysis. These averages were entered into a separate repeated measures Analysis of Variance (ANOVA) for each dependent variable, with Distance (3 levels: 5m, 10m and 15m), Orientation (2 levels: vertical, horizontal) and Vision (2 levels: Monocular, Binocular) as fully within subject factors.
There were several lost data points due to technical problems with the video recordings. One participant was missing 2 trials from the 10m/Horizontal/Monocular condition and this data point is the average of the remaining three trials. The same participant was missing all 5 trials of the
15m/Horizontal/Vertical condition and this data point was replaced with the average of the other 4 participants in that condition.
Release Angle
There were non-significant trends for the main effect of Vision (F(1,4) = 6.9, p = .059) and the Distance * Orientation interaction (F(2,8) = 3.5, p = .082). All other effects were non-significant (ps >.4).
Release Speed
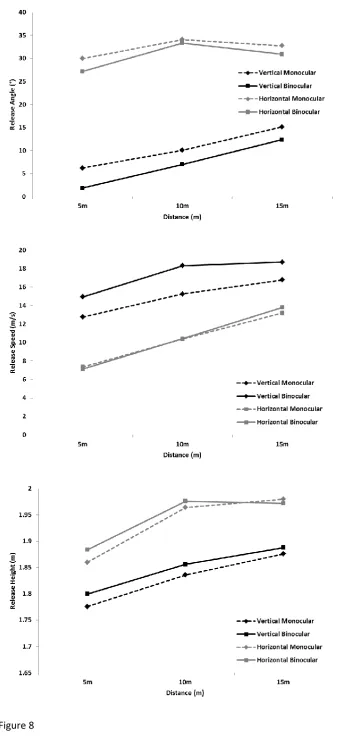
As shown in Figure 8b, release speeds were lower for the Horizontal condition, matching the altered mode of throwing (from ‘throwing a rope’ to a high looping throw). When release speeds were higher, in the Vertical target condition, the Vision condition had a consequence; participants reduced their speed in the Monocular condition. This is a conservative change, and it suggests that even though the target affordances were clearly perceived monocularly, they were perceived less stably, and throwers were sensitive to this change. There was a significant main effect of Distance (F(2,8) = 60.34, p<.01). Pairwise comparisons with the Bonferroni correction applied showed that release speed at 5m was significantly lower than 10m and 15m (both ps <.01) and that release speed at 10m was significantly different from that at 15m (p <.05). There were also significant main effects of Orientation (F(1,4) = 29.6, p<.01) and of Vision (F(1,4) = 16.0, p<.05), both modified by a
significant Vision * Orientation interaction (F(1,4) = 9.3, p<.05). In the vertical target orientation release speeds were faster in the binocular condition than the monocular condition (t(4) = 3.6, p<.05) but not in the horizontal target condition (t(4) = 1.0, p = .39).
There was a non-significant trend for the Distance * Orientation interaction (p=.061). All other effects were non-significant (ps>.2).
Release Height
of Orientation (F(1,4) = 9.4, p<.05) and of Distance (F(2,8) = 12.9, p<.01). Pairwise comparisons with the Bonferroni correction applied showed that release height at 5m was significantly lower than at both 10m and 15m (both ps <.05) but that release heights were the same at 10m and 15m (p = 1). All other effects were non-significant (ps>.35).
Summary of the release parameter analysis
Experiment 2 replicated the results from the cricketers in Experiment 1 using the vertical target. We then extended the results to show that throwers selected a different throwing mode to hit a horizontal target. Throws were again scaled within this new mode to account for changes in distance and vision. Throwers did not simply ‘throw a rope’ under all conditions. They flexibly selected different modes as appropriate for crossing the required distance given the target orientation, suggesting that they perceived the different affordances of the differently oriented targets.
Human performance vs. the simulations
We adapted the Labview simulation to include a specification of the horizontal target. All else remained the same. We generated 6 illustrative simulations, 3 target distances x 2 release heights (1.6m and 2.1m, the observed range of heights for this experiment; see Figure 9). Compare these to the example hit canyons for the vertical target in Figure 4.
The first thing to note is that across all conditions, the hit canyon got smaller. Fewer
combinations of release parameters resulted in hits, i.e. the horizontal target was harder to hit. The hit proportions for the horizontal targets were 36% (5m), 43% (10m) and 53% (15m) the size of the vertical target hit canyons. Accuracy remained high across both experiments however, with few misses recorded.
simply slam the ball into the target, but must more carefully place their throw. This changes the location of the most stable part of the space. While the prongs provide a high tolerance for error in release velocity, they provide almost no tolerance for error in release angle. The thickest part of the canyon is now at the bottom, with higher release angles and lower speed. This is the portion of the affordance subspace for horizontal targets that we expected the throwers to use if they perceived the space.
The horizontal hit canyons change their location in the space with changes in release height in a way similar to the vertical target hit canyons so we replicated the technique described in Figure 6 and plotted the human together with lines representing the extreme edges of the hit canyons for the release heights observed in the experiment. In this case the right hand edge comes from the simulation for a release height of 1.6m and the left hand edge comes from the release height of 2.1m, matching the observed range. (NB the translation of the space sideways, caused by changes in release height, yield apparent changes in the size of the subspace. These are merely apparent, not actual, and do not change the loci of most stable performance predicted for this condition.) Refer to Figure 10, which shows the replication of the vertical target result for reference and the new result for the horizontal target, each split by distance and vision condition.
Overall, again, the simulations have done a good job of capturing the human performance data with the same caveats as before (spatial resolution of the measurements, factors such as ball spin that are not included in the simulations, etc). Importantly, it is clear that the throwers have moved their throws into the different most stable region of the space (shown in Figure 9). They clearly perceived the target affordances and how these changed with the orientation of the target.
Discussion – Experiment 2
mode, the throwers scaled their release parameters (speed, angle and height) to accommodate variations in distance. Monocular vision did lead to more conservative throws, but only when the release speeds were high (presumably close to these throwers’ top speed, although we did not measure this here). In the horizontal target condition, when release speeds were already low and therefore easier to reliably produce, there was no need to be more conservative and participants did not change their behaviour.
General Discussion
In two experiments, we tested the ability of expert throwers to perceive the affordance for hitting a target by measuring how their actions changed as the affordance changed. Experts scaled their actions to use the affordance offered by targets which varied in distance, height and
orientation, and the way in which throwers did so mirrored the stability characteristics of the affordance that we quantified by simulating the relevant task dynamics (projectile motion). These results suggested that the experts perceived the relevant affordance and used it to perform appropriate actions. These results also support a task dynamics approach to the study of affordances.
Projectile motion simulations were used to generate a description of the affordance space. The resulting space well predicted the throwing performance characteristics. In Experiment 1, the affordance analysis predicted that throwers would use the most stable portions of the affordance space and that the most stable release speeds resulting in hits would increase with distance, while the most stable release angles resulting in hits would increase with both distance and target height. The expert performance matched this pattern, tracking the most stable portions of the affordance space (Figure 5). Variability in performance also varied with the relative stability of the affordance. There was always wide variation in release speed because changing release speeds impacted the stability of the affordance space less than changing the release angles. In Experiment 2, the
affordance space generated by simulations also predicted the observed change in throwing mode by revealing how the affordance changed with target orientation.
The task dynamical approach to affordances
2014; Turvey et al, 1981; Withagen, de Poel, Araújo & Pepping, 2012). Following Bingham and Muchisky (1995), the current work has taken a specific stand on how to conceptualise and empirically investigate affordances, by treating them as properties of tasks best described at the level of dynamics. This section will defend that stand.
Gibson (1979) described the affordances of the environment as “what it offers the animal, what it provides or furnishes, either for good or ill” (pg. 127) but then rather infamously went on to say
…an affordance is neither an objective property nor a subjective property; or it is both if you like. An affordance cuts across the dichotomy of subjective-objective and helps us to understand its inadequacy. It is equally a fact of the environment and a fact of behavior. It is both physical and psychical, yet neither. An affordance points both ways, to the environment and to the observer. (pg 129).
Researchers have since struggled to formalise this into something that can guide research programs. Turvey, Shaw, Reed and Mace (1981) described affordances as dispositional properties of the environment (see also Turvey, 1992). This approach is exemplified in the first studies on
subsequent study, Warren measured passible apertures in shoulder width units (Warren and Whang, 1987). This matches Gibson’s ‘points both ways’ requirement very effectively. The disposition also exists regardless of whether the complement is present. This is useful because Gibson notes later that
An affordance is not bestowed upon an object by a need of an observer and his act of perceiving it. The object offers what it does because it is what it is. (pg. 139)
The second attempt was to treat affordances as relations between objects and an organism’s abilities (e.g. Chemero, 2003; Rietvald & Kiverstein, 2014). Chemero (2009) then updated his account to suggest that affordances and abilities interact in real time and define each other more
dynamically. This was motivated by concerns that dispositions, by definition, must be effected when the relevant conditions are met. This seems to rule out the possibility of failing to effect an
affordance when presented with one you can detect, even though we know actions systems can malfunction; you can miss a target, and you do not immediately and continuously throw things even when surrounded by beckoning targets. The relational accounts address this and also do the same work as dispositions on the ‘points both ways’ front.
However, this work (of explaining individual variation in performance) is readily explained by variation in the perception and actualisation of the affordance property. The affordance is a
currently perceived possible future relational states between the organism and the environment. If a person can perceive that he or she could sit on a given surface, then he or she can guide behaviour to achieve the sitting relation. Describing affordances as dispositional properties is consistent with this approach to goal directed behaviour, but describing affordances as relations robs the idea of its motivating purpose. Thus, this latter approach seems like a dead end for affordance research.
We have cut through this debate somewhat by focusing on what affordances are and what they are for. Affordances are task specific. Tasks are identified at the level of dynamics (Bingham, 1995) and so, therefore, are affordances. Perceiving an affordance then constrains the space of possible actions to a subspace of functional actions; affordances are for action selection.
The task of throwing for distance and accuracy is to generate a projectile motion that intercepts a target. This means the release parameters must be in the set that will result in hitting the target. This set is what the target is offering you in order to hit it; for us, what it affords. We identified this set (the affordance) by simulating projectile motions. The simulations were performed using information about the target and the ball and the outcome of the throw. The hit canyons in our plots are the affordance for our target placed at some distance, orientation and height to be hit by a tennis ball undergoing projectile motion.
Our account also copes with all the various things affordances need to explain. It accounts for individual variation in performance by identifying the affordance as an extended set of
functionally equivalent actions that are then perceived and used by individuals with varying capacities. This, in turn, also allows different people to be related to one another in respect to possibilities for action, that is, perceiving affordances for others (e.g. Fajen, Riley & Turvey, 2008; Passos, Cordovil, Fernandes & Barreiros, 2012; Rochat, 1995; Stoffregen, Gorday, Sheng & Flynn, 1999). Our account provides theoretical rigour to Gibson’s definition but remains true to the key ideas, in particular that affordances exist prior to anyone trying to effect them. This makes them the kind of properties that can guide both learning, and also real time action selection and execution after learning. If affordances cannot support these behaviours then they are not psychologically interesting. The success of our task dynamical affordance analysis at guiding the research and accounting for the results supports the view that affordances are best treated as properties of tasks and events.
Summary
accuracy. This extends work on the affordances of throwing for maximum distance and further elaborates a theoretical and methodological framework for studying affordances more generally. Throwing is also a fascinating task in and of itself, and this work begins to fill a gap in our
References
Adolph, K. E., Eppler, M. A. & Gibson, E. J (1993). Crawling versus walking infants' perception
of affordances for locomotion over sloping surfaces. Child Development: Special Issue on
Biodynamics, 64, 1158-1174.
Bingham, G.P. (1988). Task specific devices and the perceptual bottleneck. Human Movement Science, 7, 225-264.
Bingham, G.P. (1995). Dynamics and the problem of visual event recognition. In Port, R. & T.
van Gelder (eds.), Mind as Motion: Dynamics, Behavior and Cognition, (pp403-448). Cambridge, MA:
MIT Press.
Bingham, G.P. & Muchisky, M.M. (1993a). Center of mass perception and inertial frames of
reference. Perception & Psychophysics, 54 (5), 617-632.
Bingham, G.P. & Muchisky, M.M. (1993b). Center of mass perception: Perturbation of
symmetry. Perception & Psychophysics, 54 (5), 633-639.
Bingham, G.P. & Muchisky, M.M. (1995). Center of mass perception: Affordances as dispositions determined by dynamics. In J. Flach, P. Hancock, J. Caird & K. Vicnte (eds.) Global Perspectives on the Ecology of Human-Machine Systems,(pp. 359-395). LEA Publishers, Hillsdale, NJ.
Bingham, G.P., Rosenblum, L.D. & Schmidt, R.C. (1995). Dynamics and the orientation of kinematic forms in visual event recognition. Journal of Experimental Psychology: Human Perception and Performance, 21(6), 1473-1493.
Bingham, G.P., Schmidt, R.C., & Rosenblum, L.D. (1989). Hefting for a maximum distance
throw: A smart perceptual mechanism. Journal of Experimental Psychology: Human Perception and
Bingham, P. M. (1999). Human uniqueness: a general theory. Quarterly Review of Biology, 74,
133–169.
Calvin, W. H. (1983). The Throwing Madonna: Essays on the Brain. New York: McGraw-Hill.
Chadwick, S. G., & Haake, S. J. (2000). The drag coefficient of tennis balls. Proceedings of the
3rd International Conference on the Engineering of Sport, 169-176.
Chemero, A. (2003). An outline of a theory of affordances. Ecological Psychology, 15 (2), 181-195.
Chemero, A. (2009). Radical Embodied Cognitive Science. Cambridge, MA: MIT Press.
Cooke, A. J. (2000). An overview of tennis ball aerodynamics. Sports Engineering, 3(2), 123-129.
Cross, R., & Lindsey, C. (2014). Measurements of drag and lift on tennis balls in flight. Sports Engineering, 17(2), 89-96.
De Waal, F. (2013). The bonobo and the atheist: In Search of Humanism Among the Primates. Norton: NYC, NY.
Fajen, B. R. (2007). Affordance-based control of visually guided action. Ecological Psychology,
19(4), 383-410.
Fajen, B.R., Riley, M.A. & Turvey, M.T. (2008). Information, affordances and the control of action in sport. International Journal of Sport Psychology, 40, 79-107.
Fink, P. W., Foo, P. S., & Warren, W. H. (2009). Catching fly balls in virtual reality: A critical test
of the outfielder problem. Journal of Vision, 9(13), 14.
Franchak, J., & Adolph, K. (2014). Affordances as Probabilistic Functions: implications for
Freeston, J. & Rooney, K. (2014). Throwing speed and accuracy in baseball and cricket players.
Perceptual & Motor Skills: Exercise & Sport, 118(3), 637-650.
Gibson, J. J. (1979). The ecological approach to visual perception. Boston: Houghton Mifflin.
Golonka, S., & Wilson, A. D. (2012). Gibson’s ecological approach - a model for the benefits of a theory driven psychology. Avant, 3(2), 40-53.
Goodall, J. (1986). The Chimpanzees of Gombe: Patterns of Behavior. Cambridge: Harvard University Press.
Hopkins, W., Russell, J., & Schaeffer, J. (2011). The neural and cognitive correlates of aimed throwing in chimpanzees: a magnetic resonance image and behavioural study on a unique form of social tool use. Philosophical Transactions of the Royal Society B: Biological Sciences, 367 (1585), 37-47.
Isaac, B. (1987). Throwing and human evolution. African Archaeological Review, 5(1), 3-17.
Lashley, K.S. (1951). The problem of serial order in behaviour. In L.A. Jeffress (Eds.) Cerebral mechanisms in behaviour: The Hixon Symposium (pp. 112-146). New York, Wiley.
Linthorne, N. P., & Everett, D. J. (2006). Soccer: Release angle for attaining maximum distance in the soccer throw-in. Sports Biomechanics, 5(2), 243-260.
Mark, L. S., Nemeth, K., Gardner, D., Dainoff, M. J., Paasche, J., Duffy, M. & Grandt, K. (1997). Postural dynamics and the preferred critical boundary for visually guided reaching. Journal of Experimental Psychology: Human Perception & Performance, 23, 1365–1379.
Mon-Williams, M. & Bingham, G.P. (2011). Discovering affordances that determine the spatial structure of reach-to-grasp movements. Experimental Brain Research, 211(1), 145-160.
Mumford, S. (2003). Dispositions. Cambridge; Oxford University Press.
Oudejans, R. R., Michaels, C. F., Bakker, F. C., & Dolné, M. A. (1996). The relevance of action in perceiving affordances: perception of catchableness of fly balls. Journal of Experimental Psychology: Human Perception and Performance, 22(4), 879.
Passos, P., Cordovil, R., Fernandes, O. & Barreiros, J. (2012). Perceiving affordances in rugby union. Journal of Sports Sciences, 30(11), 1175-1182.
Reed, E. (1996). Encountering the World. New York: Oxford University Press.
Rietveld, E. & Kiverstein, J. (2014). A rich landscape of affordances. Ecological Psychology 26, 325-352.
Roach, N. T., Venkadesan, M., Rainbow, M. J. & Lieberman, D. E. (2013). Elastic energy storage in the shoulder and the evolution of high-speed throwing in Homo. Nature, 498, 483-487.
Rochat, P. (1995). Perceived reachability for self and for others by 3- to 5-year old children and adults. Journal of Experimental Child Psychology, 59, 317-333.
Saltzman, E. & Kelso, J. A. S. (1987). Skilled actions: A task-dynamic approach. Psychological
Review, 94(1), 84-106.
Scarantino, A. (2003). Affordances explained. Philosophy of Science, 70(5), 949-961.
Schaal, S., Atkeson, C. G., & Sternad, D. (1996). One-handed juggling: A dynamical approach to
a rhythmic movement task. Journal of Motor Behavior, 28, 165–183.
Shockley, K., Carello, C., & Turvey, M. T. (2004). Metamers in the haptic perception of
Siegler, I. A., Bazile, C., & Warren, W. H. (2013). Mixed control for perception and action:
timing and error correction in rhythmic ball-bouncing. Experimental Brain Research, 226(4), 603-615.
Štěpánek, A. (1988). The aerodynamics of tennis balls—the topspin lob. American Journal of
Physics, 56(2), 138-142.
Sternad, D., Duarte, M., Katsumata, H., & Schaal, S. (2001). Bouncing a ball: tuning into
dynamic stability. Journal of Experimental Psychology: Human Perception and Performance27,
1163–1184.
Snapp-Childs, W. & Bingham, G.P. (2009). The affordance of barrier crossing in young children
exhibits dynamic, not geometric, similarity. Experimental Brain Research, 198(4), 527-533.
Stoffregen, T. (2003). Affordances as properties of the animal-environment system. Ecological Psychology, 15 (2), 115-134.
Stoffregen, T.A., Gorday, K.M., Sheng, Y.Y. & Flynn, S.B. (1999). Perceiving affordances of another person’s actions. Journal of Experimental Psychology: Human Perception and Performance, 25(1), 120-136.
Turvey, M. T. (1992). Affordances and prospective control: An outline of the ontology.
Ecological Psychology, 4(3), 173-187.
Turvey, M. T., Shaw, R. E., Reed, E. S., Mace W. M. (1981). Ecological laws of perceiving and acting: In reply to Fodor and Pylyshyn (1981). Cognition, 9 (3), 237-304.
Urbin, M. A. (2013). Visual regulation of overarm throwing performance. Experimental Brain Research, 225(4), 535-547.
Warren, W. H., & Whang, S. (1987). Visual guidance of walking through apertures: Body-scaled information for affordances. Journal of Experimental Psychology: Human Perception and
Performance, 13, 371-383.
Westergaard, G. C., & Suomi, S. J. (1994). Aimed throwing of stones by tufted capuchin
monkeys (Cebus apella). Human evolution, 9(4), 323-329.
Wilson, A. D., & Bingham, G. P. (2001). Dynamics, not kinematics, is an adequate basis for
perception – Commentary on Shepard (2001). Behavioral and Brain Sciences, 24(4), 709-710.
Wilson, A.D. & Golonka, S. (2013). Embodied cognition is not what you think it is. Frontiers in
Psychology 4, 58.
Withagen R, de Poel, H.J., Araújo, D., & Pepping, G. (2012). Affordances can invite behavior: Reconsidering the relationship between affordances and agency. New Ideas in Psychology, 30, 250-258.
Zhu, Q. & Bingham, G.P. (2008). Is hefting to perceive affordances for throwing is a smart
perceptual mechanism? Journal of Experimental Psychology: Human Perception and Performance,
34, 929-943.
Zhu, Q. & Bingham, G.P. (2010). Learning To Perceive the Affordance for Long-Distance
Throwing: Smart Mechanism or Function Learning? Journal of Experimental Psychology: Human
Perception and Performance, 36(4), 862-875.
Zhu, Q., Dapena, J. & Bingham, G.P. (2009). Learning to throw to maximum distances: Do
changes in release angle and speed reflect affordances for throwing? Human Movement Science,
28(6), 708-725.
Zhu, Q. & Bingham, G.P. (2011). Human readiness to throw: the size-weight illusion is not an
Zhu, Q., Mirich, T., & Bingham, G.P. (2014). Perception of relative throw-ability. Experimental
Brain Research, 232(2), 395-402.
Zhu, Q., Shockley, K., Riley, M. & Bingham, G.P. (2013). Felt heaviness is used to perceive the
affordance for throwing, but rotational inertia does not affect either. Experimental Brain Research,
Figure Captions
Figure 1. a) Release angles in Experiment 1 sorted by Distance, Height and Sport. b) The Distance * Height interaction. All softball players were female, the rest are male.
Figure 2. a) Release speeds in Experiment 1 sorted by Distance, Height and Sport. b) The Distance * Sport interaction. All softball players were female, the rest are male.
Figure 3. Release heights in Experiment 1 sorted by Distance, Height and Sport. All softball players were female, the rest are male.
Figure 4. Example heat maps of the hit canyons from the simulations of vertical targets for all target locations and a release height of 2.1m. For each sub-figure, the x-axis is the release angle (ranging from -30° to 90°) and the y-axis is the release speed (ranging from 0ms-1 to 45ms-1). The white region codes a miss, the shaded regions code hits of varying amount of error from the centre of the simulated target. See the online Supplementary File ‘Animated Hit Canyons.pptx’ for more examples. Figure 5. Plot of the locations of the maximum stability of the hit canyons in release angle/release speed coordinates. DISTANCE: Circles represent targets at 5m, squares targets at 10m and triangles targets at 15m. TARGET HEIGHT: Black symbols represent targets at 1m, grey symbols targets at 1.5m and white symbols targets at 2m. The lines each connect data from release heights of 1.5m, 2.1m and 2.7m. See text for further details.
Figure 6. Example plot comparing human data to simulations. To address the issue of variation in release height in the human data while keeping the plots two dimensional, we plotted the extreme edges of the hit canyons from the lowest and highest simulated release heights and used these to compare to the human data; use this plot in combination with Figures 7 and XX.
Figure 7. Direct comparison of the human data and simulation predictions for Experiment 1. For each sub-figure, the x-axis is the release angle (ranging from -30° to 90°) and the y-axis is the release speed (ranging from 0ms-1 to 45ms-1).
Figure 8. a) Release angles in Experiment 2 sorted by Distance, Orientation and Vision condition b) Release speeds in Experiment 2 sorted by Distance, Orientation and Vision condition c) Release heights in Experiment 2 sorted by Distance, Orientation and Vision condition.
Figure 9. Example heat maps of the hit canyons from the simulations of horizontal targets for three target distances and release heights of1.6m and 2.1m. For each sub-figure, the x-axis is the release angle (ranging from -30° to 90°) and the y-axis is the release speed (ranging from 0ms-1 to 45ms-1). The white region codes a miss, the shaded regions code hits of varying amount of error from the centre of the simulated target.
Online Supplementary File: Animated Hit Canyons.pptx
Slide 1: Animated heat maps for vertical targets at all target locations. Each plot shows the hit canyon for release heights ranging from 1.5m to 2.7m in 0.1m increments.
Slide 2:
a) How the vertical target hit canyons change with target height for each distance (release height 1.5m)
Figure 1 -4.00 -2.00 0.00 2.00 4.00 6.00 8.00 10.00 12.00 14.00
5m 10m 15m 5m 10m 15m 5m 10m 15m
Cricket Softball Baseball
R e le ase A n gl e ( °) Distance (m) 1m 1.5m 2m -4.00 -2.00 0.00 2.00 4.00 6.00 8.00 10.00 12.00 14.00
5m 10m 15m
Figure 2 0.00 5.00 10.00 15.00 20.00 25.00 30.00 35.00 40.00
5m 10m 15m 5m 10m 15m 5m 10m 15m
Cricket Softball Baseball
R e le ase Sp e e d ( m /s) Distance (m) 1m 1.5m 2m 0.00 5.00 10.00 15.00 20.00 25.00 30.00 35.00 40.00
5m 10m 15m
Figure 3
1.60 1.70 1.80 1.90 2.00 2.10 2.20 2.30 2.40 2.50 2.60
5m 10m 15m 5m 10m 15m 5m 10m 15m
Cricket Softball Baseball
R
e
le
ase
H
e
ig
h
t
(m
)
Distance (m)
1m
1.5m
Appendix 1: Simulation Details
The projectile motion of a ball thrown at an angle (𝜃) with initial velocity (v0) is governed by
equations of motion with non-constant acceleration. The forces that act on the projectile are the force due to gravity acting vertically downwards on the ball, whilst both vertically and horizontally air resistance (drag) creates an additional force on the ball that acts in the opposite direction to its velocity. The model developed here does not include the effects of rotation of the ball, which can affect the projectile motion significantly (Cooke, 2001; Mehta & Pallis, 2001).
Equations 1 and 2 illustrate the application of Newton’s second law to the projectile in the horizontal and vertical axis respectively. Fx and Fy are the resultant forces acting on the ball in the
horizontal and vertical directions, Fdrag x and Fdrag y are the horizontal and vertical air resistance forces,
whilst mg represents the weight of the ball.
∑ 𝐹𝑥 = −𝐹𝑑𝑟𝑎𝑔 𝑥 Eq. 1
∑ 𝐹𝑦= −𝐹𝑑𝑟𝑎𝑔 𝑦− 𝑚𝑔 Eq. 2
At high velocities, the air resistance is proportional to the square of the velocity (v) as stated in Equation 3.
𝐹𝑑𝑟𝑎𝑔= 𝐷𝑣2 Eq. 3
where D is a constant dependent on the density of air 𝜌 (1.21Kgm3), cross sectional area of the ball, which is dependent on the radius of the ball r (0.033m) and the drag coefficient C (0.55 for a standard tennis ball; Chadwick & Haake, 2000) expressed in Equation 4.
𝐷 =𝜌𝐶𝜋𝑟2 2 Eq. 4
𝑣2 can be expressed as a function of the horizontal and vertical components as illustrated in
𝑣 = √𝑣𝑥2+ 𝑣𝑦2 Eq. 5
Given this relationship, we can write the components of the air resistance in the x and y
directions as expressed in Equations 6 and 7 respectively.
𝑓𝑥 = −𝐷𝑣𝑣𝑥 Eq. 6
𝑓𝑦 = −𝐷𝑣𝑣𝑦 Eq. 7
We can now rewrite Equations 1 and 2, as acceleration is the second differential of the displacement and velocity the differential of displacement. This gives us Equations 8 and 9, where m
is the mass of the tennis ball (0.057Kg) and g is the gravitational field strength (9.81ms-2).
𝑑2𝑥(𝑡)
𝑑𝑡2 = −
𝐷
𝑚𝑣
𝑑𝑥(𝑡)
𝑑𝑡 Eq. 8
𝑑2𝑦(𝑡)
𝑑𝑡2 = −
𝐷
𝑚𝑣
𝑑𝑦(𝑡)
𝑑𝑡 − 𝑔 Eq. 9
The projectile motion is therefore governed by two second-order, nonlinear, coupled differential equations that can be solved using numerical methods. Assuming a small enough fixed time interval ∆𝑡 (0.001 seconds) we can assume constant acceleration and apply linear equations of motion to obtain the velocities and hence the position of the projectile. Equations 10 and 11 illustrate the numeric calculation of the horizontal and vertical velocities where n represents the sample number.
𝑣𝑥 (𝑛 + 1) = 𝑣𝑥(𝑛) + 𝑎𝑥(𝑛)∆𝑡 Eq. 10
𝑣𝑦 (𝑛 + 1) = 𝑣𝑦(𝑛) + 𝑎𝑦(𝑛)∆𝑡 Eq. 11
Hence, the position of the ball can then be calculated using equations 12 and 13.
𝑥(𝑛 + 1) = 𝑥(𝑛) + 𝑣𝑥(𝑛)∆𝑡 + 𝑎𝑥(𝑛)∆𝑡2 Eq. 12