Methods in a
L-
Shrub Community
JACK LYON1
Wildlife Research Biologist, Forest Sewice, U.S.D.A.,
Intermountain Forest and Range Experiment Station, Ogden, Utah.
Highlight
Bitterbrush density in a known-parameter population was estimated using 19 different variations of quadrat and plotless sampling techniques. It was found that: (1) Many methods would not produce a correct answer with any size sample; (2) all methods required unreasonably large sam- ples to attain acceptable precision; and (3) several methods required more effort than counting all plants on 1 to 2 acres. It is suggested that visual estimation techniques or nonrandom sampling methods may provide a more realistic approach to the density sampling problem.
In ecological research, the basic objective of sam- pling is to obtain a descriptive estimate of some attribute of a plant population. This estimate should be a relatively accurate representation of the parameter and it should be sufficiently precise to allow detection of real differences among plant populations. From an ecological viewpoint, choice of the attribute is not particularly important as long as it is meaningful and can be adequately described. One of the most commonly sampled parameters is density-the number of individuals per unit area.
Although interpretation of density estimates usu- ally requires some additional information, such as average plant size, density has a number of obvious advantages when compared to other parameters that might be measured. It is easily understood, it is widely used, and measurements taken in a variety of different ways can be converted to a common base for comparison. Possibly because of these ad- vantages, many different methods by which density information can be obtained have been developed, and a considerable literature describing the mathe- matical characteristics and reliabilities of these methods is available. A particularly important de- velopment in recent years has been the evolution of a series of sampling methods based on plant-to-plant or point-to-plant distance measurements (Cottam and Curtis, 1956; Morisita, 1957; Catana, 1963).
One factor of significance, however, is that much of the literature describing density sampling is
l Headquartered at Forestry Sciences Laboratory, Missoula, Montana, which is maintained in cooperation with the University of Montana.
populations of dots or populations of mature trees in distributions assumed to be random. Nonran- dom distributions have been much less investigated even though there is considerable evidence that distributions other than random are very common in natural vegetation (Kershaw, 1963; Greig-Smith et al., 1963; Eberhardt, 1963; Laesale, 1965); and, more important, that distance measurements are biased in the degree that sampled populations are nonrandom (Morisita, 1957).
The problems involved in applying density-sam- pling techniques to shrub populations of unknown distribution have received even less study, and results reported in shrubs, forbs, and grasses have been inconsistent (Hutchings and Morris, 1959; Fracker and Brischle, 1944; Laycock, 1965; Dix, 1961).
The study on which this paper is based was ini- tiated as a means of comparing the accuracy and precision of several of the more common density sampling techniques on a shrub community with a known density parameter. In all, 19 variations of field technique or calculation method were tested. The results show that some methods will not pro- duce an accurate estimate with any size sample, that acceptable precision with many methods re- quires unreasonably large samples, and, most im- portant, that density may not be a particularly efficient parameter for describing shrub popula- tions.
Study Area and Methods
With the cooperation of Professor Melvin S. Morris of the School of Forestry and Conservation, University of Montana, a stand of bitterbrush (Purshia tridentata) about 3 mi northeast of Florence, Montana, was selected for study. The stand was picked because it is more or less undisturbed, is dominated by a single species of woody shrub, is confined to a uniform slope (10 to 15%) and aspect (west), and appears to be unaffected by obvious distribution patterns. Bitterbrush plants range in size from seedlings to overmature plants up to 7 ft in height. The only other woody species are a few rabbitbrush (Chrysothamnus nauseosus) and sage- brush (Artemisia tridentata) and a single ponderosa pine. Understory vegetation consists of Agropyron spicatum, Fes- tuca idahoensis, Poa secunda, Artemisia frigida. Balsamo- rhiza sagittata, Eriogonum spp., and Lupinus spp.
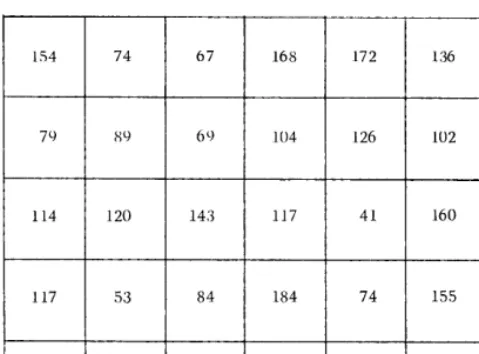
Within this stand we gridded an area 500 x 700 ft (8 acres) in IOO-ft squares. And, aided by the Range Manage- ment class from the University, we counted every bitterbrush plant over 6 inches in height. For the purposes of this count, stems rooted within 6 inches of each other were considered to represent a single plant. In all, 3,953 bitter- brush plants were recorded. The parameter value for the stand proved to be 49ZO/acre or one plant on each 88.5 ft2. Numbers of plants counted within each of the 100 x lOO-ft blocks are shown in Fig. 1.
FIG. 1. Numbers of bitterbrush plants in 100 X lOO-ft blocks on the S-acre study area.
Bitterbrush density distributions shown in Fig. 1 were tested for contagion with the corner-association analysis of Ghent and Grinstead (1965), and quadrat samples were examined with the index of dispersion proposed by Mori- sita (1959). These tests revealed significant contagion of plants within blocks and an overall random-to-regular dis- tribution of total plants in large blocks.
Nineteen variations in field technique or calculation method were tested. For each test, at least 49 random sam- ples were taken. In some cases, the test was repeated using additional samples at regularly spaced intervals. The meth- ods tested and the calculation variations may be classified as quadrat techniques and plotless techniques.
Quadrat Techniques
Of all sampling methods, those using quadrats are prob- ably the most often used and easiest to understand. Quad- rats can be any size or shape, but squares, circles, or rec- tangles are common, and a quadrat size which will contain an average of four individuals is often recommended (Curtis and McIntosh, 1950; Cottam and Curtis, 1956). In this study, only squares and rectangles were tested.
Squares.-Plants were counted in quadrats 2 x 2, 5 x 5, 10 x 10, and 20 x 20 ft at 50 randomly located sample points. An additional set of 49 regularly spaced 5 x 5 quad- rats was taken.
Rectangles.-Plants were counted in quadrats 1 x 4, 2% x 10, 5 x 20, and 10 x 40 ft at 49 randomly located sample points.
Variable rectangles.-Lengths of rectangular quadrats 6 ft wide and long enough to contain two plants were measured from 50 regularly spaced points. Additional measurements from 50 to 101 points were used to test quadrat lengths for one, two, three, four, and five plants.
Plotless Techniques
Since the publication of Cottam’s (1947) paper on the random pairs method, many techniques for determining density using either point-to-plant or plant-to-plant distance
measurements have been described. Cottam and Curtis (1956) concluded that the most efficient of these methods were those in which distances were measured to four plants around random points.
Unfortunately, the literature describing calculation meth- ods for plotless techniques is less than clear, with the result that essentially similar data are often treated several differ- ent ways-in some cases by the same author. From the various calculations described, however, six modifications of three field methods were defined for testing.
Quarter methods.-Distances were measured to the near- est individual in each quadrant around 60 randomly located points. Density estimates were calculated using two methods: 1. Point-centered quarter. Cottam and Curtis (1956) re- ported that the average of the four distances measured from a point is the square root of the mean area occupied by a single plant. The area estimate thus derived for each point is treated here as a single observation for calculating vari- ance.
2. Angle method. As described by Morisita (1957) this calculation method summarizes the areas of four adjacent quarter-circles with radii equal to the measured distances. In effect, the plot examined consists of four unequal pie- shaped pieces. The total area of this irregular figure is treated as a single observation.
Quarter-order methods.-Distances were measured to the third individual in each quadrant around 60 randomly located points. Density estimates were calculated two ways:
1. Angle-order. This is the same as the angle method except that the irregular figure at each point contains 12 individuals.
2. Morisita’s angle-order. By examining the recorded data as reciprocals of area for individual quadrants and for quadrants combined, Morisita (1957) obtains two alterna- tive density estimates which deviate from each other in the degree the population distribution is nonrandom. If the individual-quadrant estimate is greater than the combined- quadrant estimate, the former is accepted unchanged; if it is smaller, the two estimates are averaged. No formulation for calculating variance is presented in Morisita’s paper, and the variance of the angle-order calculations has been assumed in this paper.
Wandering quarter methods.-The wandering quarter described by Catana (1963) involves measuring plant-to- plant distances along a meandering transect determined by a constant compass bearing and a 90” angle of inclusion centered on successive plants. A total of 240 distances along 12 crisscrossing transects was measured. Two calculation methods were treated:
1. Catana’s wandering quarter. Catana orders all distance measurements in a frequency distribution and separates within-clump and between-clump distances at the three-mode limit. He then calculates density and size of clumps and between-clump densities, and recombines the information to obtain an overall density estimate. No calculation for den- sity variance is presented in Catana’s paper, and variance of the wandering angle calculation has been assumed.
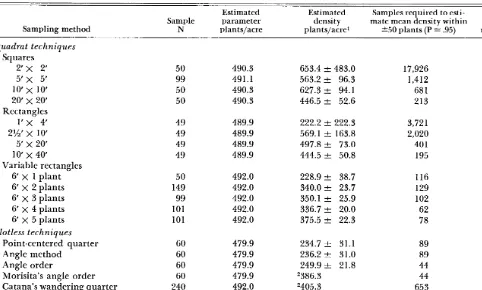
Table 1. Comparison of density sampling methods.
Estimated Sample parameter
Sampling method N plants/acre
Estimated density plants/acre1
Samples required to esti- Search mate mean density within acreage 30 plants (P = .95) required
Quadrat techniques Squares
2’ x 2’ 5’ x 5’ 10’ X 10’ 20’ x 20’ Rectangles
l’x 4’ 2%‘X 10’ 5’ X 20’ 10’ x 40’ Variable rectangles
6’ X 1 plant 6’ X 2 plants 6’ x 3 plants 6’ x 4 plants 6’ X 5 plants Plotless techniques
Point-centered quarter Angle method
Angle order
Morisita’s angle order Catana’s wandering quarter Wandering angle
50 99 50 50 49 49 49 49 50 149 99 101 101 60 60 60 60 240 240 490.3 491.1 490.3 490.3 489.9 489.9 489.9 489.9 492.0 492.0 492.0 492.0 492.0 479.9 479.9 479.9 479.9 492.0 492.0
653.4 k 483.0 563.2 + 96.3 627.3 + 94.1 446.5 + 52.6
222.2 + 222.3 569.1 + 163.8 497.8 & 73.0 444.5 + 50.8
228.9 + 38.7 340.0 k 23.7 350.1 + 25.9 336.7 + 20.0 375.5 & 22.3
234.7 2 31.1 236.2 + 31.0 249.9 + 21.8 2386.3 2405.3
452.6 & 42.1
17,926 1,412 681 213
3,72 1 2,020 401 195 116 129 102 62 78 89 89 44 44 653 653 1.65 .81 1.56 1.96 .34 1.16 .96 1.79 .51 .76 .87 .73 1.04 1.51 1.51 2.11 2.11 1.44 1.44
1Includes associated standard error.
2Since neither Morisita nor Catana provide methods for calculating variance, the standard errors of the angle order and wandering quarter have been assumed.
Evaluation Criteria
In evaluating the sampling methods which produced the 19 density estimates in Table 1, three interrelated criteria have been used.
Accuracy.-One desirable characteristic of any sampling method is that it produce correct answers. Most methods papers claim at least this much for the techniques they describe, and ecological papers usually imply reliability in the statistics presented. Accuracy, however, can only be judged in the presence of a statement describing the sam- pled parameter and the statistical precision of the set of observations.
It is clear from Fig. 1 that samples distributed randomly in this bitterbrush population could deviate substantially from the parameter and still be accurate for the particular parts of the population actually sampled. For example, the probability that a single observation would fall in a block with plant density 492.0 -I 100 plants/acre is 0.25, and the probability that a single observation would fall in a block deviant by more than 300 plants/acre is greater than 0.10.
Estimated densities and standard errors for all sample groups were calculated, and where no statistical differences (P L .Ol) between random and regular spacing could be detected, the data were combined. Resulting single esti- mates of plant density are means of samples with associated standard errors based on sample sizes ranging from N = 49 to N = 240.
Precision.-Possibly the most desirable characteristic of any sampling method is that it produce similar statistics in repeated samples. A corollary to repeatability is that the standard error range around sample means not be so great as to prevent detection of real differences between means. Precision and accuracy are not equivalent, however; a pre- cise estimate may still be inaccurate.
The basic expression of precision is standard error. How- ever, in this study, sample standard errors were not derived from equal sample groups and are not directly comparable. Therefore, precision, in Table 1, is expressed as the esti- mated number of samples required to obtain repeated sam- ple means within 50 plants/acre (P r .95) of a common mean. Fifty plants is approximately 10% of the parameter mean, but accuracy within 10% is not necessarily implied in this calculation.
Efficiency.-From a practical standpoint, accuracy and pre- cision do not sufficiently justify a sampling technique that requires unreasonable investment of time or effort. Com- parative efficiency in Table 1 is expressed as the total acre- age which must be searched to obtain a density estimate within +50 plants/acre (P r .95).
Evaluation and Discussion
most of the currently popular techniques for sam- pling plant density are less than satisfactory and that estimations of density may not be particularly helpful in describing shrub populations.
Only the squares, rectangles, and the wandering quarter methods produced density sample means which could be considered acceptably accurate- that is, within two standard errors of the parameter value. Cottam et al. (1953) found that quadrats averaging less than four individuals take a Pois- son distribution, and Ghent (1963) reported that “
. . . estimates of density . . . become progressively lower as quadrat size increases.” Both characteris- tics are apparent in these quadrat data, but neither is considered serious enough to invalidate density means based on adequately large samples.
Unfortunately, the sample sizes required for ade- quate density estimates do seem to approach the prohibitive level. The largest quadrats tested re- quire search of nearly 2 acres, and even the smaller, more efficient quadrats require from 400 to several thousand observations covering nearly an acre.
Variations on the wandering quarter method, while also acceptably accurate, require search of
1.44 acres and over 600 samples. For most ecological work, this is certainly a prohibitive requirement.
Precision was better for some sampling methods than others, but only 6 of the 19 tested methods require fewer than 100 observations and several techniques require over 1,000. High variance seems to be an inevitable problem with density samples. Cottam et al. (1953) remarked on the characteristic extreme variability of density samples, and where standard error statistics are available for natural populations of trees (Cottam and Curtis, 1956; Catana, 1963) they are comparable to the estimates for bitterbrush presented here. In general, it ap- pears that the standard deviation of any density sample will be nearly as large as the mean.
In this study, sampling methods based on dis- tance measurements from random points appeared to be slightly more precise than plant-to-plant or area methods. However, some investigators (Mori- sita, 1957; Hutchings and Morris, 1959) have re- ported that it is not possible to obtain reliable estimates of density directly from distance measure- ments in a nonrandom population. In aggregated populations, the nonlinear relationship between distances and areas is expected to produce under- estimates, and, predictably, the sample means for distance methods in this study averaged 33y0 low. It should be noted also, that the two methods in which a correction for nonrandom distribution is calculated were only slightly more accurate, and still produced 18 and 20% underestimates.
Finally, the numbers of samples required and the acreages to be searched suggest that even if the accuracy and precision of the tested sampling meth- ods had been acceptable, none of these techniques could be considered useful for field ecology. Ac- cording to Table 1, the most efficient methods tested require over 100 replications and search of at least 0.5 acre to produce data so badly biased that no legitimate comparison would be possible. All other techniques require even greater effort. If the logistics of locating random points are also consid- ered, at least half of these density sampling methods would require more field time than a straightfor- ward count of the total population on 8 acres.
Conclusions
This study was initiated with the intention of comparing several density-sampling methods in ap- plication on a shrub population with a known parameter. In view of the results obtained, it seems possible that something more basic than a test of sampling techniques is involved. The tested meth- ods proved to be so consistently poor as to suggest that no technique of density sampling is particu- larly desirable. Without exception, the samples required to attain an acceptable degree of precision are unreasonably large. More than that, large sam- ples did not necessarily guarantee accuracy because some sampling techniques simply will not produce a correct answer with any size sample.
There is, of course, the possibility that the shrub community selected for study is somehow atypical. If so, it is not as atypical as the illustrated versions of dot populations on which some of these sampling methods have been successfully tested (Cottam et al., 1957; Morisita, 1959). Moreover, the variance estimates calculated are in the same general range as variance estimates for densities of forest commu- nities described by several investigators. And, fi- nally, this bitterbrush stand is a natural community of a type often sampled in ecological investigations. Atypical or not, it is the kind of sampling problem encountered.2
Another possibility is that the precision limits used in this evaluation are unrealistically high. Consider, however, the results when a sample mean within 100 plants (P = .95) is accepted. Using
5 x 5 quadrats, 353 samples are needed and 20 acre must be searched. The wandering angle requires
164 distance measurements and search of .36 acre. These requirements are not completely unreason- able, but they are somewhat larger than the sam- ples reported in many ecological studies. Precision in the range +25%, however, may be below the minimum acceptable level for ecological work. It can be shown, for example, that in comparing two populations with a 2 : 1 density ratio using samples taken at 25Cr, precision, at least 1 in 13 “t” tests will fail to detect any difference at all.
In summary, then, the most reliable density meth- ods tested require a virtually prohibitive sample to attain barely acceptable precision for a statistical test which may fail to detect density differences that are probably obvious on visual inspection.
Obviously, no scientist is going to give up study- ing vegetation because this paper suggests that den- sity data may not be reliable. On the other hand, we cannot just ignore the sampling problem, and I would like to suggest some possible avenues of investigation that have been somewhat neglected in the literature.
Estimation methods, except for weight estimates in range analyses, have been more or less ignored in ecological work because estimation requires a subjective judgment that may vary among observers and from day to day. Seemingly, such judgments lack the rigid precision of counts or measured dis- tances. In actual practice, however, counted or measured samples small enough to be logistically reasonable may produce estimates with precision no better than %25%. At this not very rigid level, it appears that categorical visual estimates or rank- ing might be just as reliable as more objective sam- ples. When the corollary information needed to interpret the density term is also considered, a visual estimate technique based on “biomass” or “space occupied” seems relatively realistic.
A second avenue of investigation has been indi- rectly suggested by the work of Morisita (1957) and Catana (1963). Since strictly random sampling involves large variances, we require a method by which stratification can be used to reduce variation. Ideally, the sampling technique itself would deter- mine the stratification and yield information about the distribution of plants as well as an accurate estimate of density. Presumably, distance methods could supply this information if properly designed.
For want of a better suggestion, it is proposed that sample points should be related to each other by regular spacing or by plant-to-plant distances.
LITERATURE CITED
CATANA, ANTHONY J. 1963. The wandering quarter method of estimating population density. Ecology 44:349-360. COTTAM, G. 1947. A point method for making rapid sur-
veys of woodlands. Bull. Ecol. Sot. Amer. 28:60. COTTAM, G., AND J. T. CURTIS. 1956. The use of distance
measures in phytosociological sampling. Ecology 37:451- 460.
COTTAM, G., J. T. CURTIS, AND ANTHONY J. CATANA, JR. 1957. Some sampling characteristics of a series of aggre- gated populations. Ecology 38:610-621.
COTTAM, G., J. T. CURTIS, AND B. WILDE HALE. 1953. Some sampling characteristics of a population of ran- domly dispersed individuals. Ecology 34: 741-757. CURTIS, J. T., AND R. P. MCINTOSH. 1950. The interrela-
tions of certain analytic and synthetic phytosociological characters. Ecology 31:434-455.
DIX, R. L. 1961. An application of the point-centered quarter method to the sampling of grassland vegetation. J. Range Manage. 14:63-69.
EBERHARDT, L. L. 1963. Problems in ecological sampling. Northwest Sci. 37: 144-154.
FRACKER, S. B., AND H. A. BRISCHLE. 1944. Measuring the local distribution of Ribes. Ecology 25:283-303.
GHENT, A. W. 1963. Studies of regeneration in forest stands devastated by the spruce budworm. III. Problems of sampling precision and seedling distribution. Forest Sci. 9:295-310.
GHENT, A. W., AND B. GRINSTEAD. 1965. A new method of assessing contagion, applied to a distribution of redear sunfish. Amer. Fish. Sot. Trans. 94:135-142.
GREIG-SMITH, P., P. K. KERSHAW, AND D. J. ANDERSON. 1963. The analysis of pattern in vegetation: a comment on a paper by D. W. Goodall. J. Ecol. 51:223-229.
HUTCHINGS, SELAR S., AND MEREDITH J. MORRIS. 1959. Use of distance measurements for determining plant density in semidesert vegetation. Ninth Int. Bot. Congr. Proc., ~01s. II, IIA.
KERSHAW, KENNETH A. 1963. Pattern in vegetation and its causality. Ecology 44:377-388.
LAESALE, ALBERT M. 1965. Spacing and competition in natural stands of sand pine. Ecology 46:65-72.
LAYCOCK, WILLIAM A. 1965. Adaptation of distance mea- surements for range sampling. J. Range Manage. 18:205- 211.
MORISITA, MASAAKI. 1959. Measuring of the dispersion of individuals and analysis of the distributional patterns. Member Fat. Sci., Kyushu Univ., Series E (Biology) Z(4): 215-235.
MORISITA, MASAAKI. 1957. A new method for the estima- tion of density by the spacing method applicable to non- randomly distributed populations. Phys. and Ecol. 7: