Feature Selection Technique Applied with Many
Data Mining Based Model
Pratibha Soni#1, Prabhakar Sharma*2 #
M Tech(CSE),Raipur Institute of Technology,Raipur Chhattisgarh,INDIA
*
Asst Professor(CSE), Raipur Institute of Technology,Raipur Chhattisgarh, INDIA
Abstract— There is wide use of internet for data exchange and increasing rapidly in almost all the domains including online transaction and data communication, Also due to these attacks are increasing rapidly. Also security of information in victim computer is an important need, which requires a security wall for identification and prevention of attacks in form of intrusion detection system (IDS). Basically Intrusion detection system (IDS) is a classifier that can classify the network data as normal or attack.
In this research work feature selection technique applied with three classification techniques C5.0, QUEST and ANN to develop the IDS model in five different partition with continuously reducing features. To develop the model KDD99dataset used as benchmark data. Performance of the classification model is measured in terms of accuracy. C5.0 based model with minimum 37 number of feature is producing best accuracy of 99.95%.
Keywords— Feature selection, decision tree, partition size
I. INTRODUCTION
Now days, computer attacks are unglamorous. By connecting our organization’s computers or local network to the Internet, the risk of having someone break in would be increased, installation of malicious programs and tools would be most likely occurred, and possibly the systems would be used to attack other machines on the Internet by remotely controlling them. In order to combat this growing trend of computer attacks and respond to this increasing threat, both academic and industry groups have been developing systems to monitor networks and systems and raise alerts of suspicious activities. These systems are called Intrusion Detection Systems (IDS).
V. Nikulin (2006) have proposed a model using Threshold based clustering, k-nearest neighbor(KNN) to produced effectiveness result.[1]
E. Hernandez-Pereiran et al. (2009) used one layer feed-forward neural network, SVM and multilayer feed-feed-forward neural network to improve the prediction ability of the classifier.[2]
Ming-Yang Su (2011) use KNN to develop a model that gives high accuracy rate as 97.42% for known attacks and accuracy rate of 78% for unknown attacks.associated with IDS on manets and are capable of producing high performing programs.[3]
Yinhui Li et al., (2012) proposed a model that achieves 98.624% accuracy. This model consists of SVM gradually
removal method, Ant colony algorithm, clustering method.[4]
Gisung Kim et al., (2014) suggest hybrid intrusion detection method that improve the IDS in terms of detection, performance for unknown attacks and detection speed. [5]
II. MATERIAL AND METHODS
A. Material
In order to develop IDS a benchmark data is required. Many benchmark data related to intrusion are available in the repository site. One of the largest data set publicly available for the evaluation of intrusion detection system is KDD 99 data set which is prepared by Lincoln Laboratory at MIT. The data set has about 5 million records as TCP/IP connection with 41 features, some of which are qualitative while others are continuous, and are categorized into two broader categories normal and attack. There are 22 types of attack in all which falls one of the 4 sub categories of attack.[6]
B. Method used
1) C5.0: C5.0 is a decision tree based classifier developed by Ross Quinlan[7] and is an extension of C4.5 .It automatically extracts classification rules in the form of decision tree from given training data .C5.0 has many benefits over C4.5 in terms of time and memory space required, the tree generated by C5.0 is also very small as compared to C4.5 algorithm which ultimately improves the classification accuracy.
2) QUEST: Quick, Unbiased, Efficient Statistical Tree is a binary classification method for building decision trees. A major motivation in its development was to reduce the processing time required for large C&R Tree analyses with either many variables or many cases. A second goal of QUEST was to reduce the tendency found in classification tree methods to favour predictors that allow more splits, that is, continuous predictor variables or those with many categories.
all splits are not examined, and unlike C&R Tree and CHAID, category combinations are not tested when evaluating a predictor for selection. This speeds the analysis. [8]
3) ANN: Neural networks [9] can be used for
descriptive and predictive data mining. ANN is known as best classifier and is able to mine huge amount of data for classification. They were originally developed in the field of machine learning to try to imitate the neurophysiology of the human brain through the combination of simple computational elements (neurons) in a highly interconnected system. A neural network is composed of a set of elementary computational units, called neurons, connected together through weighted connections. These units are organized in layers so that every neuron in a layer is exclusively connected to the neurons of the preceding layer and the subsequent layer. Every neuron, also called a node, represents an autonomous computational unit and receives inputs as a series of signals that dictate its activation. Following activation, every neuron produces an output signal. All the input signals reach the neuron simultaneously, so the neuron receives more than one input signal, but it produces only one output signal. Every input signal is associated with a connection weight. The weight determines the relative importance the input signal can have in producing the final impulse transmitted by the neuron. The connections can be exciting, inhibiting or null according to whether the corresponding weights are respectively positive, negative or null. The weights are adaptive coefficients that, by analogy with the biological model, are modified in response to the various signals that travel on the network according to a suitable learning algorithm. A simple architecture of ANN is shown in Fig 1.
Fig. 1 A simple architecture of ANN
4) Feature Selection:
Feature subset selection [10] is an important problem in knowledge discovery, not only for the insight gained from determining relevant modelling variables, but also for the improved understandability, scalability, and, possibly, accuracy of the resulting models. In the Feature selection the main goal is to find a feature subset that produces higher classification accuracy.
Feature selection [11] is an optimization process in which one tries to find the best feature subset, from the fixed set of the original features, according to a given processing goal and feature selection criteria, without feature
transformation or construction. The existing feature selection methods depending on feature selection criterion used two main streams: first are open-loop methods and second are closed-loop methods.
The open-loop methods, also called the filter, present bias, or the front end methods, are performance bias, or classifier feedback methods, are based on the feature selection using a classifier performance as criterion of feature subset selection. The closed-loop methods will generally provide a better selection of subset, since they based on the unlimited goal of optimal feature selection, which is providing the best classification.
Feature selection technique with feature raking is applied to select best feature subset. The simple feature selection procedure is based on evaluate of classification power of individual features, then ranking such evaluated features, and eventually selecting the first best m features. A criteria applied to an individual feature could be of either of the open-loop or closed-loop type. This is also relies on an assumption that the final selection criterion can be expressed as a sum or product of the criteria evaluated for each feature independently. We can expect that a single feature alone have a low classification power. However, this feature when put together with others may exhibit substantial classification power.
III.RESULT AND DISCUSSION
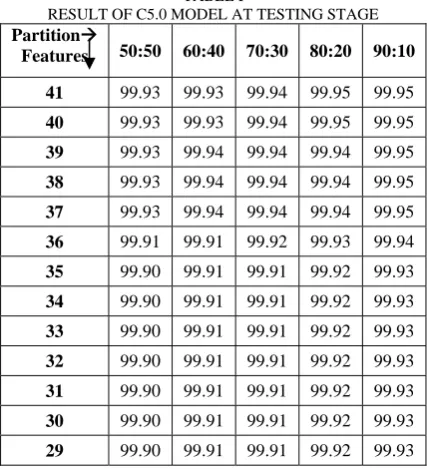
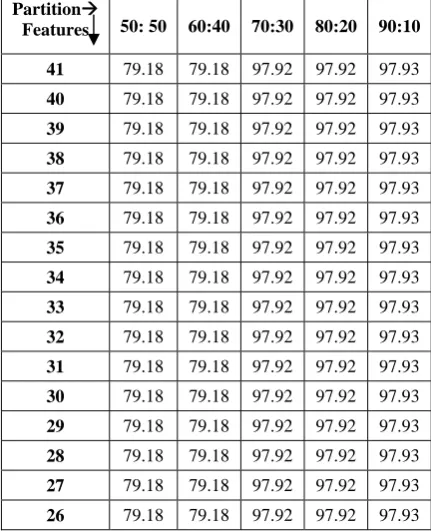
Experimental work is carried out using Clementine data mining tool under windows environment for five different partitions. In this experiment three data mining techniques QUEST, C5.0 and ANN are applied with continuously reduction of features. The result of experimental work of C5.0 method is shown in table1, this table shows the testing accuracy at five different partition size with reduced feature set.Table2 and Table3 shows the result of testing accuracy of QUEST model and ANN model at different partition size with continuously reduced features
.
TABLE I
RESULT OF C5.0 MODEL AT TESTING STAGE
Partition
Features 50:50 60:40 70:30 80:20 90:10
41 99.93 99.93 99.94 99.95 99.95
40 99.93 99.93 99.94 99.95 99.95
39 99.93 99.94 99.94 99.94 99.95
38 99.93 99.94 99.94 99.94 99.95
37 99.93 99.94 99.94 99.94 99.95
36 99.91 99.91 99.92 99.93 99.94
35 99.90 99.91 99.91 99.92 99.93
34 99.90 99.91 99.91 99.92 99.93
33 99.90 99.91 99.91 99.92 99.93
32 99.90 99.91 99.91 99.92 99.93
31 99.90 99.91 99.91 99.92 99.93
30 99.90 99.91 99.91 99.92 99.93
28 99.93 99.93 99.93 99.93 99.94
27 99.93 99.93 99.93 99.93 99.94
26 99.92 99.93 99.93 99.93 99.92
25 99.91 99.90 99.91 99.92 99.91
24 99.90 99.90 99.92 99.92 99.91
23 99.90 99.90 99.90 99.92 99.91
22 99.90 99.91 99.90 99.92 99.91
21 99.91 99.90 99.91 99.92 99.91
20 99.91 99.91 99.91 99.92 99.91
19 99.91 99.91 99.91 99.92 99.92
18 99.91 99.91 99.92 99.92 99.92
17 99.91 99.91 99.91 99.92 99.93
16 99.91 99.91 99.91 99.92 99.93
15 99.91 99.90 99.91 99.91 99.94
14 99.50 99.52 99.53 99.53 99.51
13 99.46 99.46 99.47 99.47 99.47
12 99.43 99.44 99.45 99.45 99.42
11 99.43 99.44 99.45 99.45 99.42
10 99.41 99.44 99.44 99.44 99.43
09 99.39 99.40 99.41 99.41 99.40
08 99.16 99.16 99.16 99.18 99.17
07 99.15 99.15 99.16 99.17 99.16
06 99.08 99.07 99.06 99.08 99.07
05 98.53 98.51 98.50 98.49 98.49
04 96.96 96.89 96.87 96.91 99.89
03 96.79 96.78 96.77 96.81 96.79
TABLE II
RESULT OF QUEST MODEL AT TESTING STAGE
Partition
Features 50: 50 60:40 70:30 80:20 90:10
41 79.18 79.18 97.92 97.92 97.93
40 79.18 79.18 97.92 97.92 97.93
39 79.18 79.18 97.92 97.92 97.93
38 79.18 79.18 97.92 97.92 97.93
37 79.18 79.18 97.92 97.92 97.93
36 79.18 79.18 97.92 97.92 97.93
35 79.18 79.18 97.92 97.92 97.93
34 79.18 79.18 97.92 97.92 97.93
33 79.18 79.18 97.92 97.92 97.93
32 79.18 79.18 97.92 97.92 97.93
31 79.18 79.18 97.92 97.92 97.93
30 79.18 79.18 97.92 97.92 97.93
29 79.18 79.18 97.92 97.92 97.93
28 79.18 79.18 97.92 97.92 97.93
27 79.18 79.18 97.92 97.92 97.93
26 79.18 79.18 97.92 97.92 97.93
25 79.18 79.18 97.92 97.92 97.93
24 79.18 79.18 97.92 97.92 97.93
23 79.18 79.18 97.92 97.92 97.93
22 79.18 79.18 97.92 97.92 97.93
21 79.18 79.18 97.92 97.92 97.93
20 79.18 79.18 97.92 97.92 97.93
19 79.18 79.18 97.92 97.92 97.93
18 79.18 79.18 97.92 97.92 97.93
17 79.18 79.18 97.92 97.92 97.93
16 79.18 79.18 97.92 97.92 97.93
15 79.18 79.18 97.92 97.92 97.93
14 79.18 79.18 97.92 97.92 97.93
13 79.18 79.18 97.92 97.92 97.93
12 79.18 79.18 97.92 97.92 97.93
11 79.18 79.18 97.92 97.92 97.93
10 79.18 79.18 97.92 97.92 97.93
09 79.18 79.18 97.92 97.92 97.93
08 79.18 79.18 97.92 97.92 97.93
07 79.18 79.18 97.92 97.92 97.93
06 79.18 79.18 97.92 97.92 97.93
05 95.72 95.70 97.92 97.92 97.93
04 93.11 93.11 96.59 96.62 96.62
03 93.13 93.11 96.59 96.62 96.62
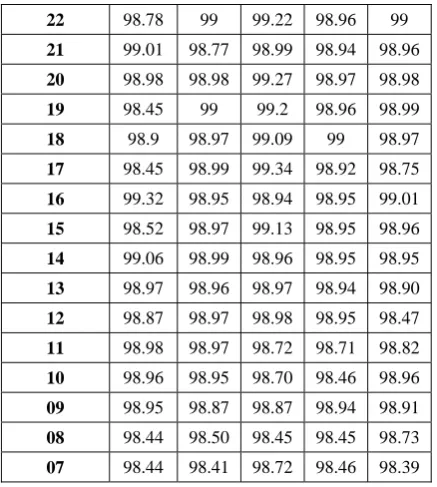
TABLE III
RESULT OF ANN MODEL AT TESTING STAGE
Partition
Features 50: 50 60:40 70:30 80:20 90:10
41 99 99.06 99.64 99.13 99.61
40 99.71 99 98.99 99.17 98.93
39 98.73 99.63 99.26 98.90 99.03
38 99.25 99.06 99.02 99.22 99.17
37 99.63 99.25 99.37 99.25 99.72
36 99.33 99.35 99.24 99.63 99.25
35 99.04 99 99 99.09 98.96
34 98.76 99.01 99 98.76 98.94
33 99.43 99.02 99 99.01 98.85
32 99.02 99.01 99 98.76 98.94
31 99.01 99.05 99.12 99.0 98.96
30 99 99 98.78 99.01 98.96
29 99.05 99.03 99 98.99 98.55
28 98.81 99.01 99.04 99.01 99.07
27 98.78 99.10 98.77 99.01 98.98
26 98.48 98.88 98.96 98.95 98.74
25 99.02 98.99 98.02 98.96 98.96
24 98.78 98.97 98.98 99.02 98.98
22 98.78 99 99.22 98.96 99
21 99.01 98.77 98.99 98.94 98.96
20 98.98 98.98 99.27 98.97 98.98
19 98.45 99 99.2 98.96 98.99
18 98.9 98.97 99.09 99 98.97
17 98.45 98.99 99.34 98.92 98.75
16 99.32 98.95 98.94 98.95 99.01
15 98.52 98.97 99.13 98.95 98.96
14 99.06 98.99 98.96 98.95 98.95
13 98.97 98.96 98.97 98.94 98.90
12 98.87 98.97 98.98 98.95 98.47
11 98.98 98.97 98.72 98.71 98.82
10 98.96 98.95 98.70 98.46 98.96
09 98.95 98.87 98.87 98.94 98.91
08 98.44 98.50 98.45 98.45 98.73
07 98.44 98.41 98.72 98.46 98.39
06 98.09 98.18 98.18 98.20 98.22
05 98.09 98.50 98.18 98.06 98.09
04 98.88 97.89 97.87 97.89 97.90
03 97.68 97.68 97.66 97.66 97.72
These three tables show the result of classification model in terms of testing accuracy. According to these result the chart have been prepared. Fig 2 shows the C5.0 model accuracy with five different partition size with reducing features. Fig 3 shows the QUEST model accuracy with five different partition size with reducing features. Fig 4 shows the ANN model accuracy with five different partition sizes with reducing features.
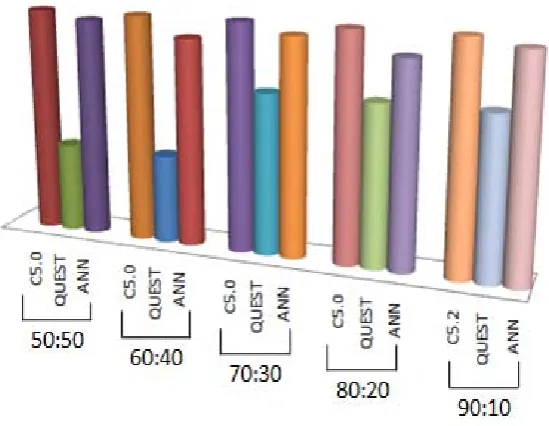
In this research work three classification algorithms are used to train and test the model. Table4 shows the maximum testing accuracy of three different classification algorithms. By observing this table it is found that C5.0 algorithm gives higher accuracy than others. Fig 5 shows the maximum testing accuracy of ofc5.0, QUEST and ANN model at five partition sizes at Testing stage.
Fig 2 C5.0 model accuracy at different partition size with different feature
Fig 4 ANN model accuracy at different partition size with different features
TABLE IV
THE BEST ACCURACY OF THREE MODELS ON FIVE DIFFERENT PARTITION SIZE AT TESTING STAGE
Method Partition
size
C 5.0 QUEST ANN
50:50 99.93 95.72 99.71
60:50 99.94 95.70 99.35
70:30 99.95 97.92 99.64
80:20 99.95 97.92 99.25
90:10 99.95 97.93 99.72
IV.CONCLUSION AND FUTURE WORK
Intrusion detection system is basically software used to detect attack in either network computer or in host computer .This IDS must be developed using many efficient techniques, Data mining is a technique which extract meaningful information from huge data. In this paper we have applied many data mining techniques to design a framework for IDS in special reference to feature selection. KDD data is portioned and presented to data mining based techniques and features are reduced gradually. C5.0 model is producing better accuracy then others ,the accuracy of model is either increasing or remains same while reducing features from feature space. In future a novel feature selection technique can be developed and can be applied in some different hybrid models.
REFERENCES
[1] V.Nikulin , “Threshold-based clustering with merging And regularization in application to network intrusion detection”,
Computational Statistics & Data Analysis,51, 1184-1196. [2] E.H.Pereira, J.A .Suarez-Romero, O .Fontema-Romero,and
A.A. Bentanzos (2009), “Conversion methods for symbolic features: A comparison applied to an intrusion detection problem”, Expert Systems with Applications, 36,10612-10617. [3] M.Y. Su (2011). “Real –time anomaly detection systems for
Denail-of-service attacks by weighted. K-nearest-neighbor classifier”. Expert Systems with Applications, 38, 3492-3498. [4] Y.Li, J.Xia, S.Zhang , J .Yan, X .Ai, and K. Dai (2012),“An
efficient intrusion detection system based on support vector machines and gradually feature removal method”, Expert Systems with Applications, 39, 424-430.
[5] G.Kim ,S.Lee , and S. Kim, (2014), “A Novel hybrid intrusion detection method integrating anomaly detection with misuse detection”,Expert System withApplicaton, 41,1690-1700. [6] UCI Machine Learning Repository of machine Learning
databases (2010). University of California, school of Information and Computer Science, Irvine. C.A. http://www.ics.uci.edu/~mlram,?ML.Repositary.html
[7] rulequest.com/see5-info.html, 2010 [8] Clamentine help file
[9] P. Giudici, and S. Figini, Applied Data Minin for Business and Industry (2nd Ed) (John Wiley Sons, April 2009).
[10] Shetty Monali, N.M.Shekokar,” Data Mining Techniques for Real Time Intrusion Detection Systems”Journal of Scientific & EngineerinResearch,(2012),3(4), 2229 5518.