Electromechanical properties of PVDF-based
1
polymers reinforced with nanocarbonaceous fillers
2
for pressure sensing applications
3
Javier Vicente1, P. Costa2,3, S. Lanceros-Mendez4,5, Jose Manuel Abete6 and Aitzol Iturrospe1
4
5
Affiliations
6
1. Electronics and Computing Department, Mondragon Unibertsitatea, 20500, Mondragon, Spain
7
2. Center of Physics, University of Minho, 4710 - 057 Braga, Portugal
8
3. Institute for Polymers and Composites (IPC), University of Minho, 4800-058 Guimarães, Portugal
9
4. BCMaterials, Basque Center for Materials, Applications and Nanostructures, UPV/EHU Science Park,
10
48940 Leioa, Spain
11
5. IKERBASQUE, Basque Foundation for Science, 48013 Bilbao, Spain
12
6. Applied Mechanics Department, Mondragon Unibertsitatea, 20500, Mondragon, Spain
13
14
Abstract:Polymer-basedcomposites reinforced with nanocarbonaceous materials can be tailored
15
for functional applications. Poly(vinylidene fluoride) (PVDF) reinforced with carbon nanotubes
16
(CNT) or graphene with different filler contents have been developed as potential piezoresistive
17
materials.
18
The mechanical properties of the nanocomposites depend of the PVDF matrix, filler type and
19
filler content. PVDF 6010 is a relatively more ductile material, whereas PVDF-HFP shows larger
20
maximum strain near 300% strain for composites with CNT, 10 times higher than the pristine polymer.
21
This behaviour is similar for all composites reinforced with CNT. On the other hand, rGO/PVDF
22
composites decrease the maximum strain compared to neat PVDF.
23
It is shown that the use of different PVDF copolymers does not influence the electrical properties
24
of the composites. On the other hand, CNT as filler leads to composites with percolation threshold
25
around 0.5 wt.%, whereas reduced graphene oxide (rGO) nanocomposites shows percolation
26
threshold at ≈2 wt.%. Both nanocomposites present excellent linearity between applied pressure and
27
resistance variation, with pressure sensibility (PS) decreasing with applied pressure, from PS≈ 1.1 to
28
0.2 MPa-1. A proof of concept demonstration is presented, showing the suitability of the materials for
29
industrial pressure sensing applications.
30
Keywords: Piezoresistivity; PVDF; nanocarbonaceous; electromechanical; pressure sensibility
31
32
2
1. Introduction33
Polymer based nanocomposites are attracting large attention in the recent years both in the
34
scientific and industrial areas. Through the inclusion of fillers, a wide range of polymer properties
35
can be enhanced, such as mechanical [1], electrical [2] and thermal properties [3], among others. Thus,
36
polymer composites can be tailored for specific applications. Moreover, it is possible to add new
37
features to the polymers through the inclusion of nanoparticles, functionalizing them and enabling
38
sensing of different parameters such as mechanical [4], temperature or humidity [5], among others
39
physical properties.
40
Hence, their application as sensors materials is being widely studied due to their simple
41
manufacturing and integration into devices [6, 7]. Some of the most used fillers for strain sensing
42
functionalization of polymers are carbon nanoallotropes, such as carbon black (CB) [8], graphene (G)
43
and its oxidized forms (graphene oxide (GO) and reduced GO (rGO) [8, 9] and carbon nanotubes
44
(CNT) [7, 10]. With the inclusion of conductive nanoparticles, polymer nanocomposites increase their
45
piezoresistive response, i.e. under a mechanical solicitation their resistance changes linearly with
46
applied strength [11]. Different fillers influence the electrical and functional properties, but also the
47
mechanical properties of the composite [11, 12]. The percolation threshold of the polymer composites
48
depend on the filler, matrix and processing method, among other parameters [13]. Lower percolation
49
thresholds around 0.1 to 0.4 vol% can be found in polymer composites with graphene or carbon
50
nanotubes as filler [13]. The aspect ratio of the nanofillers as well as their intrinsic properties strongly
51
influence the electrical and mechanical properties of the composite and, therefore, its functional
52
response [12]. In this way, graphene and CNT are compared as reinforcement fillers due to their
53
different intrinsic properties in order to find the suitable nanofiller for specific functional devices.
54
These materials are typically tailored to optimize their mechanical properties and piezoresistive
55
sensibility, achieving gauge factor values up to 175 [14], two orders of magnitude higher than
56
traditional strain gauges, and strains larger than 50% [15]. The percentage of fillers used for
57
optimizing functional response also vary widely [16], depending on the matrix, filler, processing
58
method or even application. However, the larger piezoresistive sensibility in polymer composites is
59
observed near the percolation threshold [17].
60
The percolation threshold is the range in which the materials undergo a transition from nearly
61
insulating to conductive, changing several orders of magnitude their electrical conductivity for small
62
filler content variations [16]. The percentage at which this phenomenon occurs vary widely
63
depending on fillers, matrix and processing method [18, 19]. The percolation threshold is reported to
64
occur when the first conductive paths spanning all the nanocomposite are formed due to the
3
proximity of the conductive fillers embedded in the isolating matrix. This phenomenon has been
66
explained by different theoretical models [19-21].
67
The selection of the polymer matrix used for the development of a functional sensor depends on
68
the stimulus needed for sensor response. Flexibility or stretchability, force and environmental
69
conditions influences the host polymer to use in view the overall properties to select.
70
Soft polymer matrices such as natural rubbers or thermoplastic elastomers are reported to
71
provide the nanocomposite high strain capability from low to large strains [15], and wide range of
72
sensitivity in functional response [22]. For applications in which mechanical solicitations can
73
compromise the structural integrity of the material or for large force applications, stiffer matrices are
74
employed. Among the most used thermoplastic polymers for force and deformation sensor
75
development, literature reports on polypropylene (PP) [23], poly(vinylidene fluorine) (PVDF) [23, 24]
76
and poly-eter-eter-ketone (PEEK) [25], among others [25, 26], though thermosetting such as
77
polyepoxides [27] and elastomers such as thermoplastic polyurethane (TPU) [8, 9], triblock
styrene-78
butadiene-styrene (SBS) [15] or styrene-ethylene/butylene-styrene (SEBS) [23] have been also used.
79
PVDF and its copolymers are excellent materials for functional applications, such as sensors,
80
actuators, energy harvesting and as biomaterials in the biomedical field [28]. PVDF shows excellent
81
electroactive properties, being used as host polymer for large number of applications [28]. PVDF is
82
semi-crystalline material with five distinct crystalline phases, the most investigated and used for
83
applications being the non-polar α-phase and the polar β-phase [11, 27].
84
Furthermore, PVDF presents excellent mechanical and chemical properties, weather resistance,
85
and outstanding properties associated to their polar crystalline forms [29]. In this way, for functional
86
composite applications is an interesting material with large potential for force sensor, due to its
87
mechanical and chemical resistance properties [12, 27].
88
Polymer nanocomposites can be manufactured using laboratory and industrial techniques. At
89
laboratory level, they can be processed by solvent casting [30], for example, whereas at industrial
90
level typical processing methods include hot pressing [31], extrusion [32] or injection [33]. Through
91
the different fabrication processes, the overall properties of the PVDF composites can be tuned,
92
including mechanical and electrical properties, with large influences on the functional performance
93
of the composite. In particular, thin film materials attract increasing attention based on their simple
94
integration in to devices [33-36]. Hence, the integration of these films in components or processes
95
enables an inexpensive sensor conformation.
96
In this work, a comprehensive study of PVDF-based materials for force compression sensing is
97
presented with excellent performance and linearity [37, 38]. Different PVDF based polymers
(PVDF-98
HFP, PVDF 6010 and PVDF 5130) and nanocarbonaceous fillers (carbon nanotubes and reduced
99
graphene oxide) were used to tailor composites in view their mechanical, electrical and
4
electromechanical properties. Further, a proof of concept application is presented, submitting the
101
sensor to different pressures. In order to develop a functional material with specific response for
102
applications, the focus on the different properties of the polymer matrix and filler (type and content)
103
will be evaluated to tailor the overall properties of the composite to work as piezoresistive sensible
104
material under mechanical compression. Host matrices were selected from 400 MPa to 2.5 GPa of
105
tensile modulus, as detailed in experimental part and CNT and rGO has been selected as functional
106
fillers based on their different dimensions and intrinsic properties.
107
108
2. Experimental
109
2.1. Materials
110
The selected polymers were poly(vinylidene fluorine) with reference 5130, 6010 and PVDF-HFP,
111
all supplied by Solvay. PVDF 5130 is characterized by ultra-high viscosity with excellent adhesion, a
112
density of 1.75 g/cm3 and a tensile modulus between 1 to 1.5 GPa. PVDF 6010 is a homopolymer with
113
medium viscosity, density between 1.75 to 1.8 g/cm3 and a tensile modulus between 1.7 to 2.5 GPa.
114
Poly(vinylidene fluoride-co-hexafluropropylene) (PVDF-HFP), with reference Solef 21,216 and
115
VDF/HFP mole ratio of 88/12, shows a density of 1.78 g/cm3 and a tensile modulus between 400 to
116
600 MPa.
117
The solvent used to disperse the nanofillers and dissolve the PVDF was N,N′
-118
dimethylpropyleneurea (DMPU) and was purchased from LaborSpirit.
119
Multi-walled carbon nanotubes were supplied by Nanocyl with reference NC7000, showing an
120
average length of 1.5 μm, an outer mean diameter of 9.5 nm and 90% purity. Reduced graphene oxide
121
was obtained from The Graphene Box (Spain) with >99 % of purity, 1-5 µ m of length and 1-2 layers.
122
2.2. Sample preparation
123
Carbon nanofillers were dispersed in DMPU within an ultrasonic bath (ATU, Model
ATM40-124
3LCD) for an average time of 4 h, assuring a correct de-agglomeration and homogeneous dispersion
125
of the fillers in the solvent. Then, PVDF (5130, 6010 or HFP) was added to filler/solvent solution and
126
completely dissolved through magnetic stirring during approximately 3 hours at 30 °C. It is to notice
127
that this processing method has demonstrated to ensure good filler dispersion for both graphene [12]
128
and CNT [15]. Then, the solution was spread in a clean glass substrate by doctor blade method with
129
a 100 µ m blade thickness. Finally, films were melted in an oven at 210 °C during 25 min, promoting
130
the crystallization of the PVDF in the α-phase and achieving a complete solvent evaporation [39]. The
131
thicknesses of the films after complete evaporation of the DMPU solvent ranges from 20 to 60 µ m.
5
Films with the different polymer matrices and carbonaceous filler percentages were prepared,
133
as indicated in Table 1.
134
135
136
137
Table 1. PVDF-based polymers, nanofillers and solvent/polymer ratio used in the processing of the
138
nanocomposites.
139
DMPU/PVDF
vol / vol
CNT
(wt.%)
Nomenclature rGO
(wt.%)
Nomenclature
PVDF 5130
95/5
0
0.25
0.5
1
PVDF5130
0.25CNT/5130
0.5CNT/5130
1CNT/5130
0
0.5
1
2
PVDF5130
0.5rGO/5130
0.1rGO/5130
2rGO/5130
PVDF 6010
90/10
0
0.25
0.5
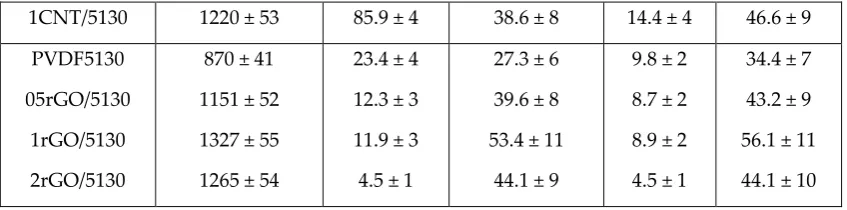
PVDF6010
0.25CNT/6010
0.5CNT/6010
PVDF-HFP
90/10
0
0.25
0.5
PVDF-HFP
0.25CNT/HFP
0.5CNT/HFP
140
2.3. Sample characterization
141
Fourier-transform infrared (FTIR) spectroscopy analysis was carried out in transmission mode
142
at room temperature from 4000 cm-1 to 600 cm-1 with a resolution of 4 cm-1 employing a Jasco
FT/IR-143
4100 spectrometer with a TGS detector.
144
Differential scanning calorimetry (DSC) tests were performed with a Netzsch DSC 200F3 Maia
145
set up. Samples were placed into Al pan crucibles, stabilized at 30 °C and then subjected to a
146
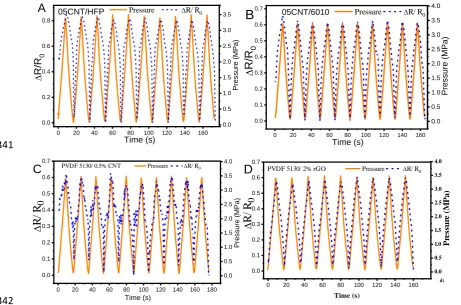
20 °C.min-1 heating rate up to 200 °C under nitrogen atmosphere.
147
Electrical conductivity was obtained after I-V measurements. Samples were submitted to a
148
voltage sweep from -10 to 10 V and the current was measured with a Keithley 6430 SourceMeter.
149
Gold electrodes were previously deposited in both sides of the films by magnetron sputtering with a
150
Polaron SC502 sputter coater. The electrical conductivity was obtained after equation 1 considering
151
sample thickness and electrode area:
6
153
𝜎 = 𝜌−1= (𝑅𝐴
𝐿) −1
(1)
154
where R is the electrical resistance, A the electrode area and L the sample thickness.
155
Electrical conductivity tests were performed in two sample points and repeated three times each.
156
The mechanical characterization of the nanocomposites was performed by tensile tests up to
157
failure with a Shimadzu AG-IS universal testing machine with a 50 N load cell, repeated for 5
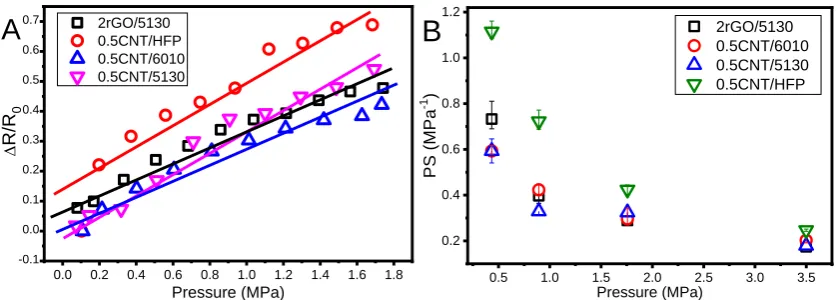
158
measures for each sample.
159
For the tensile tests, samples of 30x10 mm of area and 20 to 60 μm of thickness were cut from
160
the fabricated films, placed in the universal testing machine through a clamping system leaving an
161
approximate interspace between clamps of 10 mm to assure a proper grip of the sample. The
162
measurements were performed at speed of 1 mm/min and force and test time were recorded at a 100
163
ms rate. Engineering stress and strain (equations 2 and 3) were obtained according to:
164
165
𝜎 =𝐹
𝐴 (2)
166
𝜀 =𝛥𝐿
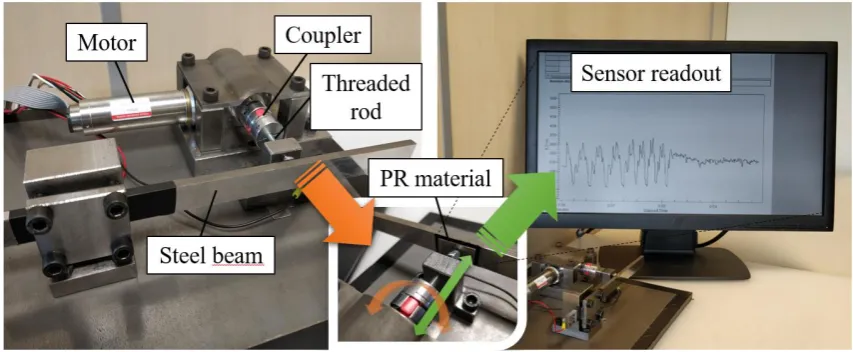
𝐿0 (3)
167
were F is the tensile force, A the transversal area of the sample considering the thickness and width
168
of the sample, ΔL the recorded displacement and L0 the initial interspace between clamps. Tensile
169
tests were repeated for three times, ensuring that measurements were consistent within materials.
170
The samples were considered as macroscopically homogeneous materials, without consider
non-171
local effects [40] due to the low filler content.
172
Electromechanical tests were performed under cyclic compression on samples with initial
173
minimum pre-load of 10 N corresponding to 0.09 MPa to forces of 50, 100, 200 and 400 N,
174
corresponding to 0.43, 0.86, 1.72 and 3.45 MPa, respectively, considering the contact area of the
175
compression tests. The piezoresistive tests were performed in a Shimadzu AG-IS universal testing
176
machine with a load cell of 500 N at speed of 0.5 and 1 mm/min, for 10 and 50 cycles and replicated
177
twice. Force and displacement were recorded with a 500 ms time span.
178
The acquisition of the electrical resistance between the compression pieces was performed with
179
an Agilent 344401A multimeter. Piezoresistive tests were repeated twice.
180
The quantitative evaluation of the pressure sensitivity (PS in equation 4) was performed
181
according to:
182
183
𝑃𝑆 =
∆𝑅 𝑅0
⁄
𝑃
(4)
7
where ΔR represents the resistance variation measured during the test and R0 the initial resistance of
185
the sample under the minimum pre-load and P is the pressure on the sample.
186
187
3. Results and discussion
188
3.1. Chemical and thermal characterization
189
Figure 1 presents the FTIR spectra of different neat semi-crystalline PVDF polymer (Figure 1A)
190
and the corresponding composites reinforced with CNT and rGO (Figure 1B). The presence of α
-191
phase in the samples is confirmed by the corresponding bands at 614, 763, 795 and 975 cm-1 [28],
192
whereas the presence of the β, γ and δ [28] phases has not been detected neither in the neat polymers
193
or the corresponding composites. In fact, the α-PVDF phase is the most common one when the
194
polymer is crystallizes from the melt [28]. No significative variations in the FTIR spectra was detected
195
among the different composites.
196
197
600 800 1000 1200 1400
Absorbance (a.u.)
PVDF-HFP
PVDF6010
PVDF5130
Wavenumber (cm-1)
A
600 800 1000 1200 1400
025CNT/HFP
025CNT/6010
1rGO/5130
Absorban
ce (a. u.
)
Wavenumber (cm-1)
PVDF5310 1CNT/5130
B
198
Figure 1. FTIR spectra of A) neat polymers and B) composites with CNT or rGO nanofillers.
199
200
Literature reports that some nanoparticles such as carbon nanotubes can influence the
201
crystallization phase of PVDF [41]. The neat conductive fillers CNT and rGO, without surface
202
modification, do not influence the crystallization phase of the polymers as observed in the FTIR
203
spectra (Figure 1B) for the PVDF composite materials, as reported previously [12]. Neat
204
nanocarbonaceous materials do not act as nucleating agents [41] in PVDF, leading just to α-phase
205
crystallization independently of filler type and content.
206
Thermal properties were evaluated by DSC thermograms for neat PVDF 5130, 6010 and HFP
207
(Figure 2A) and their corresponding nanocomposites with CNT or rGO with different filler content
208
(Figure 2B). Higher variability on the melting temperature (Tm) can be observed between the different
209
8
PVDF5130 and 6010, with Tm≈ 158.2 and Tm≈ 168.9 °C, respectively. The thermograms of the neat
211
polymers and the nanocomposites show a single peak corresponding to the melting of the α-phase
212
of PVDF [42].
213
214
60 80 100 120 140 160 180
PVDF-HFP
PVDF6010
H
e
a
t
F
lo
w
(
E
n
d
o
u
p
)
Temperature (ºC)
PVDF5130
A
60 80 100 120 140 160 180
025CNT/HFP
025CNT/6010
1rGO/5130
Heat
Flow (En
do Up
)
Temperature (ºC) 05CNT/5130
B
215
Figure 2. DSC scans of A) neat PVDF 5310, 6010 and HFP and B) corresponding nanocomposites with
216
CNT and rGO for different filler contents.
217
218
PVDF composites with CNT or rGO lead to crystallization temperatures slightly higher than the
219
neat polymers, increasing less than 2 °C in all cases, demonstrating that the effect of the fillers in the
220
melting behaviour of the samples is quite small and independent of filler type and content,
221
confirming the low interaction between fillers and polymers observed in the FTIR spectra (Figure 1),
222
where the introduction of the fillers lead to no new chemical bonds or variations in the polymer bonds.
223
224
3.2. Electrical characterization
225
The volume electrical conductivity for the different composites is shown in Figure 3. Electrical
226
conductivity increases with the inclusion of both nanofillers for all PVDF copolymers, showing a
227
percolation threshold lower than 0.5 wt.% for CNT/PVDF composites and near 2 wt.% for
228
rGO/PVDF5130 composites. Conductive network formed by the CNT is more effective than for rGO
229
for similar filler contents into the PVDF matrix, the intrinsic conductivity of the CNT being higher
230
than the one of the rGO nanofillers. Further, the aspect ratio of the CNT is larger than the one of the
231
2D materials, leading to lower percolation threshold composites. The conductivity of the neat
232
polymers is in agreement with the manufacturer specifications and is similar among PVDF
233
copolymers [11, 42, 43]. Among CNT nanocomposites, PVDF6010 shows the higher electrical
234
conductivity for filler content between 0.25 and 0.5 wt.% when compared to PVDF-HFP and 5310
235
composites. The electrical conductivity for CNT/PVDF6010 is higher for 0.25 wt.% CNT (near 2 orders
9
of magnitude) but for composite with 0.5 wt.% filler content the electrical conductivity is in the same
237
order of magnitude for all polymer matrices. Their percolation threshold is thus around 0.5 wt.%
238
CNT and the maximum conductivity is ≈5×10⁻¹(Ω.m)-1, as reported in literature for CNT/polymer
239
materials [43, 44]. It is to notice that percolation thresholds below 0.1 wt.% of CNT have been reported
240
for PVDF matrix composites [44], which is not verified in the present work.
241
242
0.00 0.25 0.50 0.75 1.00 1.25 1.50 1.75 2.00 10-10
10-8 10-6 10-4 10-2
CNT/6010
CNT/HFP
rGO/5130
Conduct
ivit
y
(
W
.m
)
-1
Nanofiller content (wt.%)
CNT/5130
243
Figure 3. Electrical conductivity of the fabricated samples as a function of filler type and content. The
244
lines are for guiding the eyes.
245
246
With respect to rGO/PVDF5130 nanocomposites, they show lower conductivity when compared
247
to CNT at the same filler content, which is attributed to the lower aspect ratio and intrinsic
248
conductivity of rGO when compared to CNT, leading to an increase of percolation threshold of the
249
composite. The rGO/5130 up to 1 wt.% filler content shows similar electrical conductivity than neat
250
PVDF5130 and the percolation threshold is ≈2 wt.% rGO, with an electrical conductivity of σ≈ 1×10⁻⁵
251
(Ω.m)-1.
252
The intrinsic properties of CNT lead to low percolation thresholds in polymer-based composites.
253
To tailor polymer-based nanomaterials with functional properties, low nanofiller content are
254
typically required in order not to affect other properties of the polymer, such as thermal or mechanical.
255
In terms of higher conductivity and lower threshold, CNT appear as more interesting
256
nanocarbonaceous filler than rGO for conductive polymer nanocomposites.
257
258
3.3. Mechanical measurements
10
Mechanical measurements were performed to evaluate the stress-strain response of the several
260
PVDF polymers and composites, as a function of the filler content and type. As it is shown in Figure
261
4, CNT tend to reinforce the PVDF matrix, leading to a higher stiffness for the composites when
262
compared to neat matrix [45-48]. However, at the higher CNT contents, maximum stress increases,
263
while the maximum strain of the composites decreases. This effect is ascribed to the heterogeneity of
264
the composites caused by filler agglomeration [49] that limits the mechanical strain for all PVDF
265
matrices, PVDF-HFP, 6010 and 5130. Maximum stress of the CNT/PVDF samples, near the yielding
266
of the PVDF and composites, increases with increasing CNT content. This means that the CNT
267
effectively mechanically reinforce the composites, as presented in Table 2, and that the CNT
268
agglomerates can act as mechanical interlocking between polymer chains and the filler [49]. In fact, it
269
has been shown in different graphene/PVDF [12] and CNT/PVDF [15] composites with low filler
270
content into the PVDF matrix, that their presence do not influence the spherulitic size and the kinetic
271
of crystallization, the cross-section SEM images demonstrating a homogeneous dispersion of the
272
nanocarbonaceous fillers, independently of the filler type and content [12]. Morphological analysis
273
of the nanocarbonaceous/polymer composites have been intensively studied in literature [7, 50, 51],
274
the present results being in agreement with the reported literature (data not shown).
275
Among the different polymers, PVDF6010 shows the highest yield strength (larger than 40 MPa)
276
and PVDF-HFP the lowest yield stress (lower than 20 MPa), being inversely for strain at rupture,
277
where PVDF-HFP shows the larger strain, near 70%, and the 6010 rupture is near 12%. At rupture,
278
composites with CNT embedded in PVDF-HFP and 5130 present larger maximum strain, reaching
279
200% of strain for 025CNT/5130 and 300% for 025CNT/HFP samples. In all the composite samples,
280
except the ones including rGO, the inclusion of CNT fillers yields to higher stiffness and elongation
281
at break. From the behaviour observed in the rGO/PVDF samples it can be concluded that the
matrix-282
filler wetting is considerably weaker than the PVDF-CNT one, leading to brittle fracture of the
283
samples. In fact, literature has reported on the decreasing of the maximum strain with low graphene
284
content as reinforcement for PVDF 1010 [12].
285
286
0 50 100 150 200 250 300 350 0
5 10 15 20 25
05CNT/HFP
025CNT/HFP
Stress
(MPa)
Strain (%)
PVDF-HFP
A
0 5 10 15
0 10 20 30 40 50 60
Stress
(MPa)
05CNT/6010
025CNT/6010
PVDF6010
Strain (%)
B
11
0 50 100 150 200
0 10 20 30 40 50 025CNT/5130 Stress (MPa) 05CNT/5130 1CNT/5130 PVDF5130 Strain (%)
C
0 5 10 15 20 25
0 10 20 30 40 50 60 Stress (MPa) 1rGO/5130 2rGO/5130 05rGO/5130 PVDF5130 Strain (%)
D
288
Figure 4. Stress-strain response for PVDF and the corresponding composites for A) PVDF-HPF, B)
289
PVDF6010 and C) PVDF5010 for different CNT contents. D) PVDF5130 reinforced with rGO.
290
291
The initial modulus for neat PVDF is larger for 6010 near E≈ 1 GPa being E≈ 870 and E≈ 350 MPa
292
for 5310 and HFP, respectively. Reinforced with CNT, all PVDF matrices increase the initial modulus
293
with increasing CNT content, excepting for the 1CNT/5310 sample. Similar behaviour is found in
294
rGO/5310 composites, where the initial modulus increases with filler content up to 1 wt.%, decreasing
295
for samples with 2 wt.%.
296
The 05CNT/6010 sample shows an initial modulus near E≈ 1.4 GPa. The larger initial modulus
297
and yield stress of the PVDF 6010 composites is correlated with the percolation threshold, that
298
depends on the filler dispersion, but also rigidity of the matrix [52], decreasing the threshold below
299
0.5 wt.%.
300
301
Table 1- Mechanical parameters obtained from the stress-strain measurements for the different PVDF
302
matrices and the corresponding composites with CNT and rGO.
303
Sample Initial modulus
(MPa) Strain at rupture (%) Stress at rupture (MPa) Yield strain (%) Yield stress (MPa) PVDF-HFP 025CNT/HFP 05CNT/HFP
356 ± 15
372 ± 16
439 ± 18
70.8 ± 4
328.2 ± 16
309.5 ± 15
15.5 ± 3
17.4 ± 4
22.4 ± 4
12.7 ± 3
19.3 ± 5
18.3 ± 4
18.1 ± 4
19.1 ± 4
22.3 ± 5
PVDF6010
025CNT/6010
05CNT/6010
1065 ± 45
1293 ± 49
1388 ± 51
11 ± 2
11.1 ± 2
13.6 ± 3
42.8 ± 8
49.5 ± 10
51.9 ± 10
9.6 ± 2
8.9 ± 2
8.3 ± 2
44.7 ± 10
51.9 ± 11
55.9 ± 12
PVDF5130
025CNT/5130
05CNT/5130
870 ± 40
863 ± 40
1244 ± 54
23.4 ± 5
212.9 ± 13
99.2 ± 5
27.3 ± 6
30.0 ± 6
32.0 ± 7
9.8 ± 2
13.3 ± 3
13.2 ± 3
34.4 ± 7
42.0 ± 8
12
1CNT/5130 1220 ± 53 85.9 ± 4 38.6 ± 8 14.4 ± 4 46.6 ± 9
PVDF5130
05rGO/5130
1rGO/5130
2rGO/5130
870 ± 41
1151 ± 52
1327 ± 55
1265 ± 54
23.4 ± 4
12.3 ± 3
11.9 ± 3
4.5 ± 1
27.3 ± 6
39.6 ± 8
53.4 ± 11
44.1 ± 9
9.8 ± 2
8.7 ± 2
8.9 ± 2
4.5 ± 1
34.4 ± 7
43.2 ± 9
56.1 ± 11
44.1 ± 10
304
The strain at rupture for composites with PVDF 6010 is similar for the different CNT contents,
305
increasing in the remaining PVDF composites, from 70 to 300% in HFP and 23 to 210% in 5130.
306
PVDF5130 with rGO filler suffer a decrease of the strain at rupture from 23 to 4.5%, from neat polymer
307
to the composite with 2 wt.% rGO, respectively. The yield stress and strain are comparable for both
308
fillers (CNT and rGO) in PVDF 5130 materials. The load transfer efficiency and interfacial shear stress
309
of the composites as a function of the dimensions of the fillers has been theoretically calculated [53].
310
The CNT and rGO fillers employed in the present work show average lengths of 1.5 μm and 1 to 5
311
μm for CNT and rGO, respectively. The CNT diameter is 9.5 nm and the rGO thickness is 1-2 layers
312
that correspond to 2-3 nm [54]. Thickness and length of the employed nanocarbonaceous fillers are
313
similar, being different the width of both materials, from 9.5 nm to 1-5 μm, respectively, for CNT and
314
rGO. In this way, theoretical and experimental results are in agreement, the larger nanofillers leading
315
to better reinforcement of the composites [55], as observed in the rGO/5130 composites, which show
316
slightly higher initial modulus when compared to CNT/5130 composites.
317
Those results reflect not just the different mechanical characteristics of the polymers but also the
318
different wettability between polymer and fillers, depending on macromolecule characteristics.
319
320
3.4. Electromechanical measurements
321
PVDF composites with CNT or rGO as filler are excellent candidates for electromechanical
322
sensors, leading to high sensibility composites [11, 24]. Electromechanical compression tests (in
323
Figure 5) were performed in the composites around the percolation threshold to evaluate the
324
sensitivity and linearity of the different materials. The mechanical stress-strain cycles applied to the
325
samples up to 3.45 MPa is shown in Figure 6. It can be observed a slight nonlinear response and that
326
the mechanical hysteresis is very low for the 05CNT/5130 composites, being similar for the different
327
nanocomposites.
328
13
0.00 0.02 0.04 0.06 0.08 0.10 0.12 0.140.0 0.5 1.0 1.5 2.0 2.5 3.0 3.5
0.00 0.02 0.04 0.06 0.08
0.5 1.0 1.5 Stress (MP a) Strain (mm)
Stress (MP
a)
Strain (mm)
0.43 MPa 0.86 MPa 1.72 MPa 3.45 MPa330
Figure 5- Stress-strain mechanical response for the 05CNT/PVDF composite, as representative for the
331
rest of the nanocomposites.
332
333
Figure 6 show 10 loading-unloading tests performed at a maximum load of 3.5 MPa (400 N of
334
force) for the different composites with 0.5 wt.% CNT content and the 2rGO/5130 sample.
335
Electromechanical tests show good linearity between electrical resistance variation and applied
336
pressure for the different matrices and fillers, as a function of the pressure. Similar electromechancial
337
linearity and cycling performance has been reported in [56, 57] with different materials and
338
experimental approaches.339
340
0.0 0.5 1.0 1.5 2.0 2.5 3.0 3.5 Press ure (M Pa)A
05CNT/HFP0 20 40 60 80 100 120 140 160
0.0 0.2 0.4 0.6 0.8 D R/R 0
Pressure DR/ R0
Time (s) 0.0 0.5 1.0 1.5 2.0 2.5 3.0 3.5 4.0
Pressure DR/ R0
Time (s)
B
0 20 40 60 80 100 120 140 160
0.0 0.1 0.2 0.3 0.4 0.5 0.6 0.7 D
R/R
0 Pr es su re (MP a) 05CNT/6010341
0.0 0.5 1.0 1.5 2.0 2.5 3.0 3.5 4.00 20 40 60 80 100 120 140 160 180
0.0 0.1 0.2 0.3 0.4 0.5 0.6 0.7
PVDF 5130/ 0.5% CNT Pressure DR/ R0
Pressur e ( MPa) D
R
/
R
0 Time (s)C
0.0 0.5 1.0 1.5 2.0 2.5 3.0 3.5 4.0 P re ss u re ( M P a )D
0 20 40 60 80 100 120 140 160
0.0 0.1 0.2 0.3 0.4 0.5 0.6 0.7 d)
PVDF 5130/ 2% rGO Pressure DR/ R0
14
Figure 6- Electromechanical performance of the A) PVDF-HFP, B) 6010 and C) 5130 with 0.5 wt.% of
343
CNT for 10 cycles from unload to 3.5 MPa of pressure. D) PVDF 5130 reinforced with 2 wt.% CNT in
344
cycles up to 3.5 MPa
.
345
346
The composites present larger piezoresistive sensibility near the percolation threshold [58]. The
347
linear behaviour between the applied pressure and electrical resistance variation is present in all
348
composites, for loading and unloading cycles, as shown in Figure 6 and 7A.
349
350
0.0 0.2 0.4 0.6 0.8 1.0 1.2 1.4 1.6 1.8
-0.1 0.0 0.1 0.2 0.3 0.4 0.5 0.6
0.7 2rGO/5130
0.5CNT/HFP 0.5CNT/6010 0.5CNT/5130
D
R/
R0
Pressure (MPa)
A
0.5 1.0 1.5 2.0 2.5 3.0 3.5
0.2 0.4 0.6 0.8 1.0 1.2
PS
(MP
a
-1 )
Pressure (MPa)
2rGO/5130 0.5CNT/6010 0.5CNT/5130 0.5CNT/HFP
B
351
Figure 7- Electromechanical response of the different composites. Linearity between applied pressure
352
and relative resistance variation in A) and pressure sensitivity for composites with 0.5 wt.% of PVDF
353
matrices and 2rGO/5130 composite.
354
355
The pressure sensibility was evaluated in the different nanocarbonaceous/PVDF composites as
356
a function of polymer and filler type and applied pressure. The highest sensitivity is obtained for
357
05CNT/HFP composite with PS≈ 1.1 MPa-1, as shown in Figure 7. Further, as it is shown in Figure 7B
358
that the piezoresistive sensitivity decreases with increasing applied pressure due to the compression
359
of the filler network and therefore the filler-filler distance. This is in agreement with related
CNT-360
based nanocomposites, showing the opposite behaviour with respect to test performed under tensile
361
electromechanical conditions [16, 59]. Further, all composites present good linearity between
362
electrical resistance variation and applied pressure during the compression cycles, with CNT/6010
363
and rGO/5130 composites showing the larger piezoresistive sensitivity. On the other hand, although
364
showing good sensitivity and piezoresistive response, 05CNT/5130 composites show lower electrical
365
stability (Figure 6C) when compared with the other composites.
366
3.5. Proof of concept application
367
The validation of the sensor in pressure sensing applications was performed using the
368
05CNT/6010 composite. The CNT nanocomposite was integrated in a developed test bench built to
15
emulate the mechanical stiffness present in different mechanisms. With this use case, the capability
370
of employing the developed materials to fabricate sensors which could be applied in industrial smart
371
components is evaluated.
372
The test bench, shown in Figure 8, consists of a PMDC motor which through a torque coupler
373
actuates in a threaded rod, producing a net displacement of the tip of the rod. This tip rests against a
374
stainless-steel cantilever beam, which opposes the rod axial displacement. Thus, the PMDC motor
375
produces a torque in the rod that is translated into an axial force which deflects the beam. The motor
376
has a gearbox of 31:1. Considering that the thread pitch is 1 mm, the relationship between motor
377
revolutions and rod tip displacement is 32.3 µ m/rev.
378
The nanocomposite material was integrated between the beam and threaded rod. The resistance
379
change produced under the compression pressure was measured between the fixtures of the beam
380
and the rod employing a Fluke 8845A multimeter and logged through PC. The PMDC motor (Maxon
381
EC-4 pole 22 mm) was actuated by an EPOS2 controller.
382
Figure 8 shows the sensor readout when submitted to 8 cycles of 4 revolutions forward and back,
383
as representative performance of the piezoresistive sensor. The angular velocity was 750 rpm for the
384
first 4 cycles and 1500 rpm for the latter four cycles.
385
386
387
Figure 8- Fabricated test bench using CNT/PVDF as sensor material and obtained measurements.
388
389
Figure 8 shows that the sensor readout presents high repeatability between the cycles both at
390
high and low rotational speed. No significant drift is presented in the measured signal, confirming
391
the suitability of the developed materials for sensor applications.
392
16
Different PVDF copolymers were reinforced with carbon nanotubes (CNT) and reduced
394
graphene oxide (rGO) fillers to evaluate the performance of the materials for piezoresistive sensor
395
applications.
396
FTIR analysis shows that PVDF crystallizes in the α-phase, independently of polymer type and
397
filler type and content. Similarly, mechanical tensile modulus of the matrix and reinforcement filler
398
(CNT or rGO) do not influence filler dispersion for low filler contents. Thermal measurements show
399
the melting temperature around 132, 158 and 169 ºC for PVDF-HFP, 5310 and 6010, respectively. This
400
temperature is just slightly affected by the inclusion of the fillers. With respect to the mechanical
401
response, PVDF 6010 presents the highest initial modulus. Tensile tests demonstrate that the
402
inclusion of fillers reinforce the polymer matrices, leading to higher stiffness, yield strength or
403
elongation at break depending on the percentage used. Their percolation threshold is lower for the
404
CNT nanocomposites, when compared with the rGO ones, being the percolation threshold
405
independent on the polymer matrix.
406
Pressure sensibility is larger for PVDF-HFP with 0.5 wt.% CNT for low applied pressures. For
407
largest pressure, the PS is similar for all materials. The electromechanical pressure sensibility of the
408
materials as a function of pressure varies between 0.2 <PS < 1.1. The linearity between the electrical
409
resistance variation and pressure is present in all composites. Finally, a proof of concept is presented
410
showing the suitability of the materials for applications. Hence, PVDF/CNT and rGO based
411
piezoresistive nanocomposites present suitable characteristics to work as embeddable, highly
412
sensitive and cost-effective sensors in industrial pressure sensing applications.
413
414
Acknowledgments:This work was supported by the Portuguese Foundation for Science and Technology (FCT)
415
in the framework of the Strategic Funding UID/FIS/04650/2019. The authors thank the FCT for financial support
416
for the SFRH/BPD/110914/2015 (P. C) grant, the Department of Education of the Basque Government for the
417
financial support through the PRE_2018_2_0010 grant, as well POCH and European Union. Financial support
418
from the Basque Government Industry and Education Departments under the ELKARTEK, HAZITEK and PIBA
419
(PIBA-2018-06) programs, is also acknowledged.