Volume 9, No. 1, January-February 2018
International Journal of Advanced Research in Computer Science
RESEARCH PAPER
Available Online at www.ijarcs.info
ISSN No. 0976-5697
GRID BASED APPROACH FOR EFFICIENT ROUTING IN WIRELESS SENSOR
NETWORKS
Rajat Sethi
Lecturer, Department of Computer Science & IT Jammu University
Jammu, India
Abstract: Wireless sensor networks (WSNs) supports wide range of applications such as health and environment monitoring, imaging, tracking, and biomedical research. Hence they can be useful in a number of situations. Wireless sensor networks sense some physical scenario and propagate the sensed data to the base station with the help of intermediate nodes. Area coverage is an important issue in these networks. The objective of complete area coverage is to find out redundant nodes and deactivate them, so that the remaining active nodes can cover the deployed area. Among the various existing approaches for area coverage in WSN, a grid based approach has been proposed that provides a better way to select the active nodes or deactivate the redundant nodes from the grid rather than choosing the nodes from the deployed area. The existing approach goes with certain limitations such as how many numbers of grids need to be made in a certain deployed area with a certain number of nodes and how much percentage of nodes need to be selected from each grid. Our proposed protocol outperforms the existing grid based protocol with respect to energy saving, network lifetime and End to End delay.
Keywords: Wireless Sensor Network, Voronoi, Delaunay, Redundant nodes, Lifetime, Computational Geometry, End to End delay.
I. INTRODUCTION
A Wireless Sensor Network is a buildup of sensor nodes with restricted power supply and limited computational and transmission capacity. Because of the restricted transmission and computational capacity, and high density of sensor nodes, sending of information packets happens in multi-hop fashion [1]. Hence routing of packets in wireless sensor networks has been a critical territory of research in the previous couple of years. The sensor nodes run on non-rechargeable batteries with limited power, so along with efficient routing the network there should be energy efficient routing with efficient utilization of the resources and hence this is an important research concern [2].
Designing suitable routing algorithms for different applications, fulfilling the different performance demands has been considered as an important issue in wireless sensor networks. In this context many routing algorithms have been proposed to enhance the execution requests of different applications through the system layer of the wireless sensor systems convention stack [3] [4], but most of them are based on single-path routing.
[image:1.595.326.557.355.459.2]In single-path routing approach basically source selects a single path which satisfies the performance demands of the application for transmitting the load towards the sink. Though the single path between the source and sink can be developed with minimum computation complexity and resource utilization, the other factors such as the limited capacity of single path reduces the available throughput [5]. Furthermore, considering the problematic wireless connections single way routing is not adaptable to connection disappointments, corrupting the system performance. Finding an alternate path after the primary path has disrupted to continue the data transmission will cause an extra overhead and increase delay in data delivery.
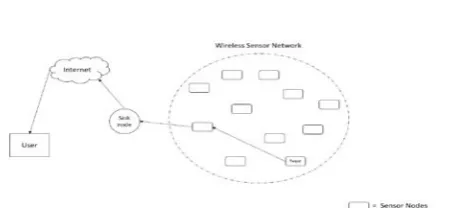
Figure 1: Architecture of Wireless Sensors Network
The wireless sensor network is the combination of various sensing nodes which transfer their sensed data to a sink node which in turn is used by the user to evaluate various parameters which are require for the study of the system under consideration.
Sensing unit: it is composed of collection of different types of sensor which are needed for measurement of different phenomenon of the physical environment. Sensors are selected based on its application. Sensor output is electric signal which is analog. So, analog-to-digital converter (ADC) is used to transform the signal to digital to communicate with the microcontroller.
Processing unit: it consists of a processor (microcontroller) and storage (RAM). In addition it has operating systems as well as timer. The responsibility of the processing unit includes collecting data from various sources than processing and storing. Timer is used to do the sequencing for the sequence.
Communication unit: it uses a transceiver which consists of a transmitter as well as a receiver. The communication is performed through the communication channels by using the network protocol. Based on the application requirements and relevance in order to communicate it normally uses suitable method such as radio, infrared or optical communication.
battery or power generator which is connected to the power unit. Power unit is required for the efficient use of the battery.
Figure 2: Structure of a sensor node
II. LITERATURE SURVEY
There are a number of challenges and issues which needs to be tackled while setting up a wireless sensor network. An important issue among them is area coverage along with energy efficiency. Since the sensors are usually powered by a battery with limited power hence energy efficiency should also be kept in mind while designing an area coverage algorithm for them. The major objectives of any coverage approach is to keep the whole network up for as long as possible and using minimum resources for keeping the networking up and in working state. There are mainly three types of coverage approaches namely, point coverage, path coverage and area coverage. Further to achieve full area coverage there are three types of approaches namely, Force Based, Computational Geometry Based and Grid Based.
A. Force Based Approach: This type of coverage approaches mainly rely on the mobility of the sensors, their attractive and repulsive forces to attain full area coverage in the network. The sensors are deployed in the region of interest and the sensors the move away or move towards each other due to repulsive and attractive forces. The sensors keep on moving until they attain an equilibrium state [6].
[image:2.595.370.539.250.407.2]B. Grid Based Approach: In this approach the whole region of interest is divided into a number of grids. Each grid can contain one or more number of sensor nodes. Then the coverage algorithm is designed so as to keep the communication going between the grids. Virtual force algorithms are used for movement of sensor nodes between grids if required. Before actually moving the sensor node, simulation of the movement is done and checked only after that the physical movement is done [7].
Figure 3: Types of Grids
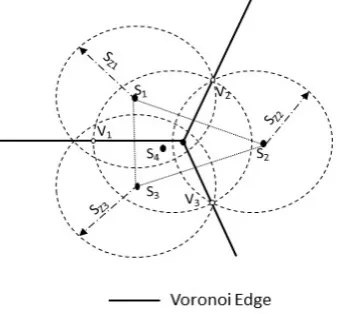
C. Computational Geometry Based: Mainly there are two types of Computational Geometry Based approaches namely, Voronoi Approach and Delaunay triangulation. In Voronoi approach each sensor acts a voronoi site. This approach uses a voronoi polygon such that all its vertices are covered by a sensor node [8]. Basically, in voronoi polygon approach, polygons are drawn where the sensing area of nodes touches each other as shown in the figure 4 and based on the edges of these polygons the coverage is determined between any two points in the coverage area [9]. In case of Delaunay Triangulation all the sensor nodes whose sensing area (Voronoi Polygons share same edge) touches each other are connected to each other as shown in the figure below. If all voronoi vertices and intersection points of a node are covered by its neighbors then that node is said to be redundant, S4 is redundant node in the
diagram shown below.
Figure 4: Finding redundant node using Voronoi approach
Coverage problem in majority of WSNs, is caused due to the following reasons:
1. Region of interest doesn’t contains enough number of sensor nodes.
2. Deployment of the sensor nodes is random. 3. Sensing range of the deployed sensors.
As we know that the sensors are powered by limited battery thus there can be cases when sensor nodes can run out of battery therefore resulting in inadequate sensors which might not be able to fully cover the Region of interest [10]. Also the sensing range of the deployed sensors is limited, thus there can be cases when the sensor might not be able to sense the physical activity it was designed for. Of course this can be resolved by increasing the sensing range of the sensor nodes but at the same time this increases per unit cost for the sensors. Increasing the sensing range of the sensors also results in increase in power consumption by the node which in turn will reduce the lifetime of the network. Thus all the above issues should be kept in mind while designing a coverage algorithm of the WSNs [11] [12].
III. PROPOSED APPROACH FOR AREA COVERAGE
[image:2.595.59.277.457.771.2]utilization in the wireless sensor network. Let us consider the network as shown in figure below.
Figure 5: Area Coverage by sensor nodes
The Region of Interest is first of all divided into a number of grids using the following approach.
1. Consider the whole ROI as a single grid in the beginning.
2. Divide the grid into four equal sized grids if the diagonal of the grid is greater than the sensing radius of the node.
3. Repeat the following step until no grid is having number of nodes greater than a predefined threshold value
The threshold value is calculated as
Let us consider that the Region of Interest is rectangular in shape having length ‘X’ and width ‘Y’. Let the sensor nodes be randomly distributed and the number of sensor nodes in the grid be ‘N’. Then the threshold value (T) can be calculate as T = (X*Y) / µN
Now the sensing radius should also be taken into consideration while selecting the Threshold value. Let ‘SZ’ be the average
sensing zone of each node. Then µ = SZ = (∑Szi) / N
Then the threshold value can be updated as- T = (X*Y) / (N*SZ)
The girds can be of similar size or variable size. The size of the grids are chosen on the basis of sensing range of the sensor nodes. After the grids are created, then the number of sensor nodes in each grid are calculated and then the following algorithm is applied in each grid. The grid will have three type of nodes
i. Active - These type of nodes will participate in monitoring the area under the current grid.
ii. Non-active - These type of node will be kept off in order to save energy in the network.
iii. Redundant - These are the nodes which are active but are redundant that is the whole area is still covered by the remaining active nodes even if they become Non-active.
Initially the list of active nodes is empty.
Algorithm for selecting the active nodes in each grid
1. Calculate the energy of each Non-active node present in the grid.
2. Select top ‘i’ number of nodes having maximum energy such that i < No. of nodes in the Grid
3. Find the queue length, qi on each of the selected ‘i’
nodes in the grid.
4. Select the node j, having least queue length qj as the
active node.
5. Add node j to the list of active nodes.
6. Check if whole grid is covered by the active node(s).
a. If whole area of grid is not covered by the by the active nodes go to Step 1.
b. If whole are of grid is covered by the active nodes the go to step 7.
7. Remove the redundant nodes from the list of active nodes in the grid.
8. Put all the remaining nodes in the Non-active list into the sleep mode.
In order to maximize the lifetime of the sensor network the algorithm should be run as soon as the area under consideration is disconnected. Redundancy check after each iteration can be time consuming as well as energy consuming. So it can be costly to run the redundancy check after each iteration of the algorithm. Thus in order to overcome this problem the redundancy check should be done only after the whole area under consideration is covered by the active nodes.
IV. RESULTS EVALUATION
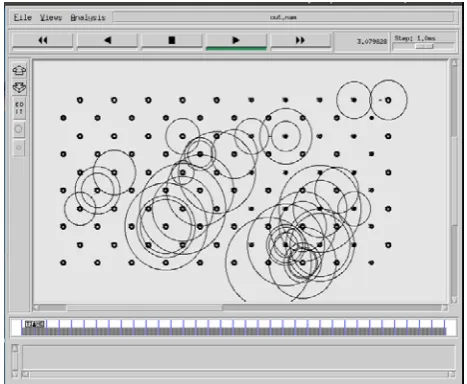
[image:3.595.319.553.366.558.2]The performance of the protocol proposed, is studied by using the network simulator (NS2). The scenario used for the analysis is as shown in the figure. The tests have been done by varying the deployment area, no. of nodes and results are calculated. The simulation environment was set up in network simulator (NS2), nodes were randomly distributed in the deployment area. A screenshot of the simulation is shown in the figure 6.
Figure 6: Simulation of Wireless Sensor Network with 100 nodes
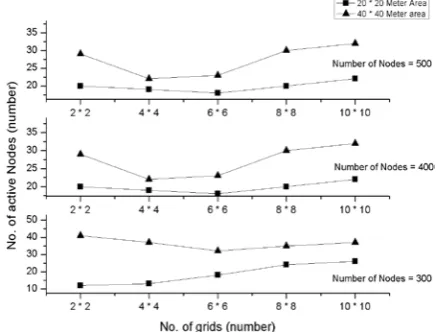
Figure 7: Number of active nodes in grids with respect to the number of grids
[image:4.595.62.282.62.228.2]Figure 8 shows the number of redundant nodes in the network compared to the number of nodes in the network. We can see from the graph that as the number of nodes increases the number of redundant nodes also increase our proposed protocol has more redundant nodes initially but as the number of nodes increase our proposed has less number of redundant nodes as compared to the existing grid based approach.
Figure 8: Number of redundant nodes with respect to number of nodes in the network
Figure 9 shows time consumed for setting up the network with respect to the deployment area. As shown in the graph, as the deployment area increases, the time consumed also increases. Still our proposed protocol works better and consumes less time as compared to the traditional grid based approach.
Figure 9: Time consumed with respect to the Deployment area.
Figure 10 shows the comparison of the number of active nodes with the deployment area. We can see that as the deployment area increases the number of active nodes also increase. As we can see from the graph that our proposed protocol has less number of active nodes as compared to traditional grid based approach.
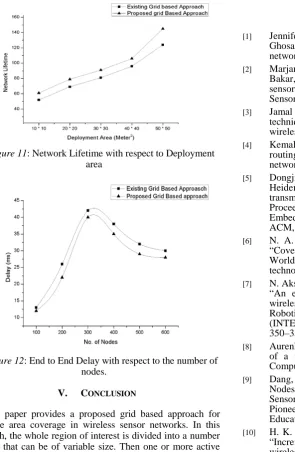
Figure 11 shows the comparison of the network lifetime with respect to the deployment area. We can see that our proposed protocol has better network lifetime as compared with the deployment area.
[image:4.595.69.276.354.515.2]Figure 12 shows the comparison of the end to end delay with respect to the number of nodes in the network. As evident from the graph our proposed protocol has better end to end delay as compared to the traditional grid based approach. As the number of nodes increases the delay first increases then decreases.
[image:4.595.331.550.473.647.2]Figure 11: Network Lifetime with respect to Deployment area
Figure 12: End to End Delay with respect to the number of nodes.
V. CONCLUSION
This paper provides a proposed grid based approach for complete area coverage in wireless sensor networks. In this approach, the whole region of interest is divided into a number of grids that can be of variable size. Then one or more active nodes are chosen from each grid which help in communication between different grids thus keeping whole area under communication. The proposed protocol also uses voronoi approach to deactivate redundant nodes in the network thus saving energy and at the same time providing efficient area coverage.
VI. REFERENCES
[1] Jennifer Yick, Biswanath Mukherjee, and Dipak Ghosal. Wireless sensor network survey. Computer networks, 52(12):2292-2330, 2008.
[2] Marjan Radi, Behnam Dezfouli, Kamalrulnizam Abu Bakar, and Malrey Lee. Multipath routing in wireless sensor networks: survey and research challenges. Sensors, 12(1):650-685, 2012.
[3] Jamal N Al-Karaki and Ahmed E Kamal. Routing techniques in wireless sensor networks: a survey. IEEE wireless communications, 11(6):6 28, 2004.
[4] Kemal Akkaya and Mohamed Younis. A survey on routing protocols for wireless sensor networks. Ad hoc networks, 3(3):325-349, 2005.
[5] Dongjin Son, Bhaskar Krishnamachari, and John Heidemann. Experimental study of concurrent transmission in wireless sensor networks. In Proceedings of the 4th international conference on Embedded networked sensor systems, pages 237-250. ACM, 2006.
[6] N. A. A. Aziz, K. A. Aziz, and W. Z. W. Ismail, “Coverage strategies for wireless sensor networks,” World academy of science, Engineering and technology, vol. 50, pp. 145–150, 2009.
[7] N. Akshay, M. P. Kumar, B. Harish, and S. Dhanorkar, “An efficient approachmfor sensor deployments in wireless sensor network,” in Emerging Trends in Robotics and Communication Technologies (INTERACT), 2010 International Conference on, pp. 350–355, Dec 2010.
[8] Aurenhammer, Franz. "Voronoi diagrams—a survey of a fundamental geometric data structure." ACM Computing Surveys (CSUR) 23.3 (1991): 345-405.
[9] Dang, Xiaochao, et al. "An Algorithm for Hybrid Nodes Barrier Coverage Based on Voronoi in Wireless Sensor Networks." International Conference of Pioneering Computer Scientists, Engineers and Educators. Springer, Singapore, 2017.
[10] H. K. Sethi, S. Dash, M. R. Lenka, and A. R. Swain, “Incremental model for complete area coverage in wireless sensor networks,” in Computational Intelligence and Networks (CINE), 2015 International Conference on, pp. 92–97, Jan 2015.
[11] V. K. Balihar Singh, “A modified approach for aggreration technique in wsn,” (IJCSIT) International Journal of Computer Science and Information Technologies, vol. 5 (6), pp. 7773–7775, 2014.