Volume 8, No. 5, May-June 2017
International Journal of Advanced Research in Computer Science RESEARCH PAPER
Available Online at www.ijarcs.info
ISSN No. 0976-5697
Neural Network Based Bug Priority Prediction Model using Text Classification Techniques
Pooja Awana Choudhary
Centre for Computer Science and Technology Central University of Punjab
Bathinda, India
Dr. Satwinder Singh
Center for Computer Science and Technology Central University of Punjab
Bathinda, India
Abstract: As open source software systems are becoming larger and more complicated, the task of bug detection and fixing to improve the performance of the software is also getting more complex, time consuming and inefficient. To improve the quality and efficiency of the software, developers allow users to report bugs that are found by them using bug tracking system such as Bugzilla. In Bugzilla users specify the details of the bug, such as the description, the component, the version, the product and the severity. Depending on this information the developers assign the priority levels to the reported bugs. The task of prioritizing the bug reports is manual, therefore it is time-consuming and inconsistent. In this dissertation, Neural Network technique is used for developing prediction models for five different versions (2.0, 2.1, 3.0, 3.1, and 3.2) of Eclipse that will assign the priority levels based on the information provided in each bug report. The features that potentially affect the priority of a bug are temporal, textual, author-related, severity, product and component. Collected dataset is used to train and test the classification algorithms. ROC and F-measure is used to interpret the results.
Keywords: Neural Network, Priority Prediction, Machine Learning, Textual Analysis, MLP, Naïve Bayes, Eclipse, Bugzilla.
1. INTRODUCTION
In the present scenario, there are situations where the size of the software is increasing at an exponential rate and that implies complexity too is growing. As a result, defects enter the softwareand lead to functional failures. Furthermore, the defects that are initiated by the software are of varying severity levels.There are various bugtracking systems that contain detailed information about thesedefects along with their ID’s and associated severity level. These defects range from mild to catastrophic based on their effects, wherein catastrophic defects are most severe defects and may lead the entire system to go to a crash state. Hence, the defects introduced in the software should be assigned priority levels which will help in investigating bug reports easily by their priority.
There are considerable amount of resources that are involved in software improvement. The task of assigning priority to reported bugs is by and large a manual one and accrues the cost of billions of dollars every year. Still, many software systems are released with defects due to lack of testing. Therefore, to improve and address upcoming versions, developers need to get feedback on defects that are present in released systems [1]. Thus, depending on the complexity of the software system, developers allow end users to report defects using bug reporting systems such as Bugzilla, Jira et al. It is a standard practice in both open source software development and closed source software development. Bug tracking systems help in continuous monitoring and reporting of bugs [2]. Machine learning techniques are just the right kind of algorithms that make the task of bug prediction and classification straightforward and efficient. Further, to enhance the efficiency of a bug classifier by using feature extraction techniques that will help in supplying the refined information to the machine which is achieved by using text mining algorithms. Text mining algorithms extract keywords from bug reports by picking up high importance words- these processed words along the original bug reports are used to improve the accuracy of a classifier. Our approach predicts the priority level of bug reports from Bugzilla using text classification
method considering several factors/fields that affect the priority of a bug report. These factors are as follows [3]:
• Temporal: other bug reports that are reported at the same time as the bug report.
• Textual: the textual component of the bug report.
• Author: the author of the bug report.
• Related-report: related bug reports.
• Severity: the estimated severity of the bug.
• Product: the affected product in which the bug is invoked.
2. TEXT PRE-PROCESSING
The standard text pre-processing techniques are specifically used to extract the textual content of data into a set of features that are meaningful. These methods include tokenization, stop word removal, and stemming [4].
A. Tokenization: Tokenization is a process that is used to
separate tokens from a textual document by splitting the text into tokens.
B. Stop-Word Removal: Stop words are removed as they
might reduce the effectiveness of machine learning or information retrieval solutions due to their skewed distributions. There is a significant portion of such stop words including “am”, “are”, “is”, “I”, “he”, etc. These stop words should be removed from the set of tokens that are extracted through tokenization (in the previous steps).
C. Stemming: There are many forms of words; in English,
grammatical rules dictate if a root word appears in singular, plural, present tense, past tense, future tense, or many other forms. Words beginning from the same root word yet are not identical with one another are semantically related, for example, in “write”, “writes” or “writing”. Stemming tries its best to reduce a word to its ground level form. For example, “usability”, “usable”, and “use” would all be reduced to “use”. In this work, Porter’s stemming algorithm [5] is used to process the text and is used many prior studies, for instance, [5] , [6] and [7].
3. LITERATURE SURVEY
Till date, there are very few studies on finding such relationship taking the severity of faults into account. The most popular study in the field of fault severity has been done by the authors [8]. They analysed the performance of models at three levels of severity such as high, medium and low severity faults and concluded that the model predicted at high severity faults is less accurate as compared to the models predicted at other severities. It was summarised that the models predicted using DT and ANN methods are better than the models predicted using LR method. Also, it was seen that the metrics such as CBO, WMC, RFC and SLOC are necessary for the faults at all the severity levels. Support Vector Machine (SVM), cascade correlation network, group method of data handling polynomial method, gene expression programming) [9]. AUC calculated the performance from a ROC Curve. Many researchers use ROC curves for the modules for predicting fault-prone or not fault-prone [10].
The work was done [10] is similar to the work of Menzies [11]. Permata have also developed a model for the assignment of the bug severity level. They have used the same pre-processing tasks (tokenization, stop words removal and stemming) and feature selection method, but, have used SVM as their classification method.
In this study, [12] the authors automatically assign priorities to Firefox crash reports in Mozilla Socorro server based on the frequency and entropy of the crashes. When Firefox fails, crash reports are automatically submitted to the Socorro server, and it contains a stack trace and relevant information about the environment to help developers debug the crash. In the study, the authors investigated bug reports that are manually submitted by users.These reports are different from a crash report, a bug report contains natural language descriptions of a bug and might not include any stack trace or environment information. They employ a text mining based solution to assign priorities to bug reports. Some studies [13] group bugs into different categories. Huang et al. propose a text mining solution to categorising bug reports as either capability, security, performance, reliability, requirement, or usability related bugs.
In the year 2012, [14] Tian also predicted the severity of bug reports by using the nearest neighbor approach to predict fine-grained bug report labels. Different from work by Menzies which analyses a collection of bug reports in NASA, Tian applies the solution to a larger collection of bug reports consisting of more than 65,000 Bugzilla reports. Severity levels are given by users, while priority levels are assigned by developers. Severity levels relate to the impact of the bug on the software system as understood by users and priority levels relate to the importance bug reports that are received [15]. Tian [14] used automatically detects and analyse bug reports, which had been reported in the past seven days with severity levels, and taking these reports in consideration severity levels to newly reported bug reports are assigned. They determine the similarity between used duplicate bug reports with relative information and features. This similarity in information helps in assigning the severity levels accurately and quickly.
In the area of similar bugs, a study is presented by [16]. Some research in the field of bug triaging support by
recommending appropriate developers to fix a particular bug. Levenberg-Marquardt (LM) algorithm based on neural network predicts the software defects at an early stage of the SDLC is described by [17]. They use data available on the PROMISE repository of empirical software engineering dataset. The dataset uses the CK (Chidamber and Kemerer) [18] metrics. The study concludes that the Levenberg-Marquardt (LM) neural network based algorithm gives better accuracy (88.09%) as compared to every polynomial based neural networks (pF-NNs), linear function-based neural network (lf-NN) and quadratic function- function-based neural network (qf-NN) respectively. A defect prediction model using data mining. Gayathri [19] worked on an enhanced Multilayer Perceptron, Neural Network technique are proposed, in which comparative analysis of modelling of defect proneness predictions using a dataset of different metrics from NASA MDP (Metrics Data Program) was performed.
CART algorithm and Bayesian logistic regression. Kapila & Satwinder, in their study, use Bayesian inference with six individual software metrics for early prediction of the software fault. They use Bayesian inference model to identify a posterior probability of fault occurrence [20]. In [21] an approach is described for static reliability modelling, and for modelling of software reliability from software complexity regarding the predictive quality and the quality of fit. The performance is compared with more traditional regression modelling techniques.The work concluded that the neural network model is superior as compared to traditional regression-based techniques and had a less standard error.
Other tasks of Tian [14] presented an automated approach with the help of machine learning in suggesting a priority level by information in bug reports. They consider multifactor temporal, textual, author, related reports, product and severity, as potential factors, which affect the priority level of reported bug reports. They use these factors as features to train a model with the help of a classification algorithm (thresholding and linear regression), which can perform well in ordinal class labels and imbalanced data. They conducted their experiment on more than 100,000 reports collected from Eclipse. This experiment shows an improvement of 58.61% regarding average F-measure by outperforming baseline approach. [22] Extended their previous work by using extracted features to train a discriminative model via a new classification algorithm (linear regression) and their framework named DRONE. The new work provides a way to handle ordinal class labels and imbalanced data. They managed to improve their work on 100,000 bug reports from Eclipse regarding F-measure by 209%, which outperform baseline approach.
the similarities and differences. They were able to achieve an improvement of 6.32% in duplicate bug report detection even without considering context-based features.
4. RESEARCH METHODOLOGY
Neural Network MLP (Multilayer Perceptron)
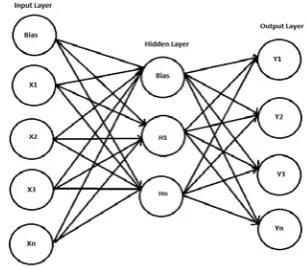
[image:3.595.84.238.303.438.2]A neural network consists of a pool of simple processing units which communicate by sending signals to each other over a large number of weighted connections. Each unit performs a relatively simple job: receive input from neighbors or external sources and use this to compute an output signal which is propagated to other units. Apart from processing, a second task is the adjustment of the weights. The system is inherently parallel in the sense that many units can carry out their computations at the same time. Within neural systems, it is useful to distinguish three types of units: input units which receive data from outside the neural network, output units which send data out of neural network, and hidden units whose inputs and output signals remain within the neural network.
Fig. 1: General Architecture of Neural Network
The figure shows general architecture of neural network with one input, hidden and an output layer.
Mathematically,
Netk = W1kX1 + W2kX2 + ….. WmkXm + b Sigmoid Activation Function:
k
The backpropagation algorithm focuses on the minimum error function in weight space. The error function is minimised by the combination ofweights that are solutions of the learning problem. The activation function is used in perceptrons, because the composite function produced by interconnected perceptrons is discontinuous, and therefore the error function too. One of the most popular activation functions for backpropagation networks is the sigmoid, defined by the expression
Sc(x) =
The constant c can be selected arbitrarily and its reciprocal 1/c know as the temperature parameter in stochastic neural networks. The shape of the sigmoid changes according to the value of c, as can be seen in Figure 2.
Fig. 2 Three Sigmoids for c=1, c=2, c=3
The graph shows the shape of the sigmoid for c = 1, c = 2 and c = 3. A highervalue of c bring the shape of the sigmoid closer to that of the step function, and when c! 1 the sigmoid converges to a step function at the origin.
Naïve Bayes Classifier
Naïve Bayes classifier is a simple probabilistic classifier based on applying Bayes' theorem (from Bayesian statistics) with strong (naive) independence assumptions. A more descriptive term for the underlying probability model would be "independent feature model". In simple terms, a Naïve Bayes classifier assumes that the presence (or absence) of a particular feature of a class is unrelated to the presence (or absence) of any other feature [28]. Depending on the precise nature of the probability model, Naïve Bayes classifiers can be trained very efficiently in a supervised learning setting. In many practical applications, parameter estimation for Naïve Bayes models uses the method of maximum likelihood; in other words, one can work with the Naïve Bayes model without believing in Bayesian probability or using any Bayesian methods [29].
5. EVALUATION MEASURES
Precision, recall, and F-measure, which are commonly used to measure the accuracy of classification algorithms, are used to evaluate the effectiveness of MLP and Naïve Bayes algorithms. In this work, precision, recall, and F-measure are used to evaluate the results for each of the priority levels. The same measures are used in the experiments of Menzies and Marcus to evaluate the results of Severis [11]. Mathematically, precision, recall, and F-measure can be represented as below:
1. Precision = TP \ FP+TP 2. Recall = TP \ TP + FN
3. F-measure = 2 * Precision * Recall \ Precision + Recall
Validation Method Used
In this section, for all the versions, both the algorithms are tested by performing 10-fold cross-validation tests with 10 repetitions, which means 100 runs for each combination. The process for cross-validation is chosen for this work because it is a standard that guarantees a stratified sampling of the dataset [24], [25] and reduces overfitting [26]. The performance values such as precision, recall, F-measure, area under ROC are produced with each run.
6. DATA COLLECTION
Eclipse projects focus on building extensible frameworks, tools and runtimes for building and managing software throughout its lifetime. It has many products and components. The versions that are selected for this work are 2.0, 2.1, 3.0, 3.1, and 3.2. There are five main products of Eclipse from which only three are selected for data collection process, namely JDT, PDE and Platform. The Bugzilla database contains all errors (bugs) that have been found in the lifetime of the Eclipse project with the detailed information that includes the release number, bug severity, summary, long description, priority, status, changed the date, reported date, the name of the reporter, etc.
7. RESULTS AND DISCUSSIONS
In this section, the results of various experiments carried out during the research are listed and discussed. The listed experiments were performed with the objective of
classifying the priorities of bugs using MLP and Naïve Bayes. The tests have been performed on five versions of Eclipse project viz 2.0, 2.1, 3.0, 3.1, 3.2.
Table 1: Results of MLP and Naïve Bayes for 10-fold cross-validation
Versions Algorithms Priority Precisi on
Recall F-measure ROC Algorithm Priori
ty
Precisio n
Recall F-measure ROC
2.0 MLP
P1 0.743 0.491 0.591 0.895
Naïve Bayes
P1 0.743 0.491 0.591 0.895
P2 0.742 0.641 0.688 0.911 P2 0.742 0.641 0.688 0.911
P3 0.944 0.981 0.962 0.986 P3 0.944 0.981 0.962 0.986
P4 0.523 0.246 0.335 0.876 P4 0.523 0.246 0.335 0.876
P5 0.600 0.851 0.703 0.924 P5 0.600 0.851 0.703 0.924
2.1 MLP
P1 0.200 0.033 0.056 0.597
Naïve Bayes
P1 0.200 0.033 0.056 0.597
P2 0.725 0.458 0.561 0.809 P2 0.725 0.458 0.561 0.809
P3 0.780 0.933 0.849 0.844 P3 0.780 0.933 0.849 0.844
P4 0.000 0.000 0.000 0.514 P4 0.000 0.000 0.000 0.514
P5 0.015 0.015 0.023 0.595 P5 0.015 0.015 0.023 0.595
3.0 MLP
P1 0.382 0.153 0.219 0.807
Naïve Bayes
P1 0.382 0.153 0.219 0.807
P2 0.534 0.482 0.507 0.785 P2 0.534 0.482 0.507 0.785
P3 0.876 0.913 0.894 0.913 P3 0.876 0.913 0.894 0.913
P4 0.333 0.707 0.453 0.830 P4 0.333 0.707 0.453 0.830
P5 0.000 0.000 0.000 0.868 P5 0.000 0.000 0.000 0.868
3.1 MLP
P1 0.000 0.000 0.000 0.742
Naïve Bayes
P1 0.000 0.000 0.000 0.742
P2 0.613 0.795 0.692 0.860 P2 0.613 0.795 0.692 0.860
P3 0.916 0.969 0.942 0.948 P3 0.916 0.969 0.942 0.948
P4 0.188 0.053 0.082 0.720 P4 0.188 0.053 0.082 0.720
P5 0.455 0.247 0.320 0.789 P5 0.455 0.247 0.320 0.789
3.2 MLP
P1 0.736 0.804 0.768 0.907
Naïve Bayes
P1 0.736 0.804 0.768 0.907
P2 0.692 0.686 0.689 0.809 P2 0.692 0.686 0.689 0.809
P3 0.872 0.895 0.883 0.951 P3 0.872 0.895 0.883 0.951
P4 0.000 0.000 0.000 0.515 P4 0.000 0.000 0.000 0.515
It can be easily inferred from the above table that the model performs efficiently in classifying the priority P3. Priority P3 is the most abundant type of priority that has been found in the bug reports. The classifier also performs best in classifying P3 with an average precision of about 79 percent and a recall of about 80 percent (in Eclipse 2.0). The MLP based model is also performing efficiently in performing the classification of different priorities with ROC varying around 87.6 percent to 98.6 percent. The ROC values in this range denote good to excellent perceptiveness.
It can be easily inferred from the above table that the model performs efficiently in classifying the priority P3 and P5. The classifier also performs best in classifying P3 with an average precision of about 82.7 percent and a recall of about 80.9 percent (in Eclipse 2.0) which is 1.5 to 3 percent better as compared to MLP. The Naïve Bayes based model is also performing efficiently in performing the classification of different priorities with ROC varying around 89 percent to 98 percent. The ROC values in this range denote good to excellent perceptiveness. Therefore, it can be concluded that the results of both the algorithms are efficient for predicting bug priorities.
8. CONCLUSION AND FUTURE WORK
Bug reports of three components of Eclipse are chosen for this research, four main processes performed in experiments are: dataset acquisition, pre-processing, feature selection and classification. Then classification is done using MLP and Naïve Bayes and basis of precision and recall their performance is compared. The prediction models are developed with the 10-fold cross-validation. It was evident from the results that the model has performed very well in predicting the priorities.
The research used only five versions and three products of Eclipse project for bug priority prediction. Therefore in future, other products and versions of Eclipse, Mozilla et al may be used and cross component could be applied by creating a global dictionary of Eclipse.
9. REFERENCES
1. A Lamkanfi, . S. Demeyer , Q. D. Soetens and T. Verdonck, "Comparing Mining Algorithms for Predicting the Severity of a Reported Bug," in 15th European Conference on Software Maintenance and Reengineering (CSMR), 2011, Oldenburg, Germany, 2011.
2. N. Serrano and . I. Ciordia, "Bugzilla, ITracker, and Other Bug Trackers," IEEE Software, pp. 11-13, March\April 2005.
3. Y. Tian, D. Lo and C. Sun, "DRONE: Predicting Priority of Reported Bugs by Multi-Factor Analysis," in 2013 IEEE International Conference on Software Maintenance, 2013. 4. J. Kanwal and O. Maqbool, "Bug prioritization to facilitate
bug report triage," Journal of Computer Science and Technology, vol. 27, no. 2, pp. 397-412, March 2012. 5. M. Porter, "An Algorithm for Suffix Stripping, Program,"
Program, vol. 14, no. 3, pp. 130-137, 1980.
6. Lamkanfi, S. Demeyer, E. Giger and B. Goethals,
"Predicting the Severity of a Reported Bug," in Mining Software Repositories (MSR), 2010 7th IEEE Working Conference on, Cape Town, South Africa, 2010.
7. X. Wang, L. Zhang, T. Xie, J. Anvik and J. Sun, "An
Approach to Detecting Duplicate Bug Reports Using Natural Language and Execution Information.," in Software Engineering, 2008. ICSE '08. ACM/IEEE 30th International Conference on, Leipzig, Germany, 2008.
8. C. Sun, . D. Lo, S.-C. Khoo and J. Jiang, "Towards more accurate retrieval of duplicate bug reports," in Automated Software Engineering (ASE), 2011 26th IEEE/ACM International Conference on, Lawrence, KS, USA, 2011. 9. Y. Singh, A. Kaur and R. Malhotra, "Empirical validation of
models," Software Quality Journal, vol. 18, no. 3, pp. 3-35, March 2010.
10. . I. G. Permata and Sari, "An Attribute Selection For Severity Level Determination According To The Support Vector Machine Classification Result," in 1st International Conference on Information Systems For Business Competitiveness (ICISBC) 2011, 2011.
11. T. Menzies and A. Marcus, "Automated Severity Assessment of Software Defect Reports," in Proceedings of the 24th IEEE International Conference on Software Maintenance (ICSM'08), Beijing, China, 2008.
12. F. Khomh, . B. Chan, Y. Zou and . A. . E. Hassan, "An Entropy Evaluation Approach for Triaging Field Crashes: A Case Study of Mozilla Firefox," in Reverse Engineering (WCRE), 2011 18th Working Conference on, Limerick, Ireland, 2011.
13. L. Huang, V. Ng, I. Persing, M. Chen, Z. Li, R. Geng and J. Tian, "AutoODC: Automated generation of orthogonal defect classifications," Automated Software Engineering, vol. 22, no. 1, p. 3–46, March 2015.
14. . Y. Tian, D. Lo and C. Sun, "Information Retrieval Based Nearest Neighbor Classification for Fine-Grained Bug Severity Prediction," in Reverse Engineering (WCRE), 2012 19th Working Conference on, Kingston, ON, Canada, 2012. 15. Eclipse, "http://wiki.eclipse.org/Bug Reporting FAQ#What
is the difference between Severity and Priority.3F," 2012. [Online].
16. H. Hosseini, . R. Nguyen and M. W. Godfrey, "A Market-Based Bug Allocation Mechanism Using Predictive Bug Lifetimes," in Software Maintenance and Reengineering (CSMR), 2012 16th European Conference on, Szeged, Hungary, 2012.
17. G. . D. Boetticher, "Applying Machine Learners to GUI Specifications in Formulating Early Life Cycle Project
Estimations," in Software Engineering with Computational Intelligence, Springer, 2003, pp. 1-16.
18. S. R. Chidamber and C. F. Kemerer, "A Metrics Suite for Object Oriented Design," IEEE Transactions on Software Engineering, vol. 20, no. 6, pp. 476-493, June 1994.
19. M. Gayathri and A. Sudha, "Software defect prediction system using multilayer perceptron neural network with data mining," International Journal of Recent Technology and Engineering, vol. 3, no. 2, pp. 54-59, May 2014.
20. H. Kapila and S. Singh, "Analysis of CK Metrics to Predict Software Fault-Proneness using Bayesian Inference," International Journal of Computer Applications, vol. 74, no. 2, July 2013.
21. N. Katiyar and R. Singh, "Prediction of Software
Development Faults Using Neural Network," VSRD-IJCSIT, vol. 1, no. 8, pp. 556-566, 2011.
22. Y. Tian, D. Lo, X. Xia and C. Sun, "Automated prediction of bug report priority using multi-factor analysis," Empirical Software Engineering, vol. 20, no. 5, pp. 1354-1383, 2014. 23. Lazar, S. Ritchey and B. Sharif, "Improving the Accuracy of
Duplicate Bug Report Detection Using Textual Similarity Measures," in 11th Working Conference on Mining Software Repositories, Hyderabad, India, 2014.
24. Y. Bengio and Y. Grandvalet, "No unbiased estimator of the variance of k-fold cross-validation," The Journal of Machine Learning Research, vol. 5, pp. 1089-1105, 2004.
25. P. Cohen and D. Jensen, "Overfitting explained," in Preliminary Papers of the Sixth International Workshop on Artificial Intelligence and Statistics, 1997.
26. M. Stone, "Cross-Validatory Choice and Assessment of Statistical Predictions," Journal of the Royal Statistical Society,Ser B, vol. 36, no. 2, pp. 111-147, 1974.