1 Nicola W. Burton, PhD, Michele Haynes, PhD, Jannique GZ van Uffelen, PhD, Wendy J. Brown, PhD, Gavin Turrell, PhD
From the School of Human Movement Studies (Burton, Brown, van Uffelen), The Institute for Social Science Research (Haynes), The University of Queensland, St Lucia Brisbane, the School of Public Health (Turrell), Queensland University of Technology Public Health, Kelvin Grove Brisbane, Queensland, the School of Primary Health Care (van Uffelen), Monash University, Notting Hill, Victoria, Australia.
Corresponding Author: Nicola W Burton, The University of Queensland School of Human Movement Studies, St Lucia, Brisbane, Queensland, Australia, 4072.
Background: To develop evidence based approaches for reducing sedentary behavior, there is a need to identify the specific settings where prolonged sitting occurs, associated factors, and variations.
Purpose: To examine the sociodemographic and health factors associated with mid-aged adults’ sitting time in three contexts, and variations between week and weekend days.
Methods: A mail survey was sent to 17,000 adults (aged 40-65 years) in 2007; 11,037 responses were received (68.5%); and 7,719 were analyzed in 2010. Respondents indicated time spent sitting on a usual week day and weekend day for watching television, general leisure, and home computer use. Multivariate linear mixed models with area-level random intercepts were used to examine (i) associations between sociodemographic and health variables and sitting time, and (ii) interaction effects between week/weekend day for each of sex, age, education, and employment status, on sitting time.
Results: For each context, longer sitting times were reported by those single and living alone, and those whose health restricted activity. For watching television, longer sitting times were reported by men; smokers; and those with high school or lower education, not in paid employment, in poor health, and with BMI >25 kg/m2. For general leisure, longer sitting times were reported by women, smokers, and those not in full time employment. For home computer use, longer sitting times were reported by men; and those aged 40-44 years, with university qualifications; in the mid income range; and with BMI >30 kg/m2. Sitting times tended to be longer on weekend than week days, although the extent of this differed among sociodemographic groups.
Background
Emerging evidence suggests that prolonged sitting time may be associated with an increased risk of adverse health outcomes such obesity, diabetes, cardiovascular risk biomarkers, and mortality.1-4 To develop evidence based approaches for reducing sedentary behavior, there is a need to identify the specific settings where prolonged sitting occurs, associated factors, and variations.5
There is data to suggest that those adults with high levels of sedentary behavior are more likely to be men;6-9 and older;10, 11 to have low levels of income7, 10, 12 and education;1, 2, 6, 10-12 and to have other health risks such as overweight or obesity,1, 10-15 a health condition,10 poor health, and cigarette smoking.1, 2, 12 Sociodemographic patterns of sedentary behavior may, however, vary by setting. Australian data indicate that men report longer sitting times for watching television, relaxing, and computer use than women, who in turn report longer sitting times for talking on the telephone.8 Older adults reported longer sitting times for watching television, relaxing and reading than younger adults, who in turn reported longer sitting times for socializing and using a computer.8 Those with <12 years of education reported longer sitting times for watching television and relaxing than those with university level education, who in turn reported longer sitting times for computer use.8
a positive association between working hours and overall sitting time13 and week day sitting time,7 and no association between employment hours and weekend day sitting time.16 As the sitting time measure in these studies combined both occupational and leisure time sedentary behavior, it is likely that the increased overall and week day sitting time predominantly reflects occupational behavior.
This study examined the sociodemographic and health factors associated with prolonged sitting time among mid-aged adults. It extends previous research by examining three distinct contexts (watching television, general leisure, and home computer use) and by exploring interaction effects between week/weekend day with each of age, sex, education, and employment status on sitting time.
Methods
Data were sourced from the 2007 HABITAT (How Areas in Brisbane Influence healTh and AcTivity) study, which was awarded ethical clearance by the QUT Human Research Ethics Committee (Ref. 3967H).
Study Design, Setting and Data Collection
personalized mail, a thank you/reminder notice, resending to non-respondents, and a final letter to non respondents.18
Measures
Respondents indicated the time spent sitting on each of a usual week day and weekend day (a) while watching television (including DVDs, videos, and video games) (b) while using a computer at home, and (c) in leisure time, NOT including watching television and using a computer (e.g., hobbies, reading, dining out). This measure has been shown to have acceptable levels of reliability and validity with mid-aged adults.19 Data were converted to minutes/day for each context. To minimize potential error associated with over-reporting, responses >480 minutes/day for each context (n=491, 3.1% of cases) were excluded, as the sum of these three contexts is greater than one day.
Questionnaire items were used to obtain data on sex, date of birth, gross annual household income (eleven categories), country of birth (Australia/other), employment status (nine
categories), household composition, educational qualifications (nine categories), whether they had a motor vehicle available for personal use (three categories), general health, cigarette smoking status, height and weight (to derive BMI), and to what extent health restricted physical activity.
Analyses
variation. Interaction terms were included to examine the effects of interactions between week/weekend day and each of sex, age, education, and employment status on sitting time. The regression coefficients can be interpreted as minutes/day sitting time.
Results
Participants
From 17,000 people originally sampled, 869 were ineligible (e.g., deceased, living overseas), and 11,037 returned surveys with data (68.5%). Fewer than 5% of data were missing on any of the study variables with the exception of income, which had 15% missing. Chi square tests of independence were used to assess whether the proportion of missing data in the respondent sample differed across categories for each of the interaction variables: sex (χ21=43.17,
p<0.001), age (χ24=36.28, p<0.001), employment status (χ22=136.69, p<0.001), education
(χ22=109.67, p<0.001); and income (χ24=76.19, p<0.001). There were more missing data
among females than males, those in the older group (60-64 years), those not in paid
employment, those with less than 12 years of education, and those in the lower income range. To create a balanced dataset for the purpose of analyses, cases were excluded if there were missing data on either week day or weekend day sitting times for watching television
Sitting Time
The average sitting time (minutes/day) on each of a usual week day and a weekend day, for each sitting context by level of the study variables, is presented in Appendix A
(www.ajpmonline.org). Sitting times ranged from 132-222 minutes/day for watching
television, 72-144 minutes/day for general leisure, and 55-85 minutes/day for home computer use.
Factors Associated with Time Spent Sitting to Watch Television
The regression results are presented in Table 2. The model accounted for 62% of the variation between people, while variation due to CCD was small (0.4%). Variables that had significant main effects only were country of birth, household composition, smoking status, general health, physical activity restrictions, and BMI. Shorter sitting times for watching television were reported by those born outside Australia than those born in Australia; among single parents and those married with children than those single and living alone; and among those who reported never smoking than those who currently smoked. There was an inverse
relationship with health. Only those whose health restricted physical activity all of the time reported longer times than those who reported no restrictions. Those with BMI 25-<30 kg/m2 or >30 kg/m2 reported longer times than those with BMI 18.5-<25 kg/m2.
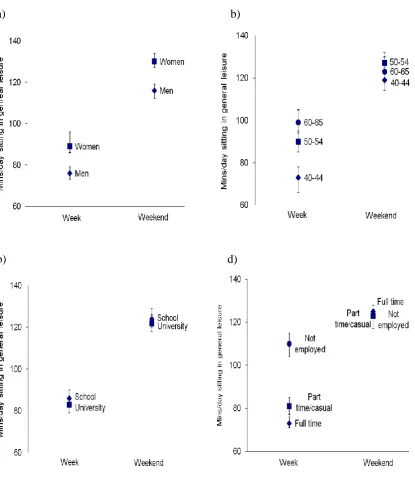
difference, than those aged 40-44 years. Overall, there was an inverse association between sitting time for watching television and education; shorter times were reported by those with a certificate/diploma or university education than those with high school or lower education, and the week/weekend day difference was less evident for those with a university degree than those with high school or lower education. Overall, longer sitting times were reported among those not in paid employment than those in full time employment, and the week/weekend day difference was less evident for those in part time employment and negligible for those not in paid employment than those in full time employment.
Factors Associated with Time Spent Sitting for General Leisure
The model accounted for 59% of the variation between people, while variation due to CCD was small (0.2%). Variables that had significant main effects only were income, country of birth, physical activity restrictions, smoking status, and household composition. Longer times sitting for general leisure were reported by those in the highest income category than the lowest; those born outside Australia than those born in Australia; and those whose health restricted physical activity all of the time than those with no restriction. Shorter times were reported by those who had never smoked cigarettes than those who currently smoked; and single parents, those married without children, and those married with children than single adults living alone.
women than for men. The week/weekend day difference was less evident for those aged 50-54 years or 60-65 years than those aged 40-44 years, and greater for those with university
qualifications than those with high school or lower education. Overall there was an inverse association with employment status; longer sitting times were reported by those in part time employment or those not in paid employment than those in full time employment, and the week/weekend day difference was less evident for those in part time employment, and minimal for those not in paid employment, than those in full time employment.
Factors Associated with Time Spent Sitting for Home Computer Use
The model accounted for 64% of the variation between people, while variation due to CCD was small (0.3%). Variables that had significant main effects only were sex, age, household composition, motor vehicle access, country of birth, income, BMI, education, and activity restrictions. Shorter times sitting for home computer use were reported by women than men; the two older age groups of 55-59 years and 60-65 years than the youngest age group of 40-44 years; those married with children than single adults living alone; and those without access to a motor vehicle access/don’t drive than those with access. Longer times were reported by those born outside Australia than in Australia; in the mid income group (AUD$52
000-72,799) than the lowest group; and those with BMI >30 than those with BMI 18.5-<25 kg/m2. There was a graded positive association with education; increasingly longer times were reported by those with a certificate/diplomaor university education than those with high school or lower education. There was a graded inverse association between sitting time and physical activity restriction.
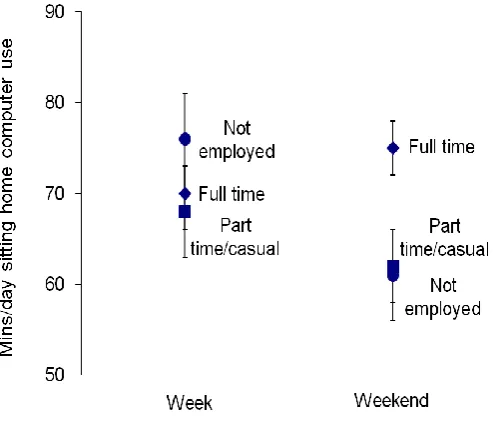
was a significant interaction between week/weekend day only for employment status (see Figure 3). Overall, there was a graded inverse association between sitting time and employment status, with longer sitting times on weekend days among those in full time employment, and shorter times among those in part time employment and those not in paid employment.
Discussion
For the three contexts, longer sitting times were consistently reported by those single and living alone. These people may find it easier to spend time in sedentary behaviors than to engage in more active pursuits. This raises an interesting parallel between sedentary and solitary activities. The concept of sedentary-solitary leisure has elsewhere been considered in the context of late adulthood20 and disability,21 and could also be considered for otherwise healthy mid-aged adults. Our previous research with mid-aged men highlighted difficulties in identifying peer-based options for physical activity.22
having a health condition such as diabetes, hypertension, or heart disease.10 These conditions are however, not necessarily associated with activity restrictions or a perception of poor health, as was assessed in our study.
Those reporting longer sitting times to watch television were men, current smokers, born in Australia, with high school or lower education, not in paid employment, not in excellent health, or with BMI >25kg/m2. This is consistent with other studies.6, 8, 9 Unlike other research however, there was not an overall significant association with age10, 11 or income.10, 12 As other studies included adults older than 65 years, it may be that the age range in this study (40-65 years) was insufficient to evidence age differences. There was however, a significant interaction indicating that the difference between week/weekend day sitting time in mid-aged adults aged 55-64 years was less evident than for those aged 40-44 years, which was because of longer sitting times on a week day. Clark et al. noted that adjustment for employment status can affect the association between age and time watching television, particularly among men, as older adults are less likely to be in full time employment.6 Those researchers also reported that after multivariable adjustment there was no significant association between household income and time spent watching television.6.
for more active pursuits among those aged 55-64 years, and more discretionary time during the week for those not in full time employment.
As was the case for watching television, longer sitting times for general leisure were reported by current smokers, those not in full time employment, and on weekend days (also
particularly for those in full time employment and less so for those in the older age groups). Unlike watching television, however, those reporting longer sitting times for general leisure were women, born outside Australia, and in the high income group; and the week/weekend difference was more evident among women than men, and among those with university education than those with high school or lower education. The longer sitting times on weekend days among women may reflect a reduced level of family/domestic demands (such as preparing children for school), or a preference for sedentary pursuits other than watching television. Salmon et al. however reported that women spent more time talking on the telephone than men; but no sex differences in time spent reading, sitting socializing, in hobbies; and that men spent more time relaxing/resting than women.8 They also reported that enjoyment of sedentary behavior and the barrier of family commitments contributed
significantly to explaining sedentary behavior;8 these factors may be more salient to women than men.
Overall, those reporting longer sitting times for home computer use were men, aged 40-44 years, with university education, or in the mid income range, which may reflect the important role of computers among these groups - for work, leisure (e.g., games) or gathering
difference between those with university qualifications and those with high school or lower education as in our study. Consistent with Vandelanotte et al.15 those with BMI >30 kg/m2 reported longer sitting times for home computer use, which may reflect a disinclination for more active pursuits. Those in full time employment reported longer sitting times for home computer use on a weekend day than a week day, while those in part time employment and those not in paid employment reported shorter times. This may reflect those in full time employment doing “take home” work on weekends, or a disinclination to do additional computer work on week days after being at work.
Methodological Considerations
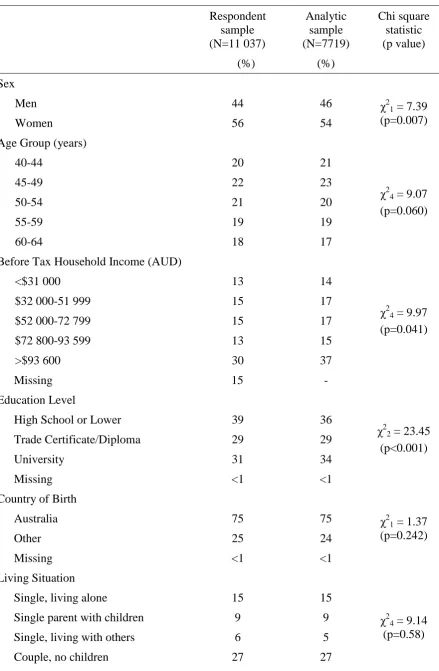
A comparison of the HABITAT respondent sample with census data indicated a modest under-representation of men, blue collar workers, those with high school or lower education, those not in the workforce, and those living in disadvantaged areas.23 As those with low levels of income or education are also more likely to report higher levels of sedentary behavior,1, 2, 6,
7, 10-12
of these contexts; those associations that were significant were at the highest level of activity, and often positive.24
Conclusions
The results of this study suggest that there is a need to promote active leisure options for those single and living alone, and, where possible, those whose physical activity is restricted
because of their health. Interventions to reduce sedentary behavior could focus on sitting time (i) for watching television, in particular among men, or those not in paid employment, in poor health, or with BMI >25 kg/m2 (ii) on weekend days, in particular among those in full time employment, men for television/home computer use, and women for general leisure, and, (iii) among those not in paid employment (particularly on week days). A novel context for
Acknowledgments
The HABITAT study was supported by project grants from the (Australian) National Health and Medical Research Council (NHMRC) (ID 339718, 497236), and by data from Brisbane City Council. Professor Billie-Giles Corti, Professor Brian Oldenburg, and Dr Katrina Giskes are co-investigators on HABITAT and contributed to the study design and protocols. We acknowledge Mr Martin O’Flaherty for his assistance with data coding and cleaning, and Ms Robyn Baguley and Ms Sophie Miller for their work as Project Manager. At the time of this study, NB was supported by a Heart Foundation Research Fellowship (PH08B3905) and an NHMRC Program Grant (569663). At the time of preparing this work, NB and JVU were supported by an NHMRC Program Grant (569940), JvU was affiliated with The University of Queensland, and GT was supported by a NHMRC Senior Research Fellowship (390109).
References
1. Dunstan DW, , Barr ELM, Healy GN, Salmon J, Shaw JE, Balkau B, et al. Television viewing time and mortality: The Australian Diabetes, Obesity and Lifestyle Study (AusDiab). Circulation. 2010;121(3):384-91.
2. Hu FB, Li TY, Colditz GA, Willett WC, Manson JE. Television watching and other sedentary behaviors in relation to risk of obesity and type 2 diabetes mellitus in women. JAMA. 2003;289(14):1785-91.
3. van Uffelen J, Wong J, Chau J, van der Ploeg H, Riphagen I, Gilson N, et al. Occupational sitting and health risks: A systematic review. Am J Prev Med. 2010;39(4):379-88.
4. Thorp AA, Owen N, Neuhaus M, Dunstan DW. Sedentary behaviors and subsequent health outcomes in adults: A systematic review of longitudinal studies, 1996–2011. Am J Prev Med. 2011;41(2):207-15.
5. Owen N, Sugiyama T, Eakin EE, Gardiner PA, Tremblay MS, Sallis JF. Adults' sedentary behavior: Determinants and interventions. Am J Prev Med. 2011;41(2):189-96.
6. Clark BK, Sugiyama T, Healy GN, Salmon J, Dunstan DW, Shaw JE, et al. Socio-demographic correlates of prolonged television viewing time in Australian men and women: The AusDiab Study. Physical Activity and Health. 2010;7(5):595-601. 7. Proper KI, Cerin E, Brown WJ, Owen N. Sitting time and socioeconomic differences in
overweight and obesity. Int J Obes. 2007;31:169-76.
8. Salmon J, Owen N, Crawford D, Bauman A, Sallis JF. Physical activity and sedentary behavior: A population-based study of barriers, enjoyment, and preference. Health Psychol. 2003;22(2):178-88.
area deprivation: the Scottish Health Survey 2003 J Epidemiol Community Health. 2009;63(9):734-40.
10. Bowman S. Television viewing characteristics of adults: correlations to eating practices and overweight and health status. Prev Chronic Dis. 2006;3(2):A38.
11. Salmon J, Bauman A, Crawford D, Timperio A, Owen N. The association between
television viewing and overweight among Australian adults participating in varying levels of leisure-time physical activity. Int J Obes Relat Metab Disord. 2000;24(5):600-6.
12. King AC, Goldberg JH, Salmon J, Owen N, Dunstan D, Weber D, et al. Identifying subgroups of US adults at risk for prolonged television viewing to inform program development. Am J Prev Med. 2010;38(1):17-26.
13. Brown WJ, Miller YD, Miller R. Sitting time and work patterns as indicators of overweight and obesity in Australian adults. Int J Obes Relat Metab Disord. 2003;27(11):1340-6.
14. Mummery W, Schofield G, Steele R, Eakin E, Brown W. Occupational sitting time and overweight and obesity in Australian workers. Am J Prev Med. 2005;29(2):91-7.
15. Vandelanotte C, Sugiyama T, Gardiner P, Owen N. Associations of leisure-time internet and computer use with overweight and obesity, physical activity and sedentary behaviors: cross-sectional study. J Med Internet Res. 2010;11(3):E28-E
16. van Uffelen JGZ, Watson MJ, Dobson AJ, Brown WJ. Comparison of self-reported week-day and weekend-week-day sitting time and weekly time use: Results from the Australian Longitudinal Study on Women's Health. International Journal of Behavioural Medicine. 2010;doi 10.1007/s12529-010-9105-x:June 6.
18. Dillman DA. Mail and internet surveys: the tailored design method. 2nd ed. Chichester: Wiley; 2000.
19. Marshall AL, Miller YD, Burton NW, Brown WJ. Measuring total and domain-specific sitting: a study of reliability and validity. Med Sci Sports Exerc. 2010;42(6):1094-102. 20. Lennartsson C, Silverstein M. Does engagement with life enhance survival of elderly
people in Sweden? The role of social and leisure activities. Journal of Gerontology: Social Sciences. 2001;56B(6):S335-42.
21. Jobling A. Life be in it: Lifestyle choices for active leisure. Down Syndrome Research and Practice. 2001;6(3):117-22.
22. Burton NW, Walsh A, Brown WJ. It just doesn't speak to me: Middle-aged men's
reactions to 10,000 steps a day. Health Promotion Journal of Australia. 2008;19(1):52-9. 23. Turrell G, Haynes M, Burton NW, Giles-Corti B, Oldenburg B, Giskes K, et al.
Neighborhood disadvantage and physical activity: Baseline results from the HABITAT multi-level longitudinal study. Ann Epidemiol. 2010;20:171-81.
Figure 1. Plot of significant interaction effects of week/weekend day and (a) sex (b) age (c) education and (d) employment status on time spent sitting to watch television (minutes/day), using observed values.
a) b)
c) d)
Figure 2. Plot of significant interaction effects of week/weekend day with (a) sex (b) age (c) education and (d) employment status on time spent sitting in general leisure (minutes/day), using observed values.
a) b)
b) d)
Table 1: Sociodemographic Characteristics of the Respondent and Analytic Samples. Respondent sample (N=11 037) Analytic sample (N=7719) Chi square statistic (p value) (%) (%) Sex
Men 44 46 χ2
1 = 7.39
(p=0.007)
Women 56 54
Age Group (years)
40-44 20 21
χ2
4 = 9.07
(p=0.060)
45-49 22 23
50-54 21 20
55-59 19 19
60-64 18 17
Before Tax Household Income (AUD)
<$31 000 13 14
χ2
4 = 9.97
(p=0.041)
$32 000-51 999 15 17
$52 000-72 799 15 17
$72 800-93 599 13 15
>$93 600 30 37
Missing 15 -
Education Level
High School or Lower 39 36
χ2
2 = 23.45
(p<0.001)
Trade Certificate/Diploma 29 29
University 31 34
Missing <1 <1
Country of Birth
Australia 75 75 χ2
1 = 1.37
(p=0.242)
Other 25 24
Missing <1 <1
Living Situation
Single, living alone 15 15
χ2
4 = 9.14
(p=0.58)
Single parent with children 9 9
Single, living with others 6 5
Couple with children 42 43
Missing 1 <1
Employment Status
Full time employment 53 56
χ2
2 = 25.51
(p<0.001)
Part time employment 23 23
Not in paid employment 24 21
Missing <1 -
Self-rated Health
Excellent 10 10
χ2
3 = 7.55
(p=0.056)
Very Good 33 35
Good 38 38
Fair/Poor 18 17
Missing 1 <1
Physical Activity Restrictions
None 44 45
χ2
3 = 0.76
(p=0.856)
Little of the Time 29 30
Some of the Time 18 18
Most/All of the Time 7 7
Missing 1 <1
Cigarette Smoking Status
Current Smoker 16 15
χ2
2 = 3.89
(p=0.143)
Ex Smoker 32 33
Non-smoker 52 51
Missing 1 <1
Body Mass Index (kg/m2)
<18.5 1 1
χ2
3 = 0.40
(p=0.94)
18.5 - <25 38 39
25 - <30 35 36
>30 20 21
Missing 5 3
Motor Vehicle Access
Yes (always/sometimes) 94 95 χ2
1 = 10.34
(p=0.007)
No (never/don’t drive) 5 4
24
Watching television General leisure Home computer use
B (95% Confidence interval) B (95% Confidence interval) B (95% Confidence interval) Sex
Men - -
Women -8.62 (-13.38, -3.87)*** 8.75 (4.47, 13.03)*** -17.99 (-22.17, -13.81)***
Age Group (years)
40-44 - - -5.72 (-11.44, -0.01)
45-49 0.85 (-5.65, 7.34) 1.58 (-4.26, 7.43) -5.52 (-11.44, 0.40)
50-54 1.73 (-5.00, 8.46) 4.48 (-1.58, 10.53) -10.32 (-16.55, -4.10)***
55-59 0.43 (-6.63, 7.50) 6.45 (0.08, 12.82) -15.76 (-22.68, -8.84)***
60-64 0.45 (-7.41, 8.31) 8.05 (0.98, 15.12) -5.72 (-11.44, -0.01)
Gross Household Income (AUD)
<$31 000 - - -
$32 000-51 999 -0.90 (-8.33, 6.53) 3.51 (-3.14, 10.17) 5.18 (-1.41, 11.78)
$52 000-72 799 -1.13 (-8.89, 6.64) -1.99 (-8.94, 4.97) 8.77 (1.88, 15.67)*
$72 800-93 599 -6.97 (-15.24, 1.31) 6.27 (-1.15, 13.69) 5.83 (-1.52, 13.18)
>$93 600 -6.64 (-14.41, 1.14) 7.53 (0.56, 14.50)* 6.34 (-0.56, 13.25)
Education Level
High School or Lower - - -
Certificate/Diploma -9.42 (-14.88, -3.97)*** 0.94 (-3.96, 5.84) 11.17 (6.38, 15.96)***
Country of Birth
Australia - - -
Other -7.56 (-12.12, -3.01)*** 5.10 (1.01, 9.20)* 4.58 (053, 8.63)*
Living Situation
Single living alone -
Single parent -17.48 (-25.76, -9.20)*** -9.10 (-16.52, -1.67)* -1.88 (-9.22, 5.45)
Single, living with others -6.44 (-16.23, 3.35) 6.97 (-1.79, 15.74) -3.53 (-12.19, 5.12)
Couple, no children 0.41 (-6.21, 7.03) -7.33 (-13.27, -1.40)* 0.22 (-5.65, 6.10)
Couple with children -17.83 (-24.51, -11.14)*** -21.98 (-27.97, -15.99)*** -8.50 (-14.43, -2.58)** Employment Status
Full time - - -
Part time 1.15 (-4.62, 6.93) 7.92 (2.72, 13.12)** 12.04 (6.96, 17.12)***
Not in paid employment 30.05 (23.56, 36.53)*** 26.48 (20.63, 32.32)*** 22.86 (17.14, 28.58)*** General Health
Excellent - - -
Very Good 9.80 (2.85, 16.74)** 0.19 (-6.04, 6.43) -2.43 (-8.60, 3.74)
Good 20.23 (13.09, 27.38)*** -2.06 (-8.48, 4.36) -5.27 (-11.62, 1.07)
Fair/Poor 23.71 (14.87, 32.55)*** -7.52 (-15.45, 0.41) -5.33 (-13.18, 2.53)
Physical Activity Restrictions
None - - -
Little -0.42 (-5.00, 4.16) 2.40 (-1.71, 6.51) 6.49 (2.41, 10.56)**
Most/All of the Time 15.67 (6.40, 24.94)*** 13.81 (5.52, 22.11)*** 19.87 (1167, 28.07)*** Cigarette Smoking Status
Current Smoker - - -
Ex Smoker -5.87 (-11.98, 0.25) -2.70 (-8.18, 2.78) -1.39 (-6.82, 4.03)
Non-smoker -10.63 (-16.47, -4.78)*** -9.42 (-14.65, -4.18)*** -3.05 (-8.23, 2.13)
Body Mass Index (kg/m2)
<18.5 -7.97 (-25.80, 9.86) -5.54 (-21.60, 10.52) -8.77 (-24.67, 7.13)
18.5 - <25 - - -
25 - <30 8.83 (4.30, 13.35)*** 2.84 (-1.22, 6.91) 1.88 (-2.15, 5.90)
>30 19.24 (13.79, 24.70)*** 2.59 (-2.30, 7.49) 11.58 (6.73, 16.43)***
Motor Vehicle Access
Yes - - -
No 9.55 (-0.40, 19.50) 1.39 (-7.55, 10.33) -13.90 (-22.73, -5.08)**
Week/weekend day 54.51 (48.94, 60.08)*** 44.77 (39.64, 49.89)*** 8.18 (3.48, 12.89)***
Sex interactions
Week/weekend day x male - - -
Week/weekend day x female -9.58 (-13.64, -5.51)*** 11.59 (7.83, 15.35)*** 1.22 (-2.23, 4.68) Age interactions
Week/weekend day x 40-44 - - -
Week/weekend day x 45-49 1.69 (-4.02, 7.40) 1.21 (-4.07, 6.49) 3.19 (-1.66, 8.04)
Week/weekend day x 60-64 -12.53 (-19.01, -6.06)*** -8.04 (-14.04, -2.05)** -3.23 (-8.74, 2.27) Education interactions
Week/weekend day x high school or
lower - - -
Week/weekend day x
trade/certificate -3.83 (-8.59, 0.92) 1.60 (-2.78, 5.99) -1.72 (-5.75, 2.31)
Week/weekend day x university -9.32 (-13.93, -4.72)*** 5.75 (1.49, 10.01)** 0.54 (-3.37, 4.45) Employment status interactions
Week/weekend day x full time - - -
Week/weekend day x part time -12.07 (-17.04)*** -13.67 (-18.27, -9.06)*** -12.18 (-16.40, -7.95)*** Week/weekend day x not employed -25.77 (-31.09, -20.45)*** -34.40 (-39.33, -29.47)*** -20.11 (-24.64, -15.59)***
Constant 145.14 (132.97, 157.33)*** 73.93 (63.03, 84.83)*** 55.77 (45.01, 66.53)***
Rho (person) 0.62 0.59 0.64
Rho (area) 0.004 0.002 0.003
* p<0.05; ** p<0.01; *** p≤0.001
a