i
THE EFFECT OF AGEING ON THE CONTROL OF TOE CLEARANCE DURING WALKING
by
Simon Barrie Taylor
(M.App.Sc. – Biomechanics; B.App.Sc – PE)
School of Sport and Exercise Science,
Faculty of Arts, Education and Human Development, and Institute of Sport, Exercise and Active Living (ISEAL),
Victoria University
Submitted in the total fulfillment of the requirements of the degree of Doctor of Philosophy
iii
Abstract
Increased tripping frequency and the associated risk of falling is an international health problem in older adult populations. The average distance between the toe and the ground surface is approximately 1.3cm at the event where the toe reaches a minimum clearance height during leg swing of walking (Winter 1991, Begg et al. 2007). Little is known about how the lower limbs are controlled and coordinated to perform safe (risk-averse) toe-to-ground clearance. This thesis investigates the kinematic interactions of the lower limbs during unperturbed walking with a specific emphasis on examining the cooperative interactions of the stance and swing limb.
Two groups of 28 female participants with different mean age (25(±6) and 69(±3) yrs) were recruited to walk on a motorised treadmill for a period of ten minutes unperturbed at their self-selected walking speed. Three-dimensional lower limb segment kinematics captured from an OPTOTRAK motion capture system served as the input for a six degree of freedom biomechanical model. To investigate the toe clearance task, the lower limb segment chain was generalised as three cooperative effector systems: a stance limb
effector; a swing limb effector; and the combined effector representing the collective swing and stance effectors. The swing phase of the gait cycle was the primary interest and this was separated into two normalised time regions which centred upon two toe-to-ground
reference states, one at early swing and the second at mid-swing. The behaviour of the effector systems and the component segments of which they span was described using normal distribution statistics, non-linear serial correlation analyses, correlation analysis, and multi-dimensional analyses of covariance. This was performed at each time state within the two swing phase regions.
The results of the thesis reveal age-related control and coordination changes of the toe clearance task. The elderly control the toe clearance task by assigning greater level of control effort to the stance limb. The consequence is an altered representation of the toe clearance task that is dependent on the goals of the stance limb. The young group
iv
Student Declaration
Doctor of Philosophy Declaration
I, Simon Taylor, declare that the PhD Thesis entitled “Control of toe clearance during walking” is no more than 100,000 words in length, including quotes, and exclusive of tables, figures and appendices, bibliography, references and footnotes. This thesis contains no material that has been submitted previously, in whole or in part, for the award of any other academic degree or diploma. All work in this thesis was conducted by me, with the
exception of UCM and DFA software programs in MATLAB that were developed with the collaboration of Victoria University’s research assistant, Barrie Taylor.
v
Dedication
vi
Acknowledgements
Thanks to my two supervisors, Dr Russell Best and Prof. Rezaul Begg, for your
tolerance, support and careful reviews. Thanks for the wise advice during challenging times. You provided many opportunities for me to expand my teaching and research experience and ultimately provided an opportunity for me to realise a career vocation that I love doing.
Dr Daniel Lai
Thanks for your time that you spent discussing with me the deeper insights of my research and opening my eyes to the interesting concepts of coordination and control.
Mr Barrie Taylor
Thanks for all the long hours of Matlab technical support.
Biomechanics team at VU
vii
Table of Contents
Abstract ... iii
Student Declaration ... iv
Dedication ... v
Acknowledgements ... vi
Table of Contents ... vii
List of Tables ... xv
List of Figures ... xvii
Chapter 1 ... 1
1 Introduction ... 1
1.1 Glossary ... 9
Chapter 2 ... 15
2 Literature review ... 15
2.1 Falls, trips and gait in older adults ... 17
2.1.1 Epidemiology and aetiology of falls ... 17
2.1.2 Immediate and long term consequences of falls ... 18
2.1.3 Intrinsic and extrinsic risk factors of falls ... 21
2.1.4 Interventions that show success for improving falls risk ... 23
2.1.5 The gait cycle ... 23
2.1.6 Gait parameters associated with falls ... 25
2.1.7 Summary... 27
2.1.7.1 Plausible parameters of gait specific to tripping risk ... 28
2.2 The context from which toe-swing performance arises ... 29
2.2.1 The-goals of walking ... 29
2.2.1.1 Balance and upright posture ... 31
2.2.1.2 Toe clearance ... 33
2.2.2 Toe trajectory ... 38
2.2.2.1 Redundancy of swing limb and toe trajectory ... 39
2.2.3 Embodiment of the loco-sensorimotor control system ... 41
2.2.3.1 A complex nonlinear structure ... 43
viii
2.2.3.2.1 Limb Biomechanics ... 46
2.2.3.2.2 Altered changes in brain structure and function due to healthy ageing ... 48
2.2.3.2.3 Sensorimotor noise ... 51
2.2.3.2.4 Low level control: spinal cord and short-latency reflexes ... 54
2.2.3.2.5 Mid-high level control: primary motor cortex and long-latency reflexes ... 55
2.2.3.2.6 Central pattern generators and inter-neuronal pathways ... 55
2.2.4 Summary... 57
2.3 Theories of how coordinated and controlled movement trajectories emerge from the sensorimotor system ... 58
2.3.1 The problem of redundancy in the loco-sensorimotor system ... 58
2.3.1.1 Hierarchical control verses self-organisation ... 59
2.3.1.1.1 Direct hierarchical control ... 59
2.3.1.1.2 Self-organisation and dynamic systems theory ... 60
2.3.1.2 Redundancy in walking ... 64
2.3.1.3 General motor patterns selected to achieve the tasks of walking ... 66
2.3.2 Control of toe states from optimal feedback control theory framework ... 67
2.3.2.1 Optimal estimate of toe states ... 68
2.3.2.2 Control policy ... 72
2.3.2.2.1 Idiosyncratic movement patterns ... 73
2.3.3 Framework of Optimal Feedback Control Theory (OFCT) ... 75
2.3.3.1 Cost policies for walking ... 77
2.3.4 Risk sensitive cost function ... 80
2.3.5 Passive control of toe trajectories: biomechanical control ... 82
2.4 Quantifying toe clearance performance ... 83
2.4.1 Research approaches to investigating toe-swing performance ... 83
2.4.2 Gait variability ... 84
2.4.3 Serial correlations and persistence ... 85
2.4.4 Structure of task redundant and task relevant variability ... 90
2.4.4.1.1 Serial correlations and uncontrolled manifold hypothesis ... 94
2.4.5 Minimising tripping risk ... 95
2.4.5.1 Assessing toe-swing performance and identifying markers of trip risk ... 95
2.5 Aims of the thesis ... 97
Chapter 3 ... 99
3 Methodology ... 99
3.1 Participants ... 99
ix
3.2.1 Participant characteristics ... 101
3.2.2 Participant preparation ... 102
3.2.3 Walking test ... 102
3.2.3.1 Treadmill walking test... 102
3.3 Measuring gait kinematics ... 104
3.3.1 Instrumentation and lab set-up ... 105
3.3.1.1 Sampling rate ... 105
3.3.1.2 Marker filtering ... 106
3.3.1.3 Lab set up ... 107
3.3.1.3.1 Global Reference System ... 108
3.3.2 Reconstructing a biomechanical model ... 109
3.3.2.1 Tracking segment motion ... 110
3.3.2.1.1 Justification of cluster technical frame marker set up ... 116
3.3.2.2 Anatomical landmarks ... 117
3.3.2.2.1 Protocol for hip and knee functional tasks ... 117
3.3.2.2.2 Justification for functional landmarks ... 118
3.3.2.3 Static calibration trial ... 119
3.3.2.4 Anatomical frame ... 120
3.3.2.4.1 Anatomical frame construction ... 123
3.3.3 Segment angles ... 125
3.4 Data processing and parameterization ... 126
3.4.1 Interpolation and Filtering... 126
3.4.2 Determining heel contact and toe off events ... 126
3.4.3 Determining the first maximum and the minimum toe clearance events of the swing phase ... 129
3.5 Gait kinematics... 130
3.5.1 Walking velocity ... 130
3.5.2 Stride length, step length and step width ... 130
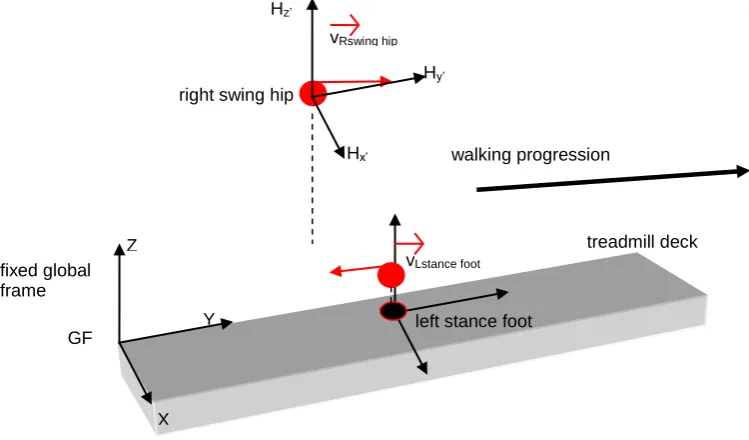
3.5.3 Describing the configuration of the three effector systems: stance limb; swing limb; and a combined system ... 131
3.5.3.1 Reference systems for defining the toe-swing path ... 132
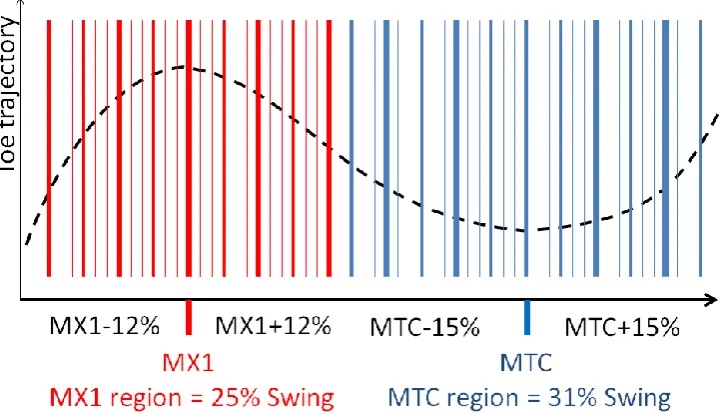
3.5.4 Time points along the swing-cycle ... 134
3.6 Uncontrolled Manifold (UCM) hypothesis ... 137
3.6.1 Mapping body segment variables to task-goal variable ... 138
3.6.1.1 Task variables ... 138
3.6.2 Computing the UCM components of variance... 141
3.6.2.1 Step 1: Geometric model ... 141
3.6.2.2 Step 2: Linear approximation of the UCM ... 143
3.6.2.2.1 Jacobian of the geometric model related to the task variables ... 145
3.6.2.3 Step 3: Projecting the joint configuration onto the UCMparallel and UCMperpendicular ... 146
3.6.2.4 Step 4: Computing the variance of UCMparallel and UCMperpendicular ... 147
3.6.2.5 Input data ... 147
x
3.7 Detecting serial correlations in effector trajectory states ... 151
3.7.1 Detrended Fluctuation Analysis method ... 152
3.7.2 Auto-Correlation Function method ... 155
3.7.3 Input data ... 155
Chapter 4 ... 157
4 Describing kinematic states of the effector trajectories from distribution statistics ... 157
4.1 Background ... 157
4.2 Method ... 159
4.2.1 Hypotheses and statistical design ... 161
4.2.1.1 Time-distance ... 162
4.2.1.2 Effector-state: average ... 162
4.2.1.3 Effector-state: variance ... 163
4.2.1.4 Effector-state: skewness ... 165
4.3 Participant characteristics ... 167
4.4 Step time-distance parameters ... 168
4.5 Qualitative description of the three-dimensional components of the three effectors ... 171
4.5.1 Kinematic description of the three effector vectors. ... 174
4.6 Mean length components of the effector vectors ... 176
4.6.1 Combined effector: means of the component lengths ... 176
4.6.2 Stance effector: means of the component lengths ... 182
4.6.3 Swing effector: mean of the component lengths ... 186
4.6.4 Interaction effects: changes in effector mean between MX1 and MTC ... 191
4.7 Velocity of the components of the effector vectors ... 193
4.7.1 Combined effector: velocity ... 193
4.7.2 Stance effector: velocity ... 197
4.7.3 Swing effector: velocity ... 201
4.8 Standard deviation of the components of the effector vectors ... 205
4.8.1 Combined effector: standard deviation of the vector components ... 205
4.8.2 Stance effector: standard deviation of the component lengths ... 210
4.8.3 Swing effector: standard deviation of the component lengths ... 214
4.8.4 Interaction effects: changes in effector variance between MX1 and MTC ... 218
4.9 Skewness of the components of the effector vectors ... 222
4.9.1 Combined effector: skewness ... 222
4.9.2 Stance effector: skewness ... 227
4.9.3 Swing effector: skewness ... 232
4.9.4 Interaction effects: changes in effector skewness between MX1 and MTC ... 237
4.10 Kinematics of the segment elements within the effector systems ... 241
4.10.1Segment kinematics of the stance effector ... 241
4.10.2Segment kinematics of the swing effector ... 245
4.10.3Segment kinematics summary ... 249
xi
4.11.1Time-distance ... 251
4.11.2Average configuration and motion of effector trajectories ... 251
4.11.3Variance of effector trajectories ... 254
4.11.4Skewness of effector trajectories: ... 256
Chapter 5 ... 259
5 Describing kinematic states of the effector trajectories from correlation statistics ... 259
5.1 Background ... 259
5.2 Method ... 262
5.2.1 Hypotheses and statistical design ... 262
5.2.1.1 Hypotheses of persistence in the effector states ... 263
5.2.1.2 Statistical design ... 265
5.3 Inspection of the effector time series at MTC ... 267
5.4 Qualitative examination of effector state persistence-likelihood ... 269
5.4.1 Detrended Fluctuation Analysis profiles ... 269
5.4.2 Auto-Correlation Function (lag-1) profiles ... 272
5.4.3 Relationship between the ACF1 and DFA ... 274
5.5 Persistence-likelihood of the effector states ... 275
5.5.1 Vertical dimension ... 275
5.5.2 Anterior-Posterior dimension... 279
5.5.3 Medio-lateral dimension ... 283
5.5.3.1 Assessment of the auto-correlation function in the medio-lateral dimension ... 287
5.6 Between-limb differences in persistence ... 289
5.7 Differences in persistence between effector and state ... 289
5.8 Interaction effect of age, effector and state-time on persistence of the effectors in the vertical dimension ... 291
5.8.1 Time region MX1 ... 291
5.8.2 Time MX1-MTC ... 294
5.8.3 Time region MTC ... 296
5.9 Inter-variable correlations between DFA, variance and skewness ... 299
5.9.1 Background ... 299
5.9.2 Correlation table ... 300
5.10 Chapter 5 results summary ... 307
5.10.1Hypotheses of persistence and control policies of effector trajectories ... 307
Chapter 6 ... 311
6 Coordination within the stance and swing effectors ... 311
6.1 Background ... 311
6.2 Method ... 314
6.2.1 Dependent variables ... 315
6.2.2 Independent variables ... 315
6.2.3 Statistical procedure ... 316
6.2.4 Hypotheses and statistical design ... 317
xii
6.4 Evidence of ‘synergies’ in the stance and swing effector systems ... 326
6.5 Evidence of ageing differences in the ‘synergies’ of the stance and swing effectors ... 328
6.6 Synergy effects due to state, response and age in the vertical direction of the swing effector ... 333
6.6.1 Synergy strength comparisons within the MX1-to-MTC transition state ... 335
6.6.2 Synergy strength comparisons at the MX1 region ... 342
6.6.3 Synergy strength comparisons through the MTC region ... 346
6.7 Synergy effects due to state, response and age in the vertical direction of the stance effector ... 349
6.8 Synergy effects due to state, response and age in the medio-lateral direction of the stance effector ... 353
6.9 Chapter 6 results summary ... 359
6.9.1 Hypotheses of synergies in effector systems ... 359
Chapter 7 ... 363
7 Coordination between the stance and swing effectors ... 363
7.1 Background ... 363
7.2 Method and analysis design ... 365
7.2.1 Correlation analysis ... 365
7.2.2 The null hypotheses ... 365
7.2.3 Correlations between the effectors state-response between MX1 and MTC ... 366
7.2.4 Persistence: effector trajectory change between MX1 and MTC ... 366
7.2.5 Correction gains between the effectors ... 367
7.3 Results ... 368
7.3.1 Correlations within participants at each time state of the swing phase ... 368
7.3.2 Correlation analysis between effectors when coordinating the change between MX1 and MTC ... 372
7.3.3 Serial correlations in the time series of the effector displacements between MX1 and MTC ... 375
7.3.4 Correction gain made between the stance and swing effectors to achieve nominal state at MTC based upon initial errors of the combined effector at MX1 ... 376
7.4 Chapter 7 results summary ... 382
7.4.1 Hypotheses of synergies between effector systems ... 382
Chapter 8 ... 385
8 Discussion ... 385
8.1 Introduction ... 385
8.2 Ageing effects on the kinematic states of the stance and swing limbs ... 400
8.2.1 Ageing effects on time-distance ... 400
xiii
8.2.2.1 Configurations in the direction of toe clearance ... 402
8.2.2.2 Configurations in the direction of forward progression ... 404
8.2.2.3 Configurations in the direction of medio-lateral balance ... 405
8.2.3 Age-related changes in the configuration of the stance and swing limb segment angles ... 406
8.2.3.1 The effect of crouch gait on walking mechanics ... 407
8.2.3.2 Effects on toe sensitivity due to swing effector configuration ... 410
8.2.4 Summarising the biomechanical effect of the effector states ... 411
8.3 Variability in the stance, swing and combined effector systems is task-relevant ... 412
8.4 Skewness in the stance, swing and combined effector systems is task-relevant ... 416
8.5 Persistence in the stance, swing, and combined effector systems is task-relevant ... 420
8.5.1 ‘Effort’ to control the vertical toe state is gradually reduced leading up to MTC ... 421
8.5.2 ‘Effort’ to control the vertical hip position is increased in elderly leading up to MTC ... 425
8.5.3 ‘Effort’ to control the medio-lateral effector states is greater at MX1 ... 425
8.6 Reconciling the parameters of control: exploring a relationship between persistence, skewness and variability ... 428
8.7 Within-effector coordination is task-relevant ... 433
8.7.1 Synergies associated with the swing effector ... 434
8.7.2 Synergies associated with the stance effector ... 435
8.7.3 Within-effector coordination is dependent upon MX1 conditions ... 435
8.8 The swing effector is assigned responsibility for making corrections to the toe state between MX1 and MTC ... 438
8.8.1 Effector correlations referent to time state ... 440
8.9 Increasing redundancy of between-effector coordination leads to adaptive control of the toe state ... 441
8.10 Study limitations ... 451
8.10.1Subject sampling ... 451
8.10.2Screening of subjects and inferring age-related changes are due to the natural ageing process ... 451
8.10.3Issues of encumbrance when walking ... 452
8.11 Conclusion ... 454
8.12 Clinical implications of the results ... 457
8.13 Proposal for future research ... 458
Chapter 9 ... 461
xiv
Chapter 10 ... 487
10 Appendix ... 487
10.1 Appendix A ... 488
xv
List of Tables
Table 2.1.3.1 Intrinsic and extrinsic associations with falls ... 22
Table 3.3.2.1.1a Specific marker locations (head to hip) ... 113
Table 3.3.2.1.1b Specific marker locations (thigh to toe) ... 114
Table 3.3.2.1.2 Cluster technical frame definitions ... 116
Table 3.3.2.4.1 Anatomical Frame Definitions (thorax to thigh) ... 122
Table 3.3.2.4.2 Anatomical Frame Definitions (shank to foot) ... 123
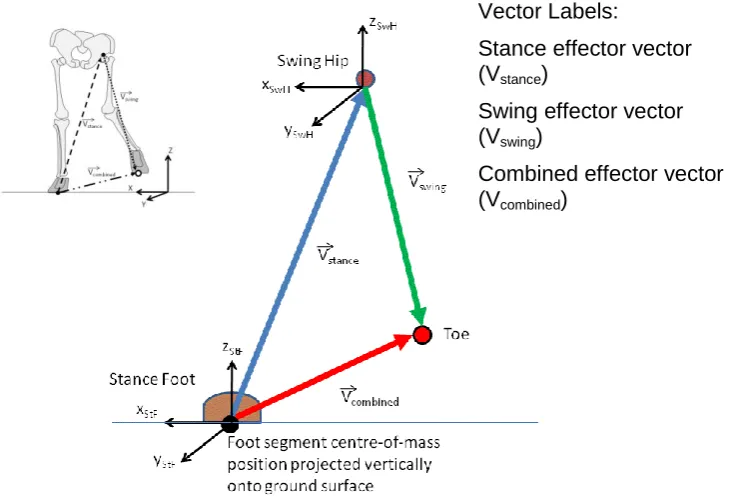
Table 3.5.3.1.1. Three-dimensional vector description of the effectors ... 134
Table 3.6.2.5.1 Criteria for trial re-sampling into nine subgroups ... 148
Table 4.3.1 Participant anthropometric characteristics ... 167
Table 4.4.1 Age differences for intra-subject time-distance parameters ... 169
Table 5.9.2.1 Correlation coefficients between DFA, skewness and standard deviation for YOUNG ... 302
Table 5.9.2.2 Correlation coefficients between DFA, skewness and standard deviation for ELDERLY ... 303
Table 7.3.2.1 Coupling correlations between effectors ... 375
xvii
List of Figures
Figure 2.1.2.1 Falls aetiology ... 20
Figure 2.2.1.2.1 Minimum toe clearance ... 34
Figure 2.2.2.1 Toe trajectory ... 39
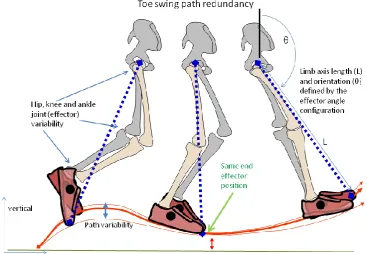
Figure 2.2.2.1.1 Redundancy in the swing effector ... 40
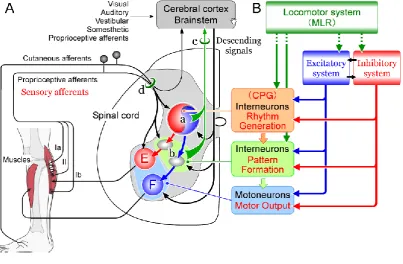
Figure 2.2.3.1.1 Neurophysiology sensorimotor pathways ... 44
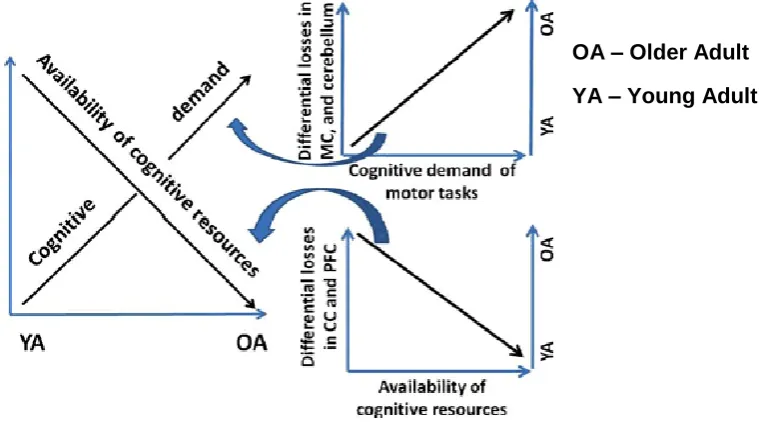
Figure 2.2.3.2.2.1 Resources in the ageing brain ... 50
Figure 2.2.3.1.1.1 Brain mediating control of locomotion ... 51
Figure 2.3.1.1.1.1 Hierarchical control ... 60
Figure 2.3.1.1.2.1 Model of Dynamic Systems Theory ... 61
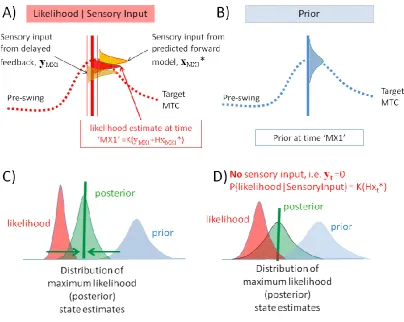
Figure 2.3.2.1.1 Bayesian inference ... 70
Figure 2.3.2.1.2 State estimate differences with ageing ... 72
Figure 2.3.3.1 Optimal Feedback Control Model ... 76
Figure 2.3.3.1.1 Cost policy assigned to MTC states ... 79
Figure 2.4.3.1.1 The Uncontrolled Manifold ... 92
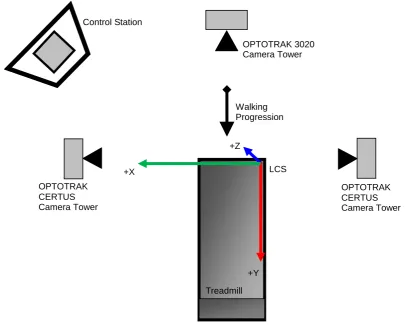
Figure 3.2.1 Experimental set up ... 101
Figure 3.3.1.2.3.1 Lab and equipment set up ... 108
Figure 3.3.2.1.1 Marker set up ... 111
Figure 3.3.2.1.2. Marker cluster set up ... 112
Figure 3.3.2.4.1 Anatomical frame construction ... 121
Figure 3.3.2.4.1.1 The cluster technical frame ... 124
Figure 3.4.2.1 Checking the accuracy of timing events ... 128
Figure 3.4.3.1 The minimum toe point (MTp) ... 129
Figure 3.5.3.1 The effector vectors ... 132
Figure 3.5.3.1.1 The moving reference system ... 133
Figure 3.5.4.1 Sub-phase regions of the swing-cycle, MX1 and MTC ... 136
Figure 3.6.1.1.1 Swing effector ... 139
Figure 3.6.1.1.2 Stance effector ... 140
Figure 3.6.2.5.1 Subdivision of swing trials into MX1-MTC response ... 149
Figure 4.2.1 Example of t-test group comparison plot ... 161
Figure 4.4.1 Step length and step width... 170
Figure 4.5.1 Three dimensional view of effector trajectories ... 172
Figure 4.5.1.1 Vertical trajectories of the effectors ... 175
Figure 4.6.1.1 Mean, Vertical (Z) Combined Effector (Absolute) ... 178
Figure 4.6.1.2 Mean, Vertical (Z) Combined Effector (LL normalised) ... 179
Figure 4.6.1.3 Mean, anterior-posterior (Y) Combined Effector ... 180
Figure 4.6.1.4 Mean, medio-lateral (X) Combined Effector ... 181
Figure 4.6.2.1 Mean, Vertical (Z) Stance Effector ... 183
Figure 4.6.2.2 Mean, anterior-posterior (Y) Stance Effector ... 184
Figure 4.6.2.3 Mean, medio-lateral (X) Stance Effector ... 185
Figure 4.6.3.1 Mean, vertical (Z) Swing Effector ... 188
xviii
Figure 4.6.3.3 Mean, medio-lateral (X) Swing Effector ... 190
Figure 4.6.4.1 Results summary of the mean ... 192
Figure 4.7.1.1 Velocity, vertical (Z) Combined Effector ... 194
Figure 4.7.1.2 Velocity, anterior-posterior (Y) Combined Effector ... 195
Figure 4.7.1.3 Velocity, medio-lateral (X) Combined Effector ... 196
Figure 4.7.2.1 Velocity, vertical (Z) Stance Effector ... 198
Figure 4.7.2.2 Velocity, anterior-posterior (Y) Stance Effector ... 199
Figure 4.7.2.3 Velocity, medio-lateral (X) Stance Effector ... 200
Figure 4.7.3.1 Velocity, vertical (Z) Swing Effector ... 202
Figure 4.7.3.2 Velocity, anterior-posterior (Y) Swing Effector ... 203
Figure 4.7.3.3 Velocity, medio-lateral (X) Swing Effector ... 204
Figure 4.8.1.1 StDev, vertical (Z) Combined Effector ... 207
Figure 4.8.1.2 StDev, anterior-posterior (Y) Combined Effector ... 208
Figure 4.8.1.3 StDev, medio-lateral (X) Combined Effector ... 209
Figure 4.8.2.1 StDev, vertical (Z) Stance Effector ... 211
Figure 4.8.2.2 StDev, anterior-posterior (Y) Stance Effector ... 212
Figure 4.8.2.3 StDev, medio-lateral (X) Stance Effector ... 213
Figure 4.8.3.1 StDev, vertical (Z) Swing Effector ... 215
Figure 4.8.3.2 StDev, anterior-posterior (Y) Swing Effector ... 216
Figure 4.8.3.3 StDev, medio-lateral (X) Swing Effector ... 217
Figure 4.8.4.1 Results summary of StDev ... 219
Figure 4.9.1.1 Skewness, vertical (Z) Combined Effector ... 224
Figure 4.9.1.2 Skewness, anterior-posterior (Y) Combined Effector ... 225
Figure 4.9.1.3 Skewness, medio-lateral (X) Combined Effector ... 226
Figure 4.9.2.1 Skewness outlier case ... 227
Figure 4.9.2.2 Skewness, vertical (Z) Stance Effector ... 229
Figure 4.9.2.3 Skewness, anterior-posterior (Y) Stance Effector ... 230
Figure 4.9.2.4 Skewness, medio-lateral (X) Stance Effector ... 231
Figure 4.9.3.1 Skewness, vertical (Z) Swing Effector ... 234
Figure 4.9.3.2 Skewness, anterior-posterior (Y) Swing Effector ... 235
Figure 4.9.3.3 Skewness, medio-lateral (X) Swing Effector ... 236
Figure 4.9.4.1 Results summary for skewness ... 238
Figure 4.10.1.1 Segment angles, sagittal plane (X) Stance Effector ... 242
Figure 4.10.1.2 Segment angles, frontal plane (Y) Stance Effector ... 243
Figure 4.10.1.3 Segment angles, transverse plane (Z) Stance Effector ... 244
Figure 4.10.2.1 Segment angles, sagittal plane (X) Swing Effector ... 246
Figure 4.10.2.2 Segment angles, frontal plane (Y) Swing Effector ... 247
Figure 4.10.2.3 Segment angles, transverse plane (Z) Swing Effector ... 248
Figure 4.10.3.1 Results summary of segment angles ... 250
Figure 5.3.1 Example plot of effector time series ... 268
Figure 5.4.1.1 Effector DFA profiles across swing cycle ... 270
Figure 5.4.2.1 ACF profiles across swing cycle ... 273
Figure 5.5.1.1 DFA, Vertical (Z) Combined Effector ... 276
Figure 5.5.1.2 DFA, Vertical (Z) StanceEffector ... 277
Figure 5.5.1.3 DFA, Vertical (Z) Swing Effector ... 278
Figure 5.5.2.1 DFA, anterior-posterior (Y) Combined Effector ... 280
Figure 5.5.2.2 DFA, anterior-posterior (Y) Stance Effector ... 281
Figure 5.5.2.3 DFA, anterior-posterior (Y) Swing Effector ... 282
Figure 5.5.3.1 DFA, medio-lateral (Y) Combined Effector... 284
xix
Figure 5.5.3.3 DFA, medio-lateral(X) Swing Effector ... 286
Figure 5.5.3.1.1 ACF medio-lateral data comparing Young and Elderly ... 288
Figure 5.7.1 Results summary of DFA at MX1 and MTC ... 290
Figure 5.8.1.1 DFA interactions at MX1 ... 293
Figure 5.8.2.1 DFA interactions at MX1-MTC ... 295
Figure 5.8.3.1 DFA interactions at MTC ... 298
Figure 6.3.1 UCM profiles – moderate response ... 322
Figure 6.3.2 UCM profiles – weak response ... 323
Figure 6.3.3 UCM profiles – strong response ... 324
Figure 6.4.1 Confidence intervals for evidence of synergies... 327
Figure 6.5.1 UCMratio Swing Effector Vertical ... 329
Figure 6.5.2 UCMratio Swing Effector A-P ... 330
Figure 6.5.3 UCMratio Stance Effector Vertical ... 331
Figure 6.5.4 UCMratio Swing Effector M-L ... 332
Figure 6.6.1 UCM variance components, Swing, Vertical ... 334
Figure 6.6.1.1 UCM, Swing V, MX1-MTC Main effects ... 336
Figure 6.6.1.2 UCM, Swing V, MX1-MTC Interactions ... 338
Figure 6.6.1.3 UCM, Swing V, MX1-MTC Limb Differences ... 341
Figure 6.6.2.1 UCM, Swing V, MX1 Interactions ... 343
Figure 6.6.2.2 UCM, Swing V, MX1 Main effects ... 345
Figure 6.6.3.1 UCM, Swing V, MTC Main effects ... 347
Figure 6.6.3.2 UCM, Swing V, MTC Interactions ... 348
Figure 6.7.1. UCM variance components, Stance, Vertical ... 350
Figure 6.7.2 UCM, Stance, Vertical, MX1-MTC interactions ... 352
Figure 6.8.1 UCM variance components Stance, Medio-lateral ... 354
Figure 6.8.2 UCM, Stance, M-L, MX1 interactions ... 356
Figure 6.8.3 UCM, Stance, M-L, MX1-MTC interactions ... 358
Figure 7.3.1.1 Effector coupling at states MX1 ... 369
Figure 7.3.1.2 Effector coupling at states MTC ... 371
Figure 7.3.2.1 Individual results for effector coupling ... 373
Figure 7.3.2.2 Between-group results for effector coupling ... 374
Figure 7.3.3.1 Between group effector DFA within-cycle trajectories ... 376
Figure 7.3.4.1 Individual results for correction gains ... 378
Figure 7.3.4.2 Prediction of stance gain from coupling strength ... 380
Figure 8.9.1 State estimation from independent and mutual goals ... 445
1
Chapter 1
1
Introduction
The capacity to walk is important to life’s activities, longevity of health and well-being; however, in older adults walking can pose an injury risk because it reduces the stability limits for maintaining upright balance. At least one in three people aged over 65 years suffer a fall; furthermore, accidental falls in older adults usually occur while walking. Falls are a major problem within this population because the immediate injury trauma sustained results in longer term consequences of reduced mobility and quality of life (Lord, Sherrington, Menz and Close, 2007). For an older adult, a serious injury from a fall can therefore represent a tipping point into a negative lifestyle. For this reason, falls in older adult populations has become an epidemic problem worldwide. The increasing ageing population worldwide is causing the incidence rate of falls to rise steadily, and this is compounding the financial burdens put upon worldwide health and aged-care systems. Current trends indicate that annual cost of falls to the Australian community in 2051 will reach AUD$1,375 Million (Cripps and Carman, 2001). The financial cost of falls in America is expected to reach US$32.4 Billion by 2020 (Englander, Hodson and Terregrossa, 1996). The cost of falls is a serious worldwide problem; however, maintaining lifestyle activities like walking are critical for older adults, even though they may increase their risk of a fall.
There are many causes of a fall; however, tripping while walking is cited as the most common. Tripping on uneven and flat terrain is cited as causing more than 50% of the falls in older adults (Berg, Alessio, Mills and Tong, 1997). A trip-related fall while walking is most common because the body enters regions of upright instability at a time when the toe is travelling close to the ground. When walking, the toe trajectory
2
and low to the ground at the middle of the leg swing cycle. The toe reaches a minimum ground clearance height at mid-swing (i.e. known as MTC, or minimum toe clearance). There are simultaneous tasks occurring at this phase of the gait cycle that places the upright body in a state that is susceptible to a trip-related fall following a destabilising perturbation. The body is supported by a narrow base area the size of one foot width. Maintaining upright balance must be performed dynamically within the narrow limit provided by the support foot area, and this is difficult because the body centre-of-mass is moving with a high forwards momentum with medio-lateral instability (Winter, 1992). The consequence of a trip creates a mechanical perturbation that is usually large
enough to destabilise the gait pattern. Regaining gait stability is not so easy for older adults, their body faces a significant mechanical challenge in response to preventing a fall (Pavol and Pai, 2007; Pijnappels, Reeves, Maganaris and van Dieen, 2007). For example, if the toe is obstructed from its natural swing path, the moving trunk will develop an increase in forward angular momentum. Arresting this augmented trunk motion will require the appointment of a new movement plan with significant joint and muscle strength in the support limb (van Dieen, Pijnappels and Bobbert, 2005).
Simultaneously, a swift movement of the swing limb to provide a timely foot position will also be required to create a new support base area from which forces can be directed to recapture the falling upper body. This strategy is difficult for some elderly persons to execute and several repositioning steps are usually required before upright balance is restored (Pijnappels et al., 2007).
The holy grail of falls prevention is to find the key markers that identify people with high falls-risk. On one hand, some older adults may display poor trip-response attributes and be classified as being at risk of falling if they sustain a trip. Another scenario is that older adults might be more at risk of initiating a trip because of a particular gait pattern. For the prevention of trip-related falls, an argument can be made that increasing trip avoidance probability is equally as important as improving trip-responses. Minimising the likelihood of a trip occurring in older adults will mean that a trip response plan will be less frequently needed. Certainly, a combined
3
the rationalised merit of investigating trip prevention has received slightly less focus (Barrett, Mills and Begg, 2010). While trip-response studies demonstrate significant differences between young and older adults, so far, research has not convincingly demonstrated that older adults are more likely to trip (i.e. toe-to-ground/obstacle contact) any more than a young adult (van Dieen and Pijnappels, 2007; Barrett et al., 2010). Identifying gait markers that indicate an increased likelihood of tripping is difficult because of the internal complexities of the sensory and motor systems underlying walking (i.e. the loco-sensorimotor system).
It might seem that the simplest option to reduce the probability of tripping would be for the loco-sensorimotor control system to raise the height of the toe trajectory (Begg et al., 2007; Best and Begg, 2008). However, high toe clearance is an energy expensive gait pattern; and, optimal design processes of the loco-sensorimotor control system following years of walking practice and evolution resist energy costly walking patterns. Therefore, one proposed hypothesis related to swing-toe trajectory is that the loco-sensorimotor system seeks to achieve a balanced compromise between the
competing needs of both energy efficiency and trip avoidance (Begg et al., 2007). This competition is hypothesised to constrain the trajectories of the swinging-toe so they remain within a bounded region in space. During steady state walking on flat terrain, it is plausible that a narrow region of highly repeatable toe trajectories is sustainable. However, the loco-sensorimotor system is open to internally manifested perturbations that can potentially propagate into ‘divergent’ toe trajectories. When the
loco-sensorimotor system gets to this state and toe trajectories threaten to exceed a nominal region, there will need to be some capacity within the system to allow flexible re-adjustments of sub-optimal trajectories. Therefore, evaluating the probability of tripping is arguably about measuring the performance of the loco-sensorimotor control system to dynamically manage toe-trajectories. This is the important area of trip-avoidance research requiring more attention.
4
namely the minimum toe-to-ground clearance event (MTC). This is a critical event along the trajectory, however, this does not provide information about how the trajectory is managed as it approaches MTC. Second, most details of gait parameters describe the average performance of the toe trajectory across multiple repetitions, by applying descriptive statistics. While this approach provides meaningful distribution statistics and probabilities, it does not reveal whether some trajectories are selectively managed by the control system. The third area of research literature that is limited is how a redundant multi-degrees-of-freedom system cooperates to control the toe trajectory. For example, when determining how a task variable (i.e. toe trajectory) is controlled by element variables (i.e. joint or segment angles), analyses have been limited to
correlations of variance among element variables, and this has no direct association with the task variable (Bianchi, Angelini, Orani and Lacquaniti, 1998; Ivanenko, Grasso, Macellari and Lacquaniti, 2002; Mills, Barrett and Morrison, 2007; Shemmell,
Johansson, Portra, Gottlieb, Thomas and Corcos, 2007). Furthermore, when research studies have assigned joint angle (element) variables with the toe trajectory (task) variable, the methods have assumed a non-redundant system (Winter, 1992;
5
6
of multiple gait trajectories at different points of the cycle. Some researchers propose that the DFA quantifies how values from a time series will be likely to continue
persisting in a way that is consistent with its recent history. Similarly, the DFA
demonstrates anti-persistence when trends are frequently prevented from persisting, due to some over-correcting mechanism. In this thesis, DFA values are proposed to reflect persistence-likelihood and the reduction in persistence is related to control intervention (e.g. Dingwell, John and Cusumano, 2010).
The state of the toe is determined from a kinematic chain of inter-linked
7
redundant systems is that there is scope for the system controller to facilitate sharing of resources between elements of the independent effector systems, particularly when multiple task goals arise simultaneously (White and Diedrichsen, 2010). For the control of toe trajectories, it is unknown how the loco-sensorimotor controller allocates task sharing between the stance and swing effector systems. There is likely to be inter-dependent cooperation that exists at two levels: (i) between-effectors; and (ii) within-effectors. In addition to dual-goal tasks (e.g. toe clearance and upright posture stability), exploiting this feature of redundancy is also critically important for a loco-sensorimotor system that has neural transmission noise contaminating the motor commands and sensory feedback (Faisal, Selen and Wolpert, 2008). The issues raised above describe the nature of the loco-sensorimotor system from which toe-trajectories emerge. So far, there has been limited information in the literature detailing how the loco-sensorimotor system manages these issues to satisfy task-relevant goal-states of toe trajectories.
In addressing the cooperation of effector elements at the within-effector level of stance and swing limbs, this thesis will apply a new analysis tool in gait analysis. The Uncontrolled Manifold (UCM) hypothesis is a linear geometric model that describes how a movement system controls against the undesirable variability (including system noise) that threatens the stability of the effector due to mis-coordination of the within-effector components. A proposed beneficial outcome of variability structuring ensues that an effector system will be stable, and therefore provide greater certainty for meeting it’s assigned goal (Latash et al., 2008). A proposed disadvantage of variability structuring is that the system will be more robust to responsive actions that seek to change the effector goal (Latash et al., 2008). In the context of toe trajectory control, the outcomes of this analysis may provide age-sensitive information about the loco-sensorimotor control system.
8
created sub-optimal toe trajectories that permeated without appropriate correction. If research can observe how toe-trajectories are managed during the approach to the critical minimum toe clearance event when walking under steady state conditions, we can advance our knowledge about trip avoidance. So far, only one study has applied the DFA hypothesis to describe the vertical toe trajectory at its minimum clearance state; findings show that older adults with previous history of a trip-related fall apply significantly less ‘management’ of toe trajectories during steady state walking when compared to healthy older adults (Khandoker, Taylor, Karmakar, Begg and Palaniswami, 2008). No studies have explored how redundancy in the system is exploited to manage movement variability and to ultimately control toe trajectories.
In summary, this thesis aims to extend knowledge about the performance characteristics of the toe clearance task and how it is affected by the normal ageing process, by investigating:
the average kinematic details of the stance and swing limb effector systems, at task-relevant events of the swing phase;
control intervention of the effector systems, at task-relevant events of the swing phase;
within-effector coordination, at task-relevant events of the swing phase;
between-effector coordination, at task-relevant events of the swing phase.
9
1.1
Glossary
To help the readability flow of the thesis by preventing digressions, this section will provide background definitions that may be unfamiliar to the reader.
TERM DEFINITION
Allometric control Multiple agents from ‘bottom-up’ and ‘top-down’ sources that are influencing in a non-linear way the dynamic coordination of ‘agents’ within a system.
Anti-persistence The extinction of cycle-to-cycle local trends in a time-series of ‘states’, due to subsequent over-corrections of previous error states.
Attractor – fixed point Final state in phase space and physical space that a dynamical system settles toward.
Attractor – limit cycle As time approaches infinity a cyclic trajectory will stabilise if it is in the neighbourhood of a limit-cycle.
Bayesian inference A model of probability applied for determining an optimal representation of information. A motor command
requires optimal state-estimation and this reflects a ‘Bayesian inference process’ to account for ‘noisy’ representations of sensory information and feedforward (motor command) information.
Closed-loop control Rely upon measured sensory information from external environment which allows integration with internal model for acquiring the state estimate. This information is processed by the relevant levels of the controller. Complexity Diverse layers of actions and interactions amongst system
components which operate across multiple time scales Control parameter An influential ‘agent’ that causes change to the behaviour
of the order parameter (or collective parameter). Cost-to-go On-line selection of an optimal trajectory of physical
states that minimises a task-relevant cost
Cost function An algorithm composed of goal-relevant variables whose values require minimisation during the process of optimising the outcome of task performance. These variables generally take the form of ‘energy’, ‘movement variability’, ‘outcome risk’.
(DFA) Detrended
persistence-10
likelihood parameter, ‘α‘, is derived from the DFA process.
(DST) Dynamic Systems Theory Time dependence of a point in geometric state-space. Observing change in state over time.
Effector Elements making up a functional system, a kinematic chain described by a limb of inter-connected segments, can be defined as a kinematic model with end-effector mobility defined by the degrees of freedom in the system Elemental variable All the degrees-of-freedom components which are
relevant to the performance of a movement task Embodiment Term to describe the interplay of information and
physical processes complex dynamical system all the various components and subcomponents making up the structured anatomical (Pfeifer, 2007)
End-effector A variable representing the distal position on the last link in a kinematic chain and can be used to characterise the execution of task goal involving an effector system Equifinality Allows the accomplishment of complex actions reliably
and repetitively while allowing a relatively high variability in the movement particulars (Cusumano and Cesari, 2006).
Feed-forward model An online predictive capacity of the sensorimotor system by anticipating the future states based upon the
perceived current state. This is distinguished from inverse model.
Forward dynamics Optimisation process for mapping muscle activity onto kinematic and kinetic experimental data. The solution is compared against experimental EMG data. Kinetic data is usually GRF data because of errors typically found by using inverse dynamics.
(GEV) Goal Equivalent Variance Describes the strength of a motor synergy and any variance along this dimension will satisfy the task goal. Also referred to as task-irrelevant variance, because variations do not cause change to performance goal. From DST, this parameter describes the stability of the system.
Inverse kinematic solution A unique solution for a kinematic chain. A redundant kinematic chain has no unique solution to the inverse kinematic problem.
11
Limb/Leg (stance and swing) Defined by the segment linkage of the foot, shank and thigh segments. The stance limb is defined by the
supporting foot, shank, thigh and pelvis. The swing limb is defined by the thigh, shank and foot.
Limit cycle A periodic-type trajectory in state-space that does not converge exactly onto a fixed path but remains
asymptotically stable. For example, if a given trajectory with initial conditions lies close to a fixed region, the trajectory will forever remain attracted to the fixed region of stable equilibrium. Limit cycles describe the typical behaviour of a cyclic system, from which it repeats from relatively equivalent initial conditions and finds equivalent stable states through the cycle. Limit cycles have the ability to dissipate small instantaneous perturbations across time to ensure the cycles remain asymptotically stable.
Long-range correlations Refers to temporal order of serial correlations in a time series that exist over medium to long time scales. Other terms are long-term dependence, persistence, fractal-like structure, 1/f noise. The correlations are hypothesised to be derived from long-term dependent sources within a system; however, long-term correlations have shown to occur from short-term dependence.
Motor equivalence Ability to perform a task with various task-equivalent effector configurations, such that co variations of the system elements do not effect the task outcome. Motor equivalence is a necessary requirement of redundancy. Motor primitives Basic foundation of co-variant muscle combinations that
can be modulated by the central nervous system to perform task-specific motor actions, i.e. forming a movement synergy.
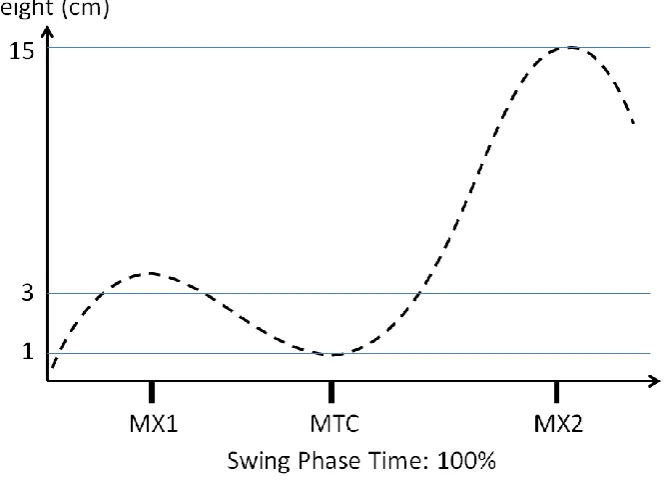
MTC (Minimum Toe Clearance) The vertical state of the toe reaches a local minima with respect to the ground surface at the middle period of the swing cycle.
MX1 (Maximum toe clearance) Where the vertical state of the toe reaches a local maxima with respect to the ground surface during the initial period of the swing cycle.
Nash Equilibria An equilibrium state reached by multiple agents acting in cooperation to reach a share/mutual goal. The state of each agent cannot gain any further when the system has achieved a state of Nash equilibrium.
12
Variance) When co-variance of an effector system causes a change to the state of the end-effector. This change is task-relevant because the end-effector state is hypothesised to be a variable requiring control. This is the variance perpendicular to the ‘plane’ of the uncontrolled manifold (UCM).
Noise The unpredictable neuro-physiological variations within the sensorimotor processes that contribute to state estimate error and motor actuation errors. Noise
contributes to variability of a task variable, however, it is not the only contributing source.
Order Parameter A ‘meaningful’ variable that expresses the collective coordination of the system. The MTC can be rationalised to be an order parameter expressing meaningful
coordination of relational subsystems inherent to the locomotor system. An order parameter expresses synergy behaviour.
Open loop feedback control Rely upon internal models of control, such as inverse model and feed-forward model
(OFCT) Optimal Feedback Control
Theory Based on a hierarchical model of motor control and incorporates key principles of coordination and control – one of the few motor control mechanistic models that have reflected self-organisation and embodiment concepts from dynamic systems theory.
Passive control Using the biomechanical attributes of a system – e.g. inertia and musculo-skeletal properties – to stabilise movement. Generally receives limited neural input from the control hierarchy. However, muscle stiffness is also a feature of ‘passive’ control, but this requires prior neural command intervention.
Performance variable A variable that defines the performance outcome of a task. A variable belonging to a cost function that defines optimal task performance.
Persistence The cycle-to-cycle local trend of a time series that decays slowly across cycles.
Perturbation Disturbance that disrupts a trajectory stability of a parameter away from its preferred state
Redundancy Multiple configuration options within a system that lead to one unique solution
13
(SCA) Serial correlation analysis Analysis of temporal structure in a time series
Stability Ability to preserve and maintain a stable behaviour in a variable environment - system ability to offset external perturbations by returning or finding a suitable alternate stable state. Capacity of a system to restore its state after a phasic perturbation away from that state.
State A physical property that describes a body. In this thesis, it is related specifically to a kinematic property that
describes an effector system in this thesis.
State estimate Estimated position and orientation of a task-relevant body part with respect to a movement plan and the external environment
State-space A vector space that describes the combined properties of motion and configuration/position of a physical system Synergy A functional concept of coordinating elements of a
system to meet a meaningful goal. A hypothetical control structure in the motor system that organises components of various levels into a single coherent unit.
Task space The space that details the physical properties of the components contributing to the task performance Task-relevance Details that affect the goal of the task variable, i.e. details
that cause change to the end-effector state. Task variable A parameter that represents the task outcome of a
collective system
Toe-swing The state of the toe relevant to the swing limb during walking
(UCM) Uncontrollable Manifold
hypothesis A ‘planar space’, existing in multi-dimensional space, that contains a set of solutions where each solution solves the task goal. Specifically, it is a method that maps effector co-variance to end-effector variance in task-space to create a linear estimate of a manifold ‘plane’ in n-dimensional task-space. The manifold has two components of variance that is hypothesised to be controlled differently. Variance parallel to the manifold is termed goal equivalent, where any effector co-variance in this dimension is considered task-irrelevant, i.e. it does not change the state of the task variable. Variability along this parallel dimension is suggested to be ‘uncontrolled’ because the task goal is not affected.
14
noise and noise in the motor actuators make inference of state-estimate difficult and this leads to variability. More predictable sources of variability within the systems are dynamic changes to cost policies, motor-control
management strategies, and non-linearities in the musculo-skeletal system.
15
Chapter 2
2
Literature review
This section explores the research field on areas related to the problem of controlling the toe trajectory during the swing phase of walking. The sections will be divided into four themes:
reducing the problem of trip-related falls in older adults;
the embodied system from which toe-trajectories arise;
theories of how toe-trajectories are shaped;
quantifying toe clearance performance.
Problem of falls and trips in older populations:
This first section relates to the worldwide problem of falls and the context of trip-related falls. This section also discusses what research approaches have been
undertaken to identify persons or groups at risk of trip-related falls.
Context from which toe-swing performance arises:
16
provides a difficult challenge for researchers to solve a tractable cause-effect map through the neuro-muscular-skeletal system. In concluding this section, it will be argued, that theories in line with embracing these issues should be considered as a means to assess toe clearance performance in an appropriate context.
Theories of how coordinated and controlled movement trajectories emerge from the
sensorimotor system:
This third section describes two different theories, dynamic systems theory and optimal feedback control theory, to explain how the toe clearance task is potentially controlled by the sensorimotor system. General perspectives of both theories have been applied in biped robot designs, however, dynamic systems theory has been the main philosophical theory for explaining human walking. These two theories will also provide context for describing how the age affected sub-systems affects the process underlying toe trajectory control. The theories described and their applications will provide a rationale for selecting tools that can capture the performance of the toe clearance task.
Quantifying toe clearance performance:
The fourth section explores previous methods that have examined toe
trajectories of the swing phase. Building upon this current information, two general methods are proposed to add further insight into how the toe clearance task is
17
2.1
Falls, trips and gait in older adults
Falls in older people is a serious national and international health concern with major consequences to the health and well being of the older person who has suffered a fall, the burden placed on their family members, and the strain placed on community resources. Understanding the cause of falls is important. This section will outline the nature of falls in older people by reviewing studies that have used report surveys and observational tests. Specific attention will be given to the risk factors associated with falls. In concluding this section, the implication of the findings, that walking variability is associated with falls, has for future investigative research identifying persons with high risk of trip-related falls is discussed.
2.1.1 Epidemiology and aetiology of falls
In Australia at least a third of people aged 65 years and over (‘older adult’ group) fall at least once each year (Lord, 1994). This is also believed to be an underestimate due to non-reporting of non-injurious falls and some people suffer multiple falls (Lord et al., 2007). This incidence rate of falls is commonly reflected in studies for both rural and urban areas (Lord, Ward, Williams and Anstey, 1993; Luukinen, Koski, Hiltunen and Kivela, 1994) and throughout other parts of the world (Tinetti, Speechley and Ginter, 1988; O'Loughlin, Robitaille, Boivin and Suissa, 1993; Luukinen et al., 1994). A fall occurring during walking has been defined as “unintentionally coming to ground or some lower level, other than as a consequence of sustaining a [external] blow, loss of consciousness, sudden onset of paralysis as in stroke or epileptic seizure” (Gibson, Andres, Isaacs, Radebaugh, and Worm-Petersen, 1989).
18
attributed to a trip during walking varies between studies: Berg et al. (1997) reported 34%; Blake et al. (1988) reported 53%. Two other studies reported 28% and 44% when grouping trips, stumbles and slips in the same category (Tinetti et al., 1988; Roudsari, Ebel, Corso, Molinari and Koepsell, 2005). In Australia, two reports by the Australian Institute of Health and Welfare (AIHW) investigated hospital separations due to fall injury in persons older than 65 years, and the specific mechanism of the fall. Cripps and Carman (2001) found that 39% of this reported falls came under the slips, trips and stumbles category. The Cripps and Carman (2001) report suggested that the rate of falls belonging to the general category of trips, stumbles and slips is potentially much higher than reported because a large proportion of the classified fallers do not specify the type of fall. In a more recent AIHW that included a much larger cohort of reported falls in persons older than 65 years (n = 22,801), evidence showed that 61% of the those persons sustaining a ‘fall on the same level’ was due to tripping, and 27% due to slipping (Kreisfeld and Harrison, 2010). Furthermore, females accounted for a 75% proportion of these trip-related falls (Kreisfeld and Harrison, 2010). This finding that there is a high proportion of females that display a higher rate of falling is supported by other research (Campbell et al., 1989; Lord, 1993). The rate of falls due to slips, trips and stumbles rises exponentially and begins much sooner in females compared to males. The rate of falls has been shown to increase exponentially with increasing age (Cripps and Carman, 2001). The rate of falls in older females between the age of 65-69 years is comparable to males at ten years their senior (Kreisfeld and Harrison, 2010).
2.1.2 Immediate and long term consequences of falls
19
reported slight differences in injury consequences of falls which are largely dependent on sub-group ages within the ‘older adult’ population (e.g. 65-74, 75-84, 85+ years of age), where between 22% and 60% of fallers suffer injury (Lord et al., 2007). The average cost per injured elderly person is nearly double that for injured persons of other ages (Rice and Mackenzie, 1989). In the US a report to congress revealed that persons aged over 70 years will spend 70% of their total health care costs on injuries related to falls (Rice and Mackenzie, 1989).
The Australian AIHW report by Kreisfeld and Harrison (2010) indicated that the most common bone fracture injury reported is the hip (26%) and the second most common is the wrist (8%). The age-related deterioration of bone strength at the hip appears to match the incidence of hip fractures (Riggs et al., 2006). The consequential nature of a hip fracture is much more severe in nature, as it not only requires a longer stay in hospital compared to a wrist fracture, but they are at risk of a poor recovery. In a large cohort of admitted hip fracture patients (from a sample of n = 674), it was
reported that between 18-33% died within 1 year of the incidence (Magaziner, Hawkes, Hebel, Zimmerman, Fox, Dolan, Felsenthal and Kenzora, 2000). It was also found that between 25-75% of elderly hip fracture patients that were previously living
independently, did not regain the same independent level of living prior to hip fracture incidence (Magaziner et al., 2000).
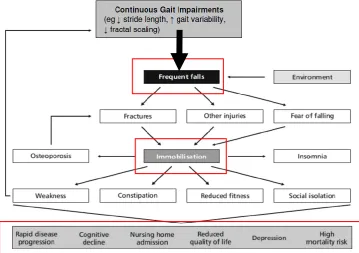
People who have experienced more than one fall show a strong prevalence of subsequent falling (Maki, 1997; Friedman, Munoz, West, Rubin and Fried, 2002). Figure 2.1.2.1 illustrates the interactive consequences of falls experience. Ultimately,
20
1997) and thus elevate dependency and long term care. A fear of falling can be a realistic appraisal of functional ability that accurately reflects the likelihood of future falling. Alternatively, a fear of falling could potentially be an irrational appraisal of a healthy functional ability resulting in an unnecessary curtailing and restriction to lifestyle. Additionally, the irrational appraisal of poor functioning could cause the gait patterns to become unnecessarily unstable. This remains an unknown outcome,
whether a fear of falling can cause neuro-mechanical abilities to cause mis-coordinated and unstable movements and cause a higher probability of future falls.
Comparatively, figures show that the direct cost of falls to the community is not only the highest ranked among all injury categories, but it is five times greater than the second ranked, road traffic accidents (Potter-Forbes and Aisbett, 2003). A compounding future projection predicts that this cost will increase due to population growth trends
Figure 2.1.2.1.
21
for the 65 years and over population group. The 65 years and older age group in Australia have increased by 72% over the last 20 years (Australian Bureau of Statistics., 2009). The 65 years and older group currently represents 13% of the population . Projections by the Australian Bureau of Statistics (2009) estimate a growth of this group to represent 23-25% of the total population by 2051. For the older elderly (above 85 years); projections estimate that this group will increase from 1.2% to between 4.9-7.3%. If current trends in rate of fall-related injury continue in Australia, by 2051 the direct annual health care cost will be AUD$1,375 Million (Potter-Forbes and Aisbett, 2003). Internationally, the financial cost of falls in America is expected to reach US$32.4 Billion by 2020 (Englander et al., 1996). The holy grail of falls research is to find a
parameter which can identify in advance those people at risk of falling so that preventative measures can be undertaken.
2.1.3 Intrinsic and extrinsic risk factors of falls
Generally, the cause of falls may be categorized into two groups: intrinsic and extrinsic factors. Increased age- and pathology-associated changes to the multiple systems that control balance and locomotion are intrinsic mechanisms contributing to falls. Extrinsic factors elevate the risk of falls related to environmental hazards, such as poor lighting, footwear, home settings (bathrooms and floor rugs), uneven and/or slippery footpath surfaces. Evidence for such factors with published evidence for having a ‘strong’, ‘moderate’, ‘weak’, or ‘little’ association with falls have been outlined by Lord et al. (2007). Table 2.1.3.1 summarises the intrinsic and extrinsic factors associated with falls. These factors are classified into intrinsic factors (socio-demographic; postural instability; sensory and neuromuscular; psychological; medical) and extrinsic factors (medication; environmental). Interestingly, there has shown to be an effect of footwear on balance ability, but the type of shoe characteristics has yet to demonstrate a
22
Table 2.1.3.1
Intrinsic and extrinsic associations with falls (Modified from Lord et al., 2007).
Intrinsic factors
Socio-demographic:
STRONG - advanced age, ADL/mobility limitations, history of falls
MODERATE - female gender, race, living alone, inactivity, walking aid use
Postural instability:
STRONG - impaired sit-to-stand transfer ability, reduced gait velocity/cadence/step length MODERATE – impaired stability when standing, impaired stability when leaning and reaching, slow voluntary stepping, increased step timing variability
Sensory and neuromuscular:
STRONG – poor visual contrast sensitivity, decreased depth perception, reduced vibration sense, reduced tactile sensitivity, reduced muscle strength, poor simple reaction time, poor choice reaction time
MODERATE - poor visual acuity, reduced proprioception
Psychological:
STRONG – increased fear of falling MODERATE – impaired selective attention
Medical:
STRONG – impaired cognition, stroke, Parkinson’s disease, number of chronic conditions MODERATE – depression, abnormal neurological signs, incontinence, acute illness, arthritis, foot problems, dizziness
Extrinsic factors
Medication:
STRONG – use of multiple medications, benzodiazepine use, antidepressant use, anti-psychotic use, psychoactive medication use
Environmental:
WEAK ASSOCIATIONS ONLY
There doesn’t appear to be any consistently reported environmental hazard that has an association with falls and this is possibly due to the transient nature and
23
2.1.4 Interventions that show success for improving falls risk
There has been a recent ‘Cochrane report’ that reviewed 110 research studies, across 15 countries, where the outcomes of the reviewed studies was relevant to falls-risk / falls-occurrence reduction in community dwelling older adults (Gillespie,
Robertson, Gillespie, Lamb, Gates, Cumming and Rowe, 2009). In terms of exercise interventions, it was found that programs which incorporated a combination of at least two components of exercise, balance, flexibility, and endurance were found to be successful at reducing falls-risk / falls-occurrence. For persons without a significant physical impairment (e.g. following hip fracture or stroke), the effectiveness of ‘exercise’ intervention programs has been found to be successful under different settings, such as individualised prescription of home exercise classes, Tai-Chi
(considered as a multiple component exercise intervention because it targets strength and balance), or targeted exercise classes in a group. Functional training with multiple modalities has greater likelihood of reducing falls compared to general resistance training program (Gillespie et al., 2009). The effect of a single intervention, such as general walking groups, does not improve the reduction of falls-risk / falls-occurrence. In summary, the ‘Cochrane report’ by Gillespie et al (Gillespie et al.), effectively
demonstrated that certain exercise interventions are a successful means for reducing falls.
2.1.5 The gait cycle
24
Falls in older adults often occur during walking because the upper body mass is deftly balanced above a small support base, where balance can be easily perturbed. Body parts during walking can be described as gait trajectories in space and time. During temporal moments of the step cycle (period between the timing of consecutive, opposite-limb, heel contacts), gait trajectories representative of balance conditions can approach regions of instability. Small internal or external mechanical perturbations can lead to unbalanced upright posture and a fall. Describing the conditions for balance during this step period is similar to describing the very basic mechanical features of a ‘passive dynamic walker’ (e.g. McGeer, 1990). A ‘passive dynamic walker’ is a machine device composed of parts and joints that walk stably down a slope by transferring potential energy to kinetic energy, without any motor actuation or control. The ‘walker’ has a centre-of-mass positioned above two oscillating pendulums (sometimes designed with curved feet) that act to transfer body mass by acting as energy conserving inverted pendulums. The mass of the ‘passive dynamic walker’ is stabilised by an envelope region roughly the size of the changing contact area of the feet of the pendulum. In the ‘passive dynamic walker’ the centre-of-mass ‘vaults’ upwards and then ‘falls’
25
nominal trajectory from a set of candidate stable gait trajectories. In humans, the older adult body seems to face a parallel challenge when traversing in uneven terrain.
Understanding the challenges faced by older adults can be explored through some of the challenges of biped robot designers.
Leg swing performance is preceded by the initial conditions during the double support phase. A view for double support performance depends upon the initial
conditions created by the terminal motion of the leg swing. The double support phase is a task where the initial conditions of balance and momentum need to be created for facilitating the task needs of leg swing control.
2.1.6 Gait parameters associated with falls
The following research approaches have investigated the intrinsic risk factors to ascertain which parameters are best predictors of fallers. Hill et al. (1999) compared measures of balance, muscle strength, gait, fear of falling and general health in a multifactorial investigation. Included were healthy active community dwelling women aged at least 70 years (n = 96). In this study Hill et al. excluded participants who showed decreased sensory and cognitive functioning. From multivariate logistic regression analysis, measures of gait performance (gait asymmetry and double support time) were most strongly associated with multiple fallers. This supports the usefulness of gait as a movement task to screen for falls risk.
Hausdorff et al. (2001) conducted a 1 year prospective study by assessing multiple intrinsic factors similar to those listed in Table 2.1.3.1 and also conducted an
examination of specific walking parameters using average and standard deviation measures. Although the study did not report whether the sample of
community-dwelling older adults presented a history of falls prior to the study, the group displayed relatively normal measures of healthy functioning in a variety of attributes. During the follow up period, 40% of the group reported a fall and 75% of the falls occurred while walking. The authors did not report whether the fall was the result of a trip or slip. Measures of gender, age, mental health (depression), health status (number of medications), physical ability level (activities of daily living) were not significant
26
such as the physical performance test, average gait parameters (e.g. walking speed and swing time), functional balance and reach tests, and a timed up and go test did not show significance between fallers and non-fallers. However, the authors found similar results to Maki (1997), that increased gait variability was a significant indicator of future fall risk. An odds ratio analysis by Hausdorff et al. (2001) showed that a small increase in stride time and swing time variability can increase fall risk by a factor of five, and two, respectively. Of further interest, correlation analysis revealed that many of the intrinsic factors were significantly associated with gait variability, such as mental and general health status, balance ability, upper and lower body strength, ability to perform daily activities and functional tests. This study strongly supports the use of gait variability measures for fall risk assessment and the follow up of thorough investigations into the nature of gait variability. Hausdorff et al. (2001) conclude that gait variability appears to reflect disease processes rather than normal aging.
Studies show fear of falling is associated with reduction of walking speed (Tinetti, Richman and Powell, 1990; Maki, 1997) and a higher risk of falling (Maki, 1997).
However, it is unknown whether the outcome of a fear of falling produces a ‘safer’ walking pattern in the form of stable gait trajectories. The reduction in stride length and walking speed from a fear of falling has not demonstrated a reduction in subsequent falls (Maki, 1997; Hausdorff, 2007; Menz, Lord and Fitzpatrick, 2007). The general older adult population walks more slowly than young adults (Winter, 1991b; Prince,
27
(Kang and Dingwell, 2008a). The authors proposed that the cause of walking variability is not due to the gait regime, but stems from internal ageing processes in the musculo-skeletal systems, namely reduced muscle strength and joint range of motion.
In summary, the consequences of a fear of falling depend upon the severity invoked upon immobilisation. At best a fear of falling is necessary to reduce walking speed so as to help stabilise gait trajectories, but at worst it disables mobility and curtails quality of life. General measures of gait instability have a strong association with falls risk and it is difficult to know whether an ‘irrational’ fear of falling will negatively affect gait stability. The consequence of a reduced walking speed has conflicting outcomes because speed will affect the variability of different gait
parameters differently (Brach, Studenski, Perera, Vanswearingen and Newman, 2007a; Moe-Nilssen, Aaslund, Hodt-Billington and Helbostad, 2010).
2.1.7 Summary