International Journal of Wine Research
Self-reported consumption of wine and other
alcoholic beverages in a German wine area
Petra Fronk1
Maria Blettner2
Heinz Decker1
1Institute for Molecular Biophysics, Johannes Gutenberg University of Mainz, Mainz, Germany; 2Institute for Medical Biostatistics, Epidemiology and Informatics, Johannes Gutenberg University of Mainz, Mainz, Germany
Correspondence: Heinz Decker Jakob-Welder-Weg 26, D 55128 Mainz, Germany Tel +49 6131 392 3570 Fax +49 6131 392 3557 Email [email protected]
Purpose: To describe the consumption of alcoholic beverages in a German wine area, with special attention to the number of people drinking more than the tolerable upper alcohol intake level (TUAL).
Methods: A cross-sectional study was conducted using a mailed questionnaire, to investigate the weekly consumption of wine, beer, and spirits during the preceding 12 months in Mainz, the state capital of Rhineland-Palatinate, Germany. The analysis included 948 responders aged 20–69 years.
Results: A total of 948 respondents, with a mean age of 43.7 years, were included in the analysis. About 85% of the respondents consumed alcoholic beverages, with an average of about 13.5 g alcohol/day. Men drank about twice as much as women. In total, 30% of women and 24% of men reported drinking more than the TUAL, and 9.2% of women and 7.2% of men reported drinking more than twice as much as the TUAL. The highest proportion of persons drinking more than the TUAL was found among elderly people. The preferred beverage was wine, which contributed 74% (for women) and 54% (for men) to the total alcohol intake. On average, the respondents drank 2.8 glasses of wine per week, 1.4 bottles beer, and negligible amounts of spirits. Conclusion: Wine was the preferred alcoholic beverage in Mainz, which was expected for people living in a wine area. A rather large number of people, especially among the elderly, consumed alcohol in an amount higher than the TUAL which may be harmful to health. Keywords: beer, spirits, TUAL, Mainz
Introduction
Alcohol has been consumed all over the world for thousands of years.1−3 It is produced
by the fermentation of aging grapes and fruits. Throughout history, this natural process has been used and refined to obtain different alcoholic drinks. The reasons for their preferred consumption may be that these drinks were safer than water historically, in addition to their use for entertainment. With time, the quality of alcoholic drinks increased, and various different beverages are now available, such as beer, wine, and spirits. These are all produced in different ways, but a major difference is the alcohol content of the final products, which is about 4%–5% in beer, 10%–15% in wine, and more than 30% in spirits. Preferences for the various beverages vary between nations, regions, age, gender, and social classes.
The associations between alcohol and health have been investigated in many studies. Alcohol is thought to be responsible for damage to several organs, including the heart, pancreas, brain, nervous system, and liver, resulting in several severe and chronic dis-eases, such as liver insufficiency and cirrhosis or pancreatitis. Heavy alcohol drinking
Dove
press
O R I G I n A L R E S E A R C H
open access to scientific and medical research
Open Access Full Text Article
International Journal of Wine Research downloaded from https://www.dovepress.com/ by 118.70.13.36 on 23-Aug-2020
For personal use only.
Number of times this article has been viewed
This article was published in the following Dove Press journal: International Journal of Wine Research
is also related to an increased risk of various types of cancer, especially of the gastrointestinal tract.4−10 While several of
these diseases are thought to be a consequence of high levels of alcohol, some other scientific contributions suggest health benefits when moderate amounts of alcohol are consumed.11,12
The reasons behind this may be the tendency of alcohol to inhibit coagulation and to increase high-density lipoprotein (HDL)-cholesterol.13 But especially in wine, other
ingredi-ents than alcohol are described to have protective attributes, such as resveratrol and other polyphenols.14−18 However, the
continuing controversy seems especially to be related to the amount of alcohol consumed, the kinds of beverages, and drinking patterns in the different areas as well as many cofactors, such as smoking and eating habits. The factors are not completely understood yet.19−21
Tolerable upper alcohol intake levels (TUAL) were defined20 in order to provide an alcohol intake level that is
generally considered not to harm health. In Germany, for men, 20–24 g alcohol/day/person and for women 10–12 g alcohol/day/person was suggested.20
Our study focused on the alcohol consumption of adults in Mainz, the capital city of the state of Rhineland-Palatinate located in a wine area in Germany. We investigated the amount of consumed alcohol and the preferred alcoholic beverages as well as the number of people drinking more than TUAL, with respect to age and gender.
Methods
Study population and questionnaire
A cross-sectional study, to investigate the prevalence of wine intolerance, was conducted in 2010 in Mainz, Germany.22 In
this study, we analyzed the answers to the questions about the weekly consumption of alcohol (by wine, beer, and spirits) during the last year.
The study population was drawn from the Population Registration System in Mainz. A total of 4000 randomly
selected people aged between 20 and 70 years were asked to answer a mail questionnaire and a total of 1114 questionnaires were returned. Of these, 166 people were excluded due to at least one missing answer in the main question concerning alcohol consumption. For the final analysis, 948 questionnaires were included, which were the same people as in a previous analysis on intolerance against wine.22 The respondents included 429 (45.3%) men and 519
(54.7%) women, with a mean age of 43.7 years (Table 1). The study was approved by the Data Protection Officer of the Mainz University Medical Center and by the Ethics Committee of Rhineland-Palatinate.
Statistical analyses
The respondents were classified in age groups of 20–29, 30–39, 40–49, 50–59, and 60–69 years. Descriptive analyses were performed using tables and adequate figures. When consumption of alcohol between age groups was compared, a P-value based on the Mann–Whitney U test, was calcu-lated. As this was an explorative study, we have chosen not to employ the term “statistically significant” but rather, to discuss differences that cannot be explained by random variation only. Statistical analyses were performed with SPSS version 19.0 (IBM, Armonk, NY, USA) statistical software package for Windows.
Results
Abstainers
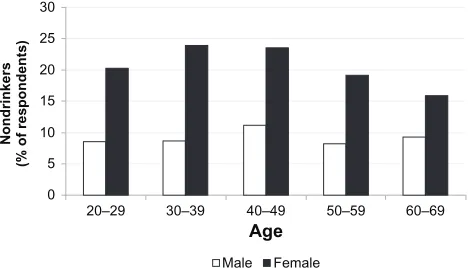
Of the 948 respondents, 148 (15.6%) reported consuming no alcohol at all. The percentage of these abstainers in relation to age and gender is shown in Figure 1. In total, about twice as many women (20.8%) compared with men (9.3%) did not drink alcohol. No association with age was observed for men; however, 24% of middle-aged women (30–39 years) reported abstention compared with 16% of elderly women (60–69 years).
Table 1 Age distribution of respondents, with respect to gender
Age Respondents Inhabitants of Mainz
Male Female Total Ratio* Male Female Inhabitants
20–29 82 123 205 5.3 17,280 21,366 38,646
30–39 69 105 174 6.0 14,673 14,210 28,883
40–49 107 115 222 7.4 15,456 14,466 29,922
50–59 85 94 179 7.3 11,921 12,716 24,637
60–69 86 82 168 8.6 9391 10,176 19,567
Total 429 519 948 6.7 68,721 72,934 141,655
Notes: The number of respondents and inhabitants of Mainz between the ages of 20 and 69 years are given. The age and sex distribution of the respondents was similar to the population of Mainz, with a slight underrepresentation of the younger age groups. *The ratio (given in per million) of respondents in each age cohort is given with respect to the inhabitants of Mainz within this age group; (Administration of the city of Mainz, Oct 31, 2010).
Dovepress
Fronk et al
International Journal of Wine Research downloaded from https://www.dovepress.com/ by 118.70.13.36 on 23-Aug-2020
Consumption of wine, beer, and spirits
A total of 800 respondents (84.4%) reported consuming alcoholic beverages. The majority (726) of people con-sumed wine, while 467 concon-sumed beer, and 172 concon-sumed spirits. The consumption of wine, beer, and spirits was compared with respect to age and gender (Tables 2 and 3). Table 2 includes all 948 respondents, ie, nondrinkers were also considered in the analysis. In contrast, Table 3 only considers respondents drinking alcohol. Men drank more than women with respect to beer and spirits (P , 0.01), while no difference was observed for wine consumption (P= 0.399).Wine
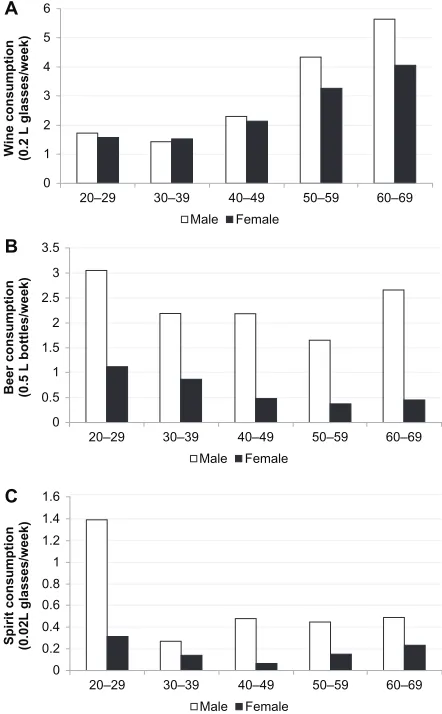
On average, of all respondents, men drank about 3.2 glasses wine per week and women about 2.4 glasses (Figure 2A). Wine consumption was highest in elderly people. While people younger than 40 years drank less than two glasses, people in the age group of 60 to 69 years had a wine consumption of about four (women) and 5.7 (men) glasses weekly.
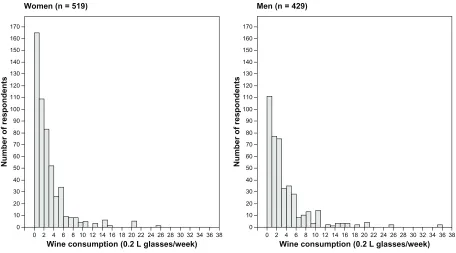
In all, 12% of male and 15% of female wine drinkers consumed more than seven glasses of wine per week. Four men and one woman reported drinking more than 21 glasses wine per week. The frequency distribution of wine consump-tion for women and men is shown in Figure 3.
Beer
Beer consumption (Figure 2B) decreased with age for women but not for men. On average men drank about three times more beer than women.
About 10% of male beer drinkers but less than 2% of female beer drinkers consumed more than seven bottles per week. More than 21 bottles per week was reported from four men and from one woman (less than 1%). Note, 66% of women did not consume any beer.
Spirits
Only 73 women (14%) and 99 men (23%) drank spirits (Figure 2C). Spirit consumption for women was much lower than for men in all age groups. It was highest for men between 20 and 29 years and dropped to a much lower level thereafter, remaining stable. Only nine men (2%) and no woman reported drinking more than seven glasses (2 cL) per week.
Preference and avoidance of alcoholic
beverages
In all, 30% of all respondents reported that they only drink wine (Figure 4); this habit was more frequent in women (37%) than in men (19%). Only a low percentage drank exclusively beer (4% of women and 7% of men). Almost no respondents consumed spirits as the only alcoholic drink. Wine seemed to be the only alcoholic beverage for about one-third of respondents, while beer seemed to be more of a substitute.
The avoidance of special beverages changed with age (Figure 5). Of all respondents, 23.4% (84 men and 138 women) did not drink any wine, 50.7% (139 men and 342 women) no beer, and 81.9% (330 men and 446 women) no spirits. Elderly people (60–69 years) consumed less beer and spirits than young people (20–29 years), independently of gender. Twice as many women as men did not drink beer. For wine, an association with age was observed: The number of non-wine drinkers strongly decreased with age, indepen-dently of gender.
Table 2 Consumption of wine, beer, and spirits by men and women, with respect to all respondents
Overall (n = 948) Men (n = 429) Women (n = 519)
Mean 95% CI Median Mean 95% CI Median Mean 95% CI Median
Wine 2.80 2.55 to 3.06 2.00 3.30 2.87 to 3.73 2.00 2.39 2.11 to 2.68 1.00
Beer 1.44 1.20 to 1.68 0.00 2.34 1.90 to 2.79 1.00 0.69 0.47 to 0.92 0.00
Spirits 0.38 0.27 to 0.49 0.00 0.62 0.38 to 0.86 0.00 0.19 0.13 to 0.24 0.00
Notes: Values are given in units of 0.2 L glasses of wine, 0.5 L glasses of beer, and 0.02 L glasses of spirits per person per week. Abbreviations: n, number; CI, confidence interval.
30
25
20
Nondrinkers
(% of respondents)
15
10
5
0
20–29 30–39 40–49
Male Female Age
50–59 60–69
Figure 1 Abstainers in relation to age and gender.
Dovepress Alcohol consumption in a German wine area
International Journal of Wine Research downloaded from https://www.dovepress.com/ by 118.70.13.36 on 23-Aug-2020
Alcohol consumption
Furthermore, we analyzed the amount of consumed alcohol with respect to age, gender, and beverages per day. The alcohol intake was calculated assuming an alcohol content of 17.6 g for 0.2 L wine (based on 11% [vol]), of 19.7 g for 0.5 L beer (based on 4.8% [vol]), and of 5.5 g for 0.02L spirits (based on 33% [vol]).
The alcohol intake (g alcohol/day/person) of wine, beer, and spirits, with respect to age and gender, is shown in
Tables 4 and 5. The mean values are given along with the 95% confidence interval (CI) as well as the median.
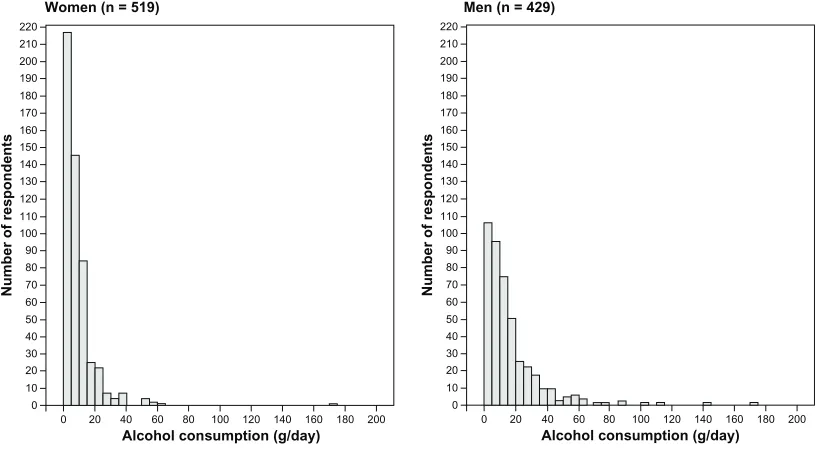
On average, the 948 participants consumed 11.4 g alcohol daily [CI: 10.4 to 12.4]. Men consumed 15.4 g/day [CI: 13.6 to 17.1], about twice as much as women, who consumed 8.1 g/day [CI: 7.1 to 9.1]. Due to a few very heavy drink-ers, the median was much lower: 10.7 g for men and 5.3 g alcohol per day for women. Among those who consumed alcohol, the median was 11.1 g/day for men and 7.5 g/day for women. The frequency distribution of the alcohol intake is shown in Figure 6.
Figure 7 summarizes the preferences for the alcoholic beverages wine, beer, and spirits, with respect to age and gender. It illustrates that wine increasingly contributed to the alcohol consumption with increasing age, while the contribution of beer decreased.
For both men and women, the total alcohol intake increased with age, with the exception of the youngest age group (Figures 7 and 8). For young men, beer accounted for most of the alcohol intake and was twice as high as the contribution of wine. However, for young women, the alcohol intake from wine and beer was almost the same. With increasing age, alcohol intake from wine increased (while beer decreased) for women and remained almost constant for men (Figure 8).
Alcohol consumption above the tolerable
upper alcohol intake level
The self-reported data on alcohol intake per day were classi-fied with respect to the TUAL (Figure 9; Tables 6 and 7). The majority of the respondents, about 66% of men (n = 285) and 49% of women (n = 254), were identified as moderate drink-ers, with an alcohol consumption lower than the TUAL.
Heavy drinkers
Among all participants of the study, 24% of men (n = 104) and 30% of women (n = 157) drank more than the TUAL and were therefore identified as heavy drinkers. Here, an asso-ciation with age was also observed (Figure 9 and Table 4); a total of 16% of young men and 22% of young women
6
5
4
Wine consumptio
n
(0.2 L glasses/week
)
3
2
1
0
20–29 30–39 40–49
Male Female
50–59 60–69
3.5
3 2.5
Beer consumptio
n
(0.5 L bottles/week)
2
1.5 1
0.5
0
20–29 30–39 40–49
Male Female
50–59 60–69
1.6 1.4
1
Spirit consumptio
n
(0.02L glasses/week)
0.8 0.6 1.2
0.4 0.2 0
20–29 30–39 40–49
Male Female
50–59 60–69
A
B
C
Figure 2 Consumption of alcoholic beverages with respect to age and gender. Notes: (A)Wine consumption (0.2 L glasses/week/person); (B) Beer consumption (0.5 L bottles/week/person); and (C) Spirit consumption (0.02 L glasses/week/ person).
Table 3 Consumption of wine, beer, and spirits by men and women, with respect to alcohol consumers only
Overall (n = 800) Men (n = 389) Women (n = 411)
Mean 95% CI Median Mean 95% CI Median Mean 95% CI Median
Wine 3.32 3.04 to 3.61 2.00 3.64 3.17 to 4.11 2.00 3.02 2.69 to 3.36 2.00
Beer 1.71 1.42 to 1.99 1.00 2.58 2.10 to 3.07 1.00 0.86 0.60 to 1.16 0.00
Spirits 0.45 0.32 to 0.58 0.00 0.68 0.42 to 0.94 0.00 0.24 0.17 to 0.30 0.00
Notes: Values are given in units of 0.2 L glasses of wine, 0.5 L glasses of beer, and 0.02 L glasses of spirits per person per week. Abbreviations: n, number; CI, confidence interval.
Dovepress
Fronk et al
International Journal of Wine Research downloaded from https://www.dovepress.com/ by 118.70.13.36 on 23-Aug-2020
drank more than the TUAL. These percentages increased with age, to about 40% for men and women in the age cohort of 60–69 years. Remarkably, among women, the percent-age of moderate drinkers and abstainers decreased, while the number of heavy drinkers increased; in contrast, among men, only the number of moderate drinkers decreased, while the number of heavy drinkers increased. The percentage of abstainers remained constant.
Very heavy drinkers
Results showed that 7.2% of men (n = 31) consumed more than twice the TUAL, and as many as 1.4% of men (n = 6)
consumed more than four times the TUAL, which corre-sponds to about one liter of wine per day (Table 4). A similar behavior was observed for women, with 9.7% (n = 48) and 1.5% (n = 8), respectively consuming those amounts.
Discussion
Our study investigated the alcohol consumption of wine, beer, and spirits, with respect to age and gender as well as the TUAL. This study was based on a questionnaire among the adult inhabitants of Mainz who were aged between 20 and 69 years. The city of Mainz is the state capital of Rhineland-Palatinate, which is one of the few members of the Great Wine Capitals global network23 and which can also be considered as
the wine capital in Germany. Mainz is located in the largest wine area of Germany.
Limitations and strength of our study
We cannot exclude the possibility that there was a strong selec-tion bias, due to the low response rate (23.7%) to the quesselec-tion- question-naire. Heavy drinkers may have participated less frequently in the study. There may also have been some information bias, as people may not recollect their alcohol consumption or may not report it correctly. Thus, lower values for alcohol consumption may have been given in the self-reported data. However, the age and sex distribution of our sample was similar to that of the general population of Mainz.38 36 34 32 30 28 26 24 22 20 18
Wine consumption (0.2 L glasses/week) Women (n = 519)
Number of respondents
16 14 12 10 8 6 4 2 0 0 10 20 30 40 50 60 70 80 90 100 110 120 130 140 150 160 170 38 36 34 32 30 28 26 24 22 20 18
Wine consumption (0.2 L glasses/week) Men (n = 429)
Number of respondents
16 14 12 10 8 6 4 2 0 0 10 20 30 40 50 60 70 80 90 100 110 120 130 140 150 160 170
Figure 3 Frequency distribution of the wine consumption among women and men.
Notes: Thehistograms show the wine consumption in classes of 0.2 L glasses per person and week (0–0.9, 1–1.9, 2–2.9 etc). The numbers refer to the overall respondents of 519 women and 429 men.
Abbreviation: n, number.
45 40 35 30 25 20
(%) of respondents
15 10 5 0 3 5 Only spirits 35 21 Only beer Female Male 83 200 Only wine
Figure 4 Respondents drinking exclusively wine, beer, or spirits, with respect to gender. Notes: Thenumber of people is given above the columns out of a total of 429 men (white bars) and 519 women (black bars).
Dovepress Alcohol consumption in a German wine area
International Journal of Wine Research downloaded from https://www.dovepress.com/ by 118.70.13.36 on 23-Aug-2020
Table 5 Alcohol intake (g per day per person) from wine, beer, and spirits by men and women, with respect to respondents consuming alcohol only
Overall (n = 800) Men (n = 389) Women (n = 411)
Mean 95% CI Median Mean 95% CI Median Mean 95% CI Median
Wine 8.35 7.64 to 9.07 5.03 9.15 7.98 to 10.32 5.03 7.60 6.75 to 8.45 5.03
Beer 4.80 4.01 to 5.59 2.81 7.27 5.91 to 8.63 2.81 2.46 1.68 to 3.25 0.00
Spirits 0.34 0.24 to 0.44 0.00 0.52 0.32 to 0.71 0.00 0.18 0.13 to 0.23 0.00
Total alcohol 13.49 12.38 to 14.61 8.56 16.94 15.07 to 18.80 11.11 10.24 9.05 to 11.43 7.54
Abbreviations: n, number; CI, confidence interval.
Table 4 Alcohol intake (g per day per person) from wine, beer, and spirits by men and women, with respect to all respondents
Overall (n = 948) Men (n = 429) Women (n = 519)
Mean 95% CI Median Mean 95% CI Median Mean 95% CI Median
Wine 7.05 6.41 to 7.69 5.03 8.29 7.20 to 9.39 5.03 6.02 5.30 to 6.74 2.51
Beer 4.05 3.37 to 4.73 0 6.59 5.34 to 7.84 2.81 1.95 1.32 to 2.58 0
Spirits 0.29 0.20 to 0.37 0 0.47 0.29 to 0.65 0 0.14 0.10 to 0.18 0
Total alcohol 11.39 10.40 to 12.38 7.54 15.35 13.60 to 17.11 10.66 8.11 7.10 to 9.12 5.33
Abbreviations: n, number; CI, confidence interval.
With a sample size of about 1000 persons, we are able to estimate a true prevalence rate of 20% with a 95% CI of 19%–21%; for a very small prevalence of 1%, the 95% CI would be 0.4 to 1.6.
Alcohol consumption
On average, in 1998, about 85% of female and 95% of male Germans aged between 18 and 79 years consumed alcoholic beverages, according to a survey in Germany that included various aspects of consumption of different alcoholic beverages.20 Our analysis focused on the consumption of
wine, beer, and spirits in a city located in the middle of a wine area. However, the percentages of alcohol consumers were slightly lower in Mainz, with 79% for women and 91% for men. However, the number of alcohol consumers was higher compared with a rural population in Galicia in northwestern Spain (which includes wine growing areas as well), where it was found that alcohol was consumed by 82.5% of the male and 51% of the female study population of 20- to 64-year-olds.24 The alcohol intake of the men in our study, with a
median of 10.7 g/day, was similar to that (9 g/day) found in the German National Food Consumption Survey, but the intake for the women in our study was higher (5.3 g in our study versus 2 g for the German population).25
Preference of beverages with respect
to gender and age
According to Burger and Mensink,20 the preferences of
Germans for wine, beer, and spirits depend on gender, and for women, these were 61.2%, 26.5%, and 12.4%, respectively
as opposed to 27.9%, 65.4%, and 6.8%, respectively for men. This is in contrast to the drinking behavior in Mainz. In our study of Mainz, wine was the preferred beverage for women as well as for men. For women, 74.2% of the alco-hol intake was of wine, 24.0% of beer, and 1.7% of spirits, whereas for men, the percentages were 54.0%, 42.9%, and 3.1%, respectively.
Further, a rather high percentage of the inhabitants in Mainz drank exclusively wine. A comparison with two other German cities, Heidelberg and Potsdam, revealed that the consumption of beer was far lower in Mainz, while slightly more wine was consumed in Heidelberg than in Mainz but less than half in Potsdam.26 In general, for Germany, the wine
consumption of 20.1 liter/year/person was lower compared with Mainz (29.1 liter/year/person).27 In addition, people
in Mainz drank much less beer than in the general German population (37.5 liter/year/person versus 109.6 liter/year/ person).
Thus, our study reveals an obvious difference in the drinking pattern between Germans in general and those living in the city of Mainz. This result might be explained by the fact that Mainz is located in a wine area, while the study by Burger and Mensink20 refers to Germany, including those
areas where beer is preferred. Therefore, our study supports the hypothesis that the drinking pattern depends much on the living environment.
With increasing age, more alcohol was consumed and wine was the preferred alcoholic drink for both men and women (Figure 4). Our study demonstrates that beer was the preferred alcoholic drink among young men, while older men
Dovepress
Fronk et al
International Journal of Wine Research downloaded from https://www.dovepress.com/ by 118.70.13.36 on 23-Aug-2020
200 180 160 140 120 100
Alcohol consumption (g/day) Women (n = 519)
Number of respondent
s 80 60 40 20 0 0 10 20 30 40 50 60 70 80 90 100 110 120 130 140 150 160 210 170 180 190 200 220
Men (n = 429)
200 180 160 140 120 100
Alcohol consumption (g/day)
Number of respondent
s 80 60 40 20 0 0 10 20 30 40 50 60 70 80 90 100 110 120 130 140 150 160 210 170 180 190 200 220
Figure 5 Frequency distribution of the alcohol intake among women and men. The histograms show the daily alcohol intake in classes of 5 g glasses per person per day. The numbers refer to the overall respondents of 519 women and 429 men.
Abbreviation: n,number.
90
70 60 50 40
% of respondents
30 20 80 10 0 Non-beer-drinkers Non-wine-drinkers 20–29 Non-spirit-drinkers
Men
60–69 90 70 60 50 40% of respondents
30 20 80 10 0 20–29
Women
60–69Figure 6 Comparison of non-wine, non-beer, and non-spirit drinkers in the youngest (20–29 years) and oldest age groups (60–69 years).
100% 60% 40% 20% 80% 0% Beer Wine
20–29 30–39 40–49 50–59 Spirits Men 60–69 100% 60% 40% 20% 80% 0% Beer Wine
20–29 30–39 40–49 50–59 Spirits Women
60–69
Figure 7 Preferences of alcoholic beverage.
Notes: Proportionsof wine (gray), beer (light gray), and spirits (black) are shown in relation to the total alcohol consumption, with respect to age and gender. Abbreviation: n, number.
Dovepress Alcohol consumption in a German wine area
International Journal of Wine Research downloaded from https://www.dovepress.com/ by 118.70.13.36 on 23-Aug-2020
15
10
Alcohol (g/day)
5 20 25
0 20–29
Wine Beer Spirits Total alcohol
30–39 40–49
Age
50–59 Men
60–69
15
10
Alcohol (g/day)
5 20 25
0
20–29 30–39 40–49
Age
50–59 Women
60–69
Wine Beer Spirits Total alcohol
Figure 8 Average alcohol intake from wine, beer, and spirits, with respect to age and gender.
80 70 60 50 40
Percentage (%)
30 20 10 0
>0–20 g alcohol/day 0 g alcohol/day
20–29
>20 g alcohol/day
30–39 40–49
Age Men
50–59 60–69
80 70 60 50 40
Percentage (%)
30 20 10 0
>0–10 g alcohol/day 0 g alcohol/day
20–29
>10 g alcohol/day
30–39 40–49
Age Women
50–59 60–69
Figure 9 Alcohol intake per day, for men and women, at different age cohorts.
Table 6 Alcohol consumption above TUAL, in men
Age group N (total) Abstainers #20 g .20 g .40 g .80 g
20−29 82 8.5% (n = 7) 75.6% (n = 62) 15.9% (n = 13) 4.9% (n = 4) 2.4% (n = 2) 30−39 69 8.7% (n = 6) 76.8% (n = 53) 14.5% (n = 10) 1.5% (n = 1) 0.0% (n = 0) 40−49 107 11.2% (n = 12) 68.2% (n = 73) 20.6% (n = 22) 5.6% (n = 6) 0.9% (n = 1) 50−59 85 8.2% (n = 7) 63.5% (n = 547) 28.2% (n = 24) 7.1% (n = 6) 1.2% (n = 1) 60−69 86 9.3% (n = 8) 50.0% (n = 43) 40.7% (n = 35) 16.3% (n = 14) 2.3% (n = 2) 20−69 429 9.3% (n = 40) 66.4% (n = 285) 24.2% (n = 104) 7.2% (n = 31) 1.4% (n = 6)
Notes: The values for alcohol consumption are given as g alcohol per day per person. The percentages refer to the total number of respondents of each age cohort. Abbreviations: TUAL, tolerable upper alcohol intake level; n, number.
Table 7 Alcohol consumption above TUAL, in women
Age group N (total) Abstainers #10 g .10 g .20 g .40 g
20−29 123 20.3% (n = 25) 58.5% (n = 725) 21.1% (n = 26) 4.1% (n = 5) 1.6% (n = 2) 30−39 105 23.8% (n = 25) 52.4% (n = 55) 23.8% (n = 25) 3.8% (n = 4) 1.9% (n = 2) 40−49 115 23.5% (n = 27) 42.6% (n = 49) 33.9% (n = 39) 4.4% (n = 5) 0.0% (n = 0) 50−59 94 19.1% (n = 18) 44.7% (n = 42) 36.2% (n = 34) 16.0% (n = 15) 1.1% (n = 1) 60−69 82 15.9% (n = 13) 43.9% (n = 36) 40.2% (n = 33) 23.2% (n = 19) 3.7% (n = 3) 20−69 519 20.8% (n = 108) 48.9% (n = 254) 30.3% (n = 157) 9.3% (n = 48) 1.5% (n = 8)
Notes: The values for alcohol consumption are given as g alcohol per day per person. The percentages refer to the total number of respondents of each age cohort. Abbreviations: TUAL, tolerable upper alcohol intake level; n, number.
Dovepress
Fronk et al
International Journal of Wine Research downloaded from https://www.dovepress.com/ by 118.70.13.36 on 23-Aug-2020
consumed much more wine than beer. This is in contrast to the general drinking pattern in Germany.20
The changes in the preferred beverage with age could be explained by varying taste preferences with age, as taste is considered to be the most frequent reason for drinking alcohol.28
Average alcohol consumption above
the tolerable upper alcohol intake level
It is of some concern that on average, 30% women and 24% men in Mainz drank more than the TUAL. This observation is in contrast to the situation among Germans, where fewer women (15.4%) are heavy drinkers than men (30.8%).20 Inthe population of northwestern Spain, a far higher percent-age of men (65%) compared with woman (20%) consumed alcohol in amounts higher than the reference level for alcohol intake, as well.24 In addition, among Germans, the
maximum average alcohol consumption higher than the TUAL was found in the middle age group between 45 and 54 years,20 whereas in Mainz, the maximum was found for
people in the age group of 60 to 69 years (about 40%). The high percentage is remarkable, and one may reconsider that this rate may even be higher due to a selection bias caused by the low response rate.
A similar drinking pattern was found for very heavy drinkers with more than twice the TUAL. A total of 10.6% of male and 5% female adult Germans belong to this group,20
which is different in Mainz. In Mainz, fewer men (7.2%) than women (9.2%) drink more than twice the TUAL, which cor-responds to about 5000 men and 6700 women. Thus, for a rather large number of persons, alcohol is of major concern, since drinking far above the TUAL is certainly harmful for health. We would like to note here that we did not ask whether the alcohol was consumed at one occasion (“binge drinking”) or distributed over the week.
Alcohol consumption and health
The high percentage of heavy drinkers in Germany and Mainz should be discussed in terms of the J-shaped rela-tionship between alcohol intake and mortality found in previous studies.11,29 These studies have demonstrated that
the relative risk of total mortality in men with a regular alcohol intake below 40 g is decreased, with a minimum ranging between 5–15 g alcohol/day/person, compared with that of abstainers. For women the risk increases with more than 25 g alcohol/day, which corresponds to twice the TUAL.
Regular consumption of alcohol is described to be harmful, causing liver cirrhosis and pancreatitis, and is also considered to be carcinogenic, especially for cancer in the mouth and esophagus, by the World Health Organization.4,6,9
The European Prospective Investigation into Cancer and Nutrition study came to a similar conclusion and revealed that alcohol increases the risk for cancer.8 However, Pinder30
recommended handling this study carefully, since several factors were not considered, such as the discrimination between moderate and strong drinkers and the influence of other risk factors, including smoking. The kind of beverages should also be taken into consideration when investigating the health effect of alcohol. For moderate wine consumption, benefits, especially for the cardiovascular system, have been described.11,13,29−37 This topic, however, was not the focus of
our study.
However, epidemiological investigation into the relation-ship between alcohol consumption, dietary habits in general, and diseases can be regarded as an important tool guiding dietary education policy.38
Social influence on the drinking pattern
A relative high alcohol consumption, as observed in Mainz, is often found in areas with high social/educational status and especially among women living in a city with more than 100,000 people.20 The latter observation is also the
case in Mainz, where a larger number of women drink more alcohol than the TUAL compared with men. Mainz has about 200,000 inhabitants and can be considered as a city with a high education level. It has universities and other research facilities, with more than 50,000 students and academic staff. Furthermore, these living conditions may also explain the low consumption of spirit drinkers in Mainz, since spirit consumption is higher among people with low education and income. The university city of Mainz has a very low unemployment rate that is lower than the German average.
Conclusion
Most people in Mainz consumed alcohol in moderate amounts. However, with increasing age, the alcohol intake increased as well as the number of people drinking above the TUAL. Specific prevention actions seem to be necessary. Wine was the preferred beverage, which was expected for people living in a wine area. Whether and in which way alcohol, especially wine, is harmful to health or might be beneficial among moderate drinkers will be shown by future studies.
Dovepress Alcohol consumption in a German wine area
International Journal of Wine Research downloaded from https://www.dovepress.com/ by 118.70.13.36 on 23-Aug-2020
Acknowledgments
This work was supported by the “Stiftung Rheinland-Pfalz for Innovation” (Project 929).
Disclosure
The authors report no conflict of interest in this work.
References
1. McGovern PE, Glusker DL, Exner LJ. Neolithic resinated wine.
Nature. 1996;381:480–481.
2. McGovern PE, Zhang J, Tang J, et al. Fermented beverages of pre- and proto-historic China. Proc Natl Acad Sci U S A. 2004;101(51): 17593–17598.
3. Kupfer P. [Wine route before silk route? - Wine cultures between Georgia and China]. In: König H, Decker H, editors. Kulturgut Rebe und Wein. 1st ed. Heidelberg: Spektrum Akademischer Verlag; 2012. German. Page 4–16.
4. Bagnardi V, Blangiardo M, La Vecchia C, Corrao G. A meta-anal-ysis of alcohol drinking and cancer risk. Br J Cancer. 2001;85(11): 1700–1705.
5. Boffetta P, Hashibe M. Alcohol and cancer. Lancet Oncol. 2006;7(2): 149–156.
6. Baan R, Straif K, Grosse Y, et al; WHO International Agency for Research on Cancer Monograph Working Group. Carcinogenicity of alcoholic beverages. Lancet Oncol. 2007;8(4):292–293.
7. Yu HS, Oyama T, Isse T, et al. Formation of acetaldehyde-derived DNA adducts due to alcohol exposure. Chem Biol Interact. 2010;188(3): 367–375.
8. Schütze M, Boeing H, Pischon T, et al. Alcohol-attributable burden of incidence of cancer in eight European countries based on results from prospective cohort study. BMJ. 2011;342:d1584.
9. Parkin DM. Cancers attributable to consumption of alcohol in the UK in 2010. Br J Cancer. 2011;105 Suppl 2:S14–S18.
10. Jin M, Cai S, Guo J, et al. Alcohol drinking and all cancer mortality: a meta-analysis. Ann Oncol. 2013;24(3):807–816.
11. Grønbaeck M, Becker U, Johansen D, et al. Type of alcohol consumed and mortality from all causes, coronary heart disease, and cancer.
Ann Intern Med. 2000;133(6):411–419.
12. Baliunas DO, Taylor BJ, Irving H, et al. Alcohol as a risk factor for type 2 diabetes: A systematic review and meta-analysis. Diabetes Care. 2009;32(11):2123–2132.
13. Di Castelnuovo A, Costanzo S, di Giuseppe R, de Gaetano G, Iacoviello L. Alcohol consumption and cardiovascular risk: mechanisms of action and epidemiologic perspectives. Future Cardiol. 2009;5(5): 467–477.
14. Guerrero RF, Garcia-Parrilla MC, Puertas B, Cantos-Villar E. Wine, resveratrol and health: a review. Nat Prod Commun. 2009;4(5): 635–658.
15. Pinder RM. Resveratrol comes of age. International Journal of Wine Research. 2010;2:43–44.
16. Kalantari H, Das DK. Physiological effects of resveratrol. Biofactors. 2010;36(5):401–406.
17. Shukla Y, Singh R. Resveratrol and cellular mechanisms of cancer prevention. Ann N Y Acad Sci. 2011;1215:1–8.
18. Li H, Xia N, Förstermann U. Cardiovascular effects and molecular targets of resveratrol. Nitric Oxide. 2012;26(2):102–110.
19. Klatsky AL, Friedman GD, Armstrong MA, Kipp, H. Wine, liquor, beer and mortality. Am J Epidemiol. 2003;158(6):585–595.
20. Burger M, Mensink GB. High alcohol consumption in Germany: results of the German National Health Interview and Examination Survey 1998.
Public Health Nutr. 2005;7(7):879–884.
21. Kloner RA, Rezkalla SH. To drink or not to drink? That is the question.
Circulation. 2007;116(11):1306–1317.
22. Wigand P, Blettner M, Decker H. Prevalence of wine intolerance: results of a survey from Mainz, Germany. Dtsch Arztebl Int. 2012;109(25): 437–444.
23. Great Wine Capitals Global Network [homepage on the Internet]. Bordeaux Cedex: Great Wine Capitals Global Network. Available from: http://greatwinecapitals.com/. Accessed May 13, 2013. 24. Jiménez-Contreras JF, Lendoiro-Otero R, García-Falcón MS,
Pérez-Lamela MC, Simal-Gándara J. The diet of the population of rural Galicia (NW Spain): nutritional quality of energy sources. Pandalai SG, editor: Recent Research Developments in Nutrition, Vol. 6 2004 pp. 1-14 (ISBN 81-7736-221-6).
25. Max Rubner Institute Food consumption study II. Karlsruhe : Max Rubner Institut; 2008. http://www.mri.bund.de/fileadmin/Institute/EV/ NVSII_Abschlussbericht_Teil_2.pdf
26. Sieri S, Agudo A, Kesse E, et al. Patterns of alcohol consumption in 10 European countries participating in the European Prospective Investigation into Cancer and Nutrition (EPIC) project. Public Health Nutr. 2002;5(68):1287–1296.
27. http://www.dhs.de [homepage on the Internet] Alkohol [Alcohol]. Deutsche Hauptstelle für Suchfragen (DHS); 2009. German. Available at: http://www.dhs.de/datenfakten/alkohol.html. Accessed May 13, 2013.
28. Moran CC, Saliba AJ. Reasons for drinking wine and other beverages – comparison across motives in older adults. International Journal of Wine Research. 2012;4:25–32.
29. Di Castelnuovo A, Costanzo S, Bagnardi V, Donati MB, Iacoviello L, de Gaetano G. Alcohol dosing and total mortality in men and women. An updated meta-analysis of 34 prospective studies. Arch Intern Med. 2006;166(22):2437–2445.
30. Thun MJ, Peto R, Lopez AD, et al. Alcohol consumption and mortal-ity among middle-aged and elderly US adults. N Engl J Med. 1997; 337(24):1705–1714.
31. Di Castelnuovo A, Rotondo S, Iacoviello L, Donati MB, de Gaetano G. Meta-analysis of wine and beer consumption in relation to vascular risk. Circulation. 2002;105(24):2836–2844.
32. Koppes LL, Dekker JM, Hendriks HF, Bouter LM, Heine RJ. Moderate alcohol consumption lowers the risk of type 2 diabetes. A meta- analysis of prospective observational studies. Diabetes Care. 2005; 28(3):719–725.
33. King DE, Mainous AG 3rd, Geesey ME. Adopting moderate alcohol consumption in middle age: subsequent cardiovascular events. Am J Med. 2008;121(3):201–206.
34. Joosten MM, Grobbee DE, van der A DL, Verschuren WM, Hendriks HF, Beulens JW. Combined effect of alcohol consumption and lifestyle behaviors on risk of type 2 diabetes. Am J Clin Nutr. 2010;91(6):1777–1783.
35. Pinder RM. Alcohol-attributable cancer: fact or fiction? International Journal of Wine Research. 2011;3:21–22.
36. Le Strat Y, Gorwood P. Hazardous drinking is associated with a lower risk of coronary heart disease: results from a national representative sample. Am J Addict. 2011;20(3):257–263.
37. Holahan CJ, Schutte KK, Brennan PL, et al. Wine consumption and 20-year mortality among late-life moderate drinkers. J Stud Alcohol Drugs. 2012;73(1):80–88.
38. Jiménez-Contreras JF, Lendoiro-Otero R, García-Falcón MS, Pérez-Lamela MC, Simal-Gándara J. Dietary habits of the population of rural Galicia (NW Spain): towards the development of a dietary education programme. Food Chem. 2006;97(1):32–40.
Dovepress
Fronk et al
International Journal of Wine Research downloaded from https://www.dovepress.com/ by 118.70.13.36 on 23-Aug-2020
International Journal of Wine Research
Publish your work in this journal
Submit your manuscript here: http://www.dovepress.com/international-journal-of-wine-research-journalisease-journal
The International Journal of Wine Research is an international, peer-reviewed open-access, online journal focusing on all sci-entific aspects of wine, including: vine growing; wine elabora-tion; human interaction with wine; and health aspects of wine. The journal provides an open access platform for the reporting
of evidence based studies on these topics. The manuscript management system is completely online and includes a very quick and fair peer-review system, which is all easy to use. Visit http://www.dovepress.com/testimonials.php to read real quotes from some of our published authors.
Dovepress
Dove
press
Alcohol consumption in a German wine area
International Journal of Wine Research downloaded from https://www.dovepress.com/ by 118.70.13.36 on 23-Aug-2020