c
Owned by the authors, published by EDP Sciences, 2017
Examination of the heavy-ion collisions using EPOS model in
the frame of BES program at RHIC
Maria Stefaniak1,aand Hanna Zbroszczyk1 1Warsaw University of Technology, Poland
Abstract. EPOS generator allows one to simulate various types of collisions (nuclei-nuclei or even more complex ion-ion) with different initial parameters. It is based on
Gribov-Regge theory. So far the EPOS model has been used to describe higher collision energies obtained with RHICbor LHCcdata. However, there is another program under investigation: Beam Energy Scan conducted at Brookhaven National Laboratory. The beams of gold ions are collided at energies such as √sNN−7.7,11.5,19.6,27,39, and
62.4 GeV in order to collect and analyze data needed to examine QGP Phase Diagram. The EPOS model could become a useful tool in such studies. Simulated with EPOS data will be verified using elliptic flow analyses and two-particles femtoscopic correlations, which allow one to measure the size of sources determined by newly created particle.
1 Introduction
One way to study the properties of the nuclear matter are collisions heavy-ions in major experiments. Scientists explain such processes in detailed theories. One of such descriptions is included in the phenomenological model EPOS. It considers the pardon-based Gribov-Regge theory [1]. EPOS gives possibility to study different observables what helps to understand even complex reactions with
heavy-ions. So far the EPOS model has been used to describe higher collision energies obtained with RHIC or LHC. However, there is another interesting program currently under investigation at RHIC: Beam Energy Scan (BES), conducted at Brookhaven National Laboratory. Main goals of this project are to examine the Phase Diagram, to study the characteristics of the first-order phase transition between Hadron Gas and Quark-Gluon Plasma phases of nuclear matter, to search signatures of turn-offthe
QGP. The search of Critical Point between first-order phase transition and transition of "cross-over" is another interesting topic. RHIC collides beams of Au nuclei at selected energies as: √sNN −
7.7,11.5,19.6,27,39, and 62.4 GeV. The variety of initial conditions provides covering as widest part of Phase Diagram of nuclear matter as possible.
2 EPOS
Energy conserving quantum mechanical multiple scattering approach, based onPartons (parton lad-ders),Off-shell remnants, andSplitting of parton ladders [1].
Figure 1: Hadron - hadron multiple scattering. Navy blue lines are hadrons and each of pink line illustrate Pomeron.[1]
EPOS is a generator based on Parton-Based Gribov-Regge Theory which is the mixture of two various theories. First one, Gribov-Regge theory uses effective field principies and it focuses
on soft aspects of particle collision. The interactions are described with theoretical objects calledPomerons, which are crucial in cal-culation the cross-section in multiple scattering (Figure 1). The eikonalized parton model introduces quarks and gluons, what re-sults with a more precise description of the interactions such as a gluon exchange. The QCD1 and QED2 are included in the
de-scription. [1] [2]
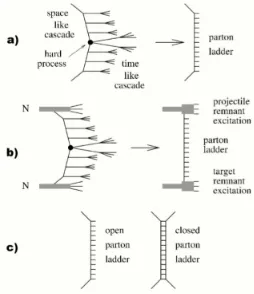
The combination of Gribov - Regge theory and parton model ensures that the energy is shared properly between both the particle production and the cross section. With the parton model there are hard processes added as well. The production of partons is repre-sented by Lund model strings [3]. There are introduced objects calledparton ladders. The open ones contribute to inelastic scattering which supports particles production. Meanwhile the closed ladders illustrates elastic scattering (Figure 2). In third version of EPOS there is applied the procedure consists hydrodynamic effects described in [4].
3 Beam Energy Scan program
Figure 2: a) Elementary parton - parton scattering and representation as parton ladder. b) Full presentation of scattering, completed with remnants. c) Open and closed parton ladder [2]
Beam Energy Scan is a project run on the RHIC com-plex. The main goal, besides investigation of properties of QGP, is to understand the QCD phase diagram struc-ture (Fig. [3]). Only a few pieces of information have been discovered yet. The QCD phase diagram is being mapped out in order to look for the evidences of:
• critical point fluctuations
• signals of 1storder phase transition
• turn-offthe signatures of QGP [5]
The gold ions are collided with such energies as:
√s
NN=7.7,11.5,19.6,27,39,62.4GeV.
One of the tools used with a view to studying occur-ring transitions of matter is femtoscopic correlations.
4 Femtoscopy correlations
4.1 Two-particle correlations
The method inspired by HBT3 interferometry [7]
fo-cuses on the smallest sizes in nature, about 10−15m (femtometre), the sizes of nuclei. Studies of
two-particle correlations allows one to examine space-time extension of the emitting source created during the collisions of nuclei. The size of area where the given kind of particles are produced is calledhomogeneity length[8].
Figure 1: Hadron - hadron multiple scattering. Navy blue lines are hadrons and each of pink line illustrate Pomeron.[1]
EPOS is a generator based on Parton-Based Gribov-Regge Theory which is the mixture of two various theories. First one, Gribov-Regge theory uses effective field principies and it focuses
on soft aspects of particle collision. The interactions are described with theoretical objects calledPomerons, which are crucial in cal-culation the cross-section in multiple scattering (Figure 1). The eikonalized parton model introduces quarks and gluons, what re-sults with a more precise description of the interactions such as a gluon exchange. The QCD1and QED2 are included in the
de-scription. [1] [2]
The combination of Gribov - Regge theory and parton model ensures that the energy is shared properly between both the particle production and the cross section. With the parton model there are hard processes added as well. The production of partons is repre-sented by Lund model strings [3]. There are introduced objects calledparton ladders. The open ones contribute to inelastic scattering which supports particles production. Meanwhile the closed ladders illustrates elastic scattering (Figure 2). In third version of EPOS there is applied the procedure consists hydrodynamic effects described in [4].
3 Beam Energy Scan program
Figure 2: a) Elementary parton - parton scattering and representation as parton ladder. b) Full presentation of scattering, completed with remnants. c) Open and closed parton ladder [2]
Beam Energy Scan is a project run on the RHIC com-plex. The main goal, besides investigation of properties of QGP, is to understand the QCD phase diagram struc-ture (Fig. [3]). Only a few pieces of information have been discovered yet. The QCD phase diagram is being mapped out in order to look for the evidences of:
• critical point fluctuations
• signals of 1storder phase transition
• turn-offthe signatures of QGP [5]
The gold ions are collided with such energies as:
√s
NN=7.7,11.5,19.6,27,39,62.4GeV.
One of the tools used with a view to studying occur-ring transitions of matter is femtoscopic correlations.
4 Femtoscopy correlations
4.1 Two-particle correlations
The method inspired by HBT3 interferometry [7]
fo-cuses on the smallest sizes in nature, about 10−15m (femtometre), the sizes of nuclei. Studies of
two-particle correlations allows one to examine space-time extension of the emitting source created during the collisions of nuclei. The size of area where the given kind of particles are produced is calledhomogeneity length[8].
1Quantum Chromodynamics 2Quantum Electrodynamic 3R. Hanbury-Brown and R. Q. Twiss
Figure 3:Studies of phase diagram peformed in a frame of BES program [6]
4.1.1 Correlation function
A two-particle correlation function defines ratio between probability of detecting two particles with given momenta and position simultaneously to product of detecting them separately [8].
C(p1,p2)= P2(p1,p2)
P1(p1)P1(p2) (1)
The source is often treated as a three-dimensional sphere and described with parametrization pro-posed by G. Bertsch and S. Pratt. The correlation function is represented in the -out -side -long (o-s-l) coordinate system [9]. Kopylov and Podgoretsky proposed the three-vectorq = p1−p2so that the
correlation function is represented in the following form:
C(qout,qside,qlong, λ)=1+λexp(−q2outr2out−q2sider2side−q2longr2long) (2)
where rout,side,longare lengths of the source inout,sideandlongdirections (three-dimensional
fem-toscopy radii) andλis a chaosity parameter [Fig. 4].
The out-direction width of the correlation function is inversely proportional to the lifetime of source (duration of particle emission). The side-direction measurements are inverse to the transverse size of source. The Rside and Rout are only proportional to the system average size or lifetime. The measurements of radii are affected by hydrodynamical flow or it depends on the chosen reference
frame. In order to make such effects more irrelevant or even cancel them out, one can study the ratio
Rout/Rside.The system size is approximately constant, while the lifetime of source varies depending on presense of a phase transition. Hence, theRout/Rsideis considered to be optimal in studies of the lifetime of the system [10].
Figure 4: Definition the three-dimensional
fem-Dealing with experimental data one has to parametrize the two-particle correlation func-tion with equafunc-tion:
C2(q)= A(B(q)q) (3)
5 Azimuthal anisotropy
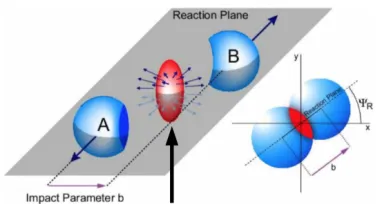
Figure 5:Nucleus after collision. The azimuthal anisotropy characterizes expansion
of highly-compressed matter created in heavy-ion collisions [Fig. 5]. It is one of the most signif-icant tool used in studying hot and dense matter, described more detailed in [11].
One of the standard methods used in order to cal-culate flow isevent plane method. The crucial part is to estimate the reaction plane from the measured particles. It is defined as aevent plane in range
Ψn(−π/n ≥ Ψn < π/n). For elliptic flown = 2 and in order to calculateevent planeone can use equation:
Φ2=tan−1 iwisin(2φi)
iwicos(2φi)
/2 (4)
where:i- selected particle,φi- azimuthal angle of particles,wi-weight ofiparticle [12]. In proposed η−submethod, from all measured particles there are selected two groups with "forward" and "back-ward" pseudorapidity with a gap between them. This method is introduced with a view to reducing the effect of "non flow" (e.g. decay of resonances to several charged daughter particles, jets or HBT
correlations). [13]
To express the observedv2of particles with respect to already investigated event plane one uses:
vobs2 (pT, y)=cos[2(φi−Φ2)] (5)
This is average over all particles in all events. As a consequence of final multiplicity limitation in the investigation of the angle of the reaction plane, the correction ofv2withevent planeresolution have
to be done.
R2=
cos[2(Φ2A−ΦB2)] (6)
where: ΦAn -event planecalculated only using "forward-pseudorapidity" particles whileΦBn - with
"backward-pseudorapidity" ones. The final result ofv2calculation is given by:
v2=
vobs2
R2 (7)
6 Results
There were three different kinds of analyze performed: one-particle analyze - pT spectra, azimuthal anisotropy -v2, two-particles analyze - femtoscopy correlations, in order to compare simulated and
experimental data.
6.1 Transverse momentum spectra
Transverse momentum distribution is one of the elementary tools in High-Energy analyze. In this examination it was used to make basic comparison between simulated and experimental data pub-lished in [14]. Such measurements were done for Au+Au collisions at two centrality ranges: 0−5%
(central) and 60%−80% (peripheral events). Particles with rapidity|y|<0.5 were taken into consid-eration. Below there are placed the obtainedpT distributions for h++h−
2 , the sum of positive-charged
5 Azimuthal anisotropy
Figure 5:Nucleus after collision. The azimuthal anisotropy characterizes expansion
of highly-compressed matter created in heavy-ion collisions [Fig. 5]. It is one of the most signif-icant tool used in studying hot and dense matter, described more detailed in [11].
One of the standard methods used in order to cal-culate flow isevent plane method. The crucial part is to estimate the reaction plane from the measured particles. It is defined as aevent plane in range
Ψn(−π/n ≥ Ψn < π/n). For elliptic flown = 2 and in order to calculateevent planeone can use equation:
Φ2=tan−1 iwisin(2φi)
iwicos(2φi)
/2 (4)
where:i- selected particle,φi- azimuthal angle of particles,wi-weight ofiparticle [12]. In proposed η−submethod, from all measured particles there are selected two groups with "forward" and "back-ward" pseudorapidity with a gap between them. This method is introduced with a view to reducing the effect of "non flow" (e.g. decay of resonances to several charged daughter particles, jets or HBT
correlations). [13]
To express the observedv2of particles with respect to already investigated event plane one uses:
vobs2 (pT, y)=cos[2(φi−Φ2)] (5)
This is average over all particles in all events. As a consequence of final multiplicity limitation in the investigation of the angle of the reaction plane, the correction ofv2withevent planeresolution have
to be done.
R2 =
cos[2(ΦA2−Φ2B)] (6)
where: ΦAn -event planecalculated only using "forward-pseudorapidity" particles whileΦnB - with
"backward-pseudorapidity" ones. The final result ofv2calculation is given by:
v2=
vobs2
R2 (7)
6 Results
There were three different kinds of analyze performed: one-particle analyze - pT spectra, azimuthal anisotropy -v2, two-particles analyze - femtoscopy correlations, in order to compare simulated and
experimental data.
6.1 Transverse momentum spectra
Transverse momentum distribution is one of the elementary tools in High-Energy analyze. In this examination it was used to make basic comparison between simulated and experimental data pub-lished in [14]. Such measurements were done for Au+Au collisions at two centrality ranges: 0−5%
(central) and 60%−80% (peripheral events). Particles with rapidity|y|<0.5 were taken into consid-eration. Below there are placed the obtainedpT distributions for h++h−
2 , the sum of positive-charged
hadrons (p, π+,K+) and negative once ( ¯p, π−,K−).
Figure 6: pT spectra for energies √sNN = 11.5,19.6,39GeV at 0−5% and 60%−80% centrality
ranges.
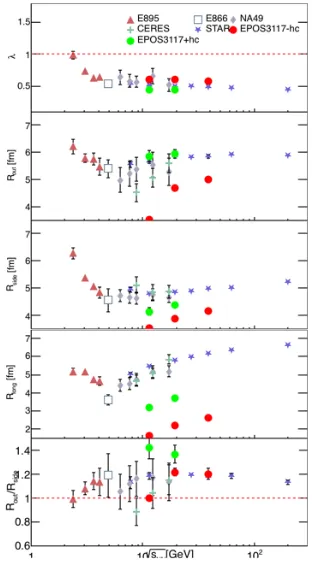
Figure 7:λand radii dependence on en-ergy √sNNfor different experiments and EPOS data (kT ≈0.225GeV/c). [15] There is high agreement between experimental and
theoretical data registered for the most central colli-sions. However, for lower energies for higher values ofpT the slopes of plotted data are slightly different. In case of peripheral collisions EPOS data based on fluid equations values are considerably lower.
6.2 Correlation function
In this research there was performed positively charged pions femtoscopic analysis in Au+Au collisions. In
or-der to study beam energy in femtoscopy the were cal-culated and parametrized three-dimensional correlation functions. Theπ+ pairs were taken into consideration at √sNN =11.5GeV 19.6 GeV at different centralities orkT ranges. With a view to inferring size of emitting source the fitting procedure was used (equation 2). Ob-tained radii andλparameter from calculation of simu-lated data were compared with published experimental results and presented in different combinations.
With the decrease of energy of collision √sNN the differences becomes more relevant. Calculated values
Figure 8: Radii calculated for various centralities andkT bins[15]
then simulated in EPOS. However, the most visible discrepancy is in studies ofRlong. In order to
explain these differences the elliptic flow analyze was performed.
It is possible in EPOS generator to turn offsome physics processes occur in heavy-ion collisions.
In order to study the impact of hadron cascades on size of emitting source, they were turn offand
turn on in simulation. The results are presented in Figure 7. Hadron cascades have relevant influence on values of calculated radii andλparameter. When they are present the size of the source is bigger and more similar to experimental studies. Theλparameter andRout are in the range of expectations, while rest of parameters are considerably lower then in experimental results. Too high value of ratio Rout/Rsidemeans that the liftime of the source is shorter for simulated collisions than those obtained in experiments.
6.3 Elliptic flow
The studies of the elliptic flow were preformed in order to examine the description of matter expansion included in EPOS model. The data simulated with the EPOS were compared with STAR results published in [13]. The studies of beam energy were performed at mid-rapidity region for p, ¯p,π+, π−,K+,K−at √sNN =11.5,19.6,39GeVin minimum bias (0−80%) usingη-method. Particles with
|η|<1, momentum between 0.15 and 5 GeV/c were taken into consideration. The calculated values
Figure 8: Radii calculated for various centralities andkTbins[15]
then simulated in EPOS. However, the most visible discrepancy is in studies ofRlong. In order to
explain these differences the elliptic flow analyze was performed.
It is possible in EPOS generator to turn offsome physics processes occur in heavy-ion collisions.
In order to study the impact of hadron cascades on size of emitting source, they were turn offand
turn on in simulation. The results are presented in Figure 7. Hadron cascades have relevant influence on values of calculated radii andλparameter. When they are present the size of the source is bigger and more similar to experimental studies. Theλparameter andRoutare in the range of expectations, while rest of parameters are considerably lower then in experimental results. Too high value of ratio Rout/Rside means that the liftime of the source is shorter for simulated collisions than those obtained in experiments.
6.3 Elliptic flow
The studies of the elliptic flow were preformed in order to examine the description of matter expansion included in EPOS model. The data simulated with the EPOS were compared with STAR results published in [13]. The studies of beam energy were performed at mid-rapidity region for p, ¯p,π+, π−,K+,K−at √sNN =11.5,19.6,39GeVin minimum bias (0−80%) usingη-method. Particles with
|η|<1, momentum between 0.15 and 5 GeV/c were taken into consideration. The calculated values
for pions and kaons coming from simulation are slightly higher than experimental data. The same tendency is visible for antiprotons. The elliptic flow of protons in allpT bins are comparable for both data sets.
Figure 9: Elliptic flow dependence onpT [13].
Figure 10: Elliptic flow dependence on pT [13].
7 Summary
The EPOS model predictions for Au+Au collisions at BES energy spectrum are verified with results
Figure 11: Elliptic flow dependence on pT [13].
References
[1] H.J. Drescher, M. Hladik, S. Ostapchenko, T. Pierog, K. Werner, Phys. Rept.350, 93 (2001),
hep-ph/0007198
[2] K. Werner, F.M. Liu, T. Pierog, Phys. Rev.C74, 044902 (2006),hep-ph/0506232
[3] M. Anderson, B. Pennington (1985)
[4] K. Werner, I. Karpenko, M. Bleicher, T. Pierog, S. Porteboeuf-Houssais, Phys. Rev.C85, 064907 (2012),1203.5704
[5] G. Odyniec,"results and future of beam energy scan program at rhic"
[6] D. Cebra,"exploring the qcd phase diagram: Rhic beam energy scan ii", http://www.c-ad.bnl.
gov/ardd/LEeC/Presentations/Cebra_LEReC_BESII_ver2.pdf, accessed: 2016-08-16
[7] U. Gordon Baym, University of Illinois, Hanbury brown – twiss intensity interferometry: from stars to nuclei to atoms and electrons, http://ithes.science-server.com/content/images/
colloquium/pdf/Baym.pdf, accessed: 2016-10-18
[8] M.A. Lisa, S. Pratt, R. Soltz, U. Wiedemann, Ann. Rev. Nucl. Part. Sci. 55, 357 (2005),
nucl-ex/0505014
[9] H. Tilsner, Ph.D. thesis, Heidelberg U. (2002),http://www.ub.uni-heidelberg.de/archiv/2474
[10] D.H. Rischke, M. Gyulassy (1996),9606039v1
[11] H. Masui, A. Schmah, A.M. Poskanzer, Nucl. Instrum. Meth.A833, 181 (2016),1212.3650
[12] S.A. Voloshin, A.M. Poskanzer, R. Snellings (2008),0809.2949
[13] L. Adamczyk et al. (STAR), Phys. Rev.C88, 014902 (2013),1301.2348
[14] S.P. Horvat (STAR), J. Phys. Conf. Ser.446, 012017 (2013),1303.7260
![Figure 3: Studies of phase diagram peformed in a frame of BES program [6]](https://thumb-us.123doks.com/thumbv2/123dok_us/8069568.1345767/3.482.159.323.75.226/figure-studies-phase-diagram-peformed-frame-bes-program.webp)
![Figure 8: Radii calculated for various centralities and kT bins[15]](https://thumb-us.123doks.com/thumbv2/123dok_us/8069568.1345767/6.482.105.373.82.325/figure-radii-calculated-various-centralities-kt-bins.webp)
![Figure 8: Radii calculated for various centralities and kT bins[15]](https://thumb-us.123doks.com/thumbv2/123dok_us/8069568.1345767/7.482.93.384.85.289/figure-radii-calculated-various-centralities-kt-bins.webp)
![Figure 11: Elliptic flow dependence on pT [13].](https://thumb-us.123doks.com/thumbv2/123dok_us/8069568.1345767/8.482.96.384.88.283/figure-elliptic-ow-dependence-on-pt.webp)
