Optimal Design of Red, Blue, and Far-Red LEDs Array
Yimin Zhou, Yiqing Xu, Zhiyue Ji, and Guoquan Zhou*
Abstract—An LED array with 2N −1 lines andN rows is designed, which consists of red, blue, and far-red LEDs. The red and blue LEDs with N lines andN rows are uniformly and intervally arranged. The central distance between adjacent red and blue LEDs isd. The far-red LEDs are filled in-between every two lines of red and blue LEDs, which results in an array of far-red LEDs with N −1 lines and
N rows. The central distance of adjacent far-red LEDs is also d. By using the imperfect Lambertian model, the irradiance distribution of the LED array with N being even and odd is derived in the reference plane, respectively. Also, solving equation of the optimal distanced is presented. Numerical results show that irradiance distributions of the three mixed-color, red, blue, and far-red lights of the LED array are uniform in the reference plane. Ratios ofR/B and R/F r are both relatively uniform in the reference plane. The ratio of R/B in the case of N being even is more uniform than that in the case ofN being odd. However, the ratio ofR/F r is opposite.
1. INTRODUCTION
The wavelength of light-emitting diode (LED) coincides with the spectral range of photosynthesis and the morphogenesis of plants. Therefore, LED can be used as an ideal light source for the cultivation of plants [1]. However, the irradiance of a single ultra-bright LED is not enough to the normal growth and development of plants [2]. Accordingly, an LED array, which is composed of many LEDs, has been designed to meet light requirements of plants. By treating each individual LED as an imperfect Lambertian emitter, six different LED array structures have been proposed, and the condition for uniform irradiance of LED arrays has been investigated in near field [3]. An LED array with surface-tailored lens has been presented to obtain the desired LED emission angle for uniform illumination distribution [4]. By using a regular LED array, uniform illumination has been rendered on the ceiling of a room [5]. A trial and error method has been proposed to obtain optimum LED-to-LED spacing of an LED array [6]. A numerical optimization method for designing LED array has been proposed to achieve a good uniform illumination distribution on a target plane [7]. All the above LED arrays consist of same color LEDs.
Chlorophyll is the main body of photosynthesis of plants. Chlorophyll A has a strong absorption peak at the wavelength of 640–660 nm. Chlorophyll B has a strong absorption peak at 430–450 nm. Therefore, the red and blue LED array can promote the growth of plants more than a monochrome LED array. For this reason, the red and blue LED array for greenhouse plant production has been designed and applied [8]. In the process of cultivation of plants, the height of plants is also very important. As far-red light can increase the content of gibberellins in plants, the length of internodes and height of plants naturally increase [9]. When transient far-red light is provided in the early dark period of plants, the photosensitive element Pfr is converted to photosensitive element Pr, which leads to the inhibition of plant flowers. Therefore, the addition of far-red LEDs in a red and blue LEDs array will fully promote the growth of plants. The purpose of this paper is to propose a red, blue, and far-red LEDs array. The arrangement of the LED array is also designed and optimized.
Received 20 November 2017, Accepted 14 February 2018, Scheduled 20 February 2018
* Corresponding author: Guoquan Zhou ([email protected]).
2. PROJECT DESIGN
As irradiance is important for the cultivation of plants, irradiance is used to do numerical calculation in the design of LED arrays. The irradiance distribution of a single LED can be described by an imperfect Lambertian distribution as follows [10]:
I(θ) =I0cosmθ, (1)
where θis the viewing angle, and I(θ) is the irradiance in the direction of the viewing angle. I0 is the irradiance on the optical axis. Parameterm is defined by [10]
m= −ln 2 ln(cosθ1/2)
, (2)
whereθ1/2 is defined as the view angle when the irradiance is half of the value at 0◦. Therefore,θ1/2 can
be called as half-irradiance angle. In a Cartesian coordinate system, a single LED is placed at point (xi,
yi,z). The irradiance over every point (x,y, 0) in the illumination reference plane can be expressed as
E(x, y,0) = zmI0
[(x−xi)2+ (y−yi)2+z2](m+2)/2. (3)
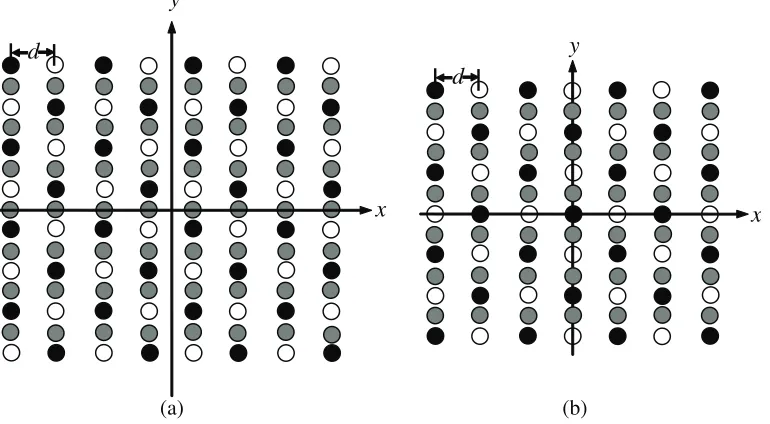
Irradiances on the optical axis of chosen red, blue, and far-red LEDs areI0r,I0b, and I0f, respectively. Parameters of chosen red, blue, and far-red LEDs are mr, mb, and mf, respectively. An LED array with 2N −1 lines andN rows is composed of red, blue, and far-red LEDs, which is as shown in Fig. 1.
N is even in Fig. 1(a) and odd in Fig. 1(b). The red and blue LEDs haveN lines andN rows. In each line and row, red and blue LEDs are uniformly and intervally arranged. The central distance between adjacent red and blue LEDs isdin each line and row. Far-red LEDs are filled in-between every two lines of red and blue LEDs. Accordingly, far-red LEDs have N −1 lines and N rows. In each line and row, the central distance of adjacent far-red LEDs is also d. Therefore, the centers of red, blue and far-red LEDs in each row are aligned. According to the practical demand, the LED array which is arranged by using the above method can be expanded vertically and horizontally. When the LED array expands, it does not change the uniformity of distributions of red, blue, and far-red lights.
Here, the unit of dis cm. As dis far larger than the wavelengths of LEDs, the interference effect is excluded in the irradiance which is used to perform calculation. When N is even, the irradiance at
d
y
x
d
x y
(a) (b)
point (x,y, 0) which is generated by all the red LEDs is given by
Er(x, y,0) = zmrI0r (N−2)/2
i=0
N/2
j=1
x−(4i−N+1)d
2
2
+
y−(4j−N−1)d
2
2
+z2
−(mr+2)/2
+zmrI0
r N/2
i=1 (N−2)/2
j=0
x−(4i−N−1)d
2
2
+
y−(4j−N+1)d
2
2
+z2
−(mr+2)/2 . (4)
The irradiance at point (x, y, 0) which is produced by all the blue LEDs turns out to be
Eb(x, y,0) = zmbI0b
(N−2)/2
i=0
(N−2)/2
j=0
x−(4i−N+1)d
2
2
+
y−(4j−N+1)d
2
2
+z2
−(mb+2)/2
+zmbI0b
N/2 i=1 N/2 j=1
x−(4i−N−1)d
2
2
+
y−(4j−N−1)d
2
2
+z2
−(mb+2)/2
. (5)
The irradiance at point (x, y, 0) which is stemmed from all the far-red LEDs yields
Ef(x, y,0) =zmfI0f
N/2
i=−(N−2)/2
(N−2)/2
j=−(N−2)/2
x−(2i−1)d
2
2
+ (y−jd)2+z2
−(mf+2)/2
. (6)
WhenN is odd, the irradiance at point (x,y, 0) which is produced by all the red LEDs turns out to be
Er(x, y,0) = zmrI0r
(N−1)/2
i=0
(N−1)/2
j=0
x−(4i−N+1)d
2
2
+
y−(4j−N+1)d
2
2
+z2
−(mr+2)/2
+zmrI0
r
(N−1)/2
i=1
(N−1)/2
j=1
x−(4i−N−1)d
2
2
+
y−(4j−N−1)d
2
2
+z2
−(mr+2)/2 , (7)
The irradiance at point (x, y, 0) which is stemmed from all the blue LEDs yields
Eb(x, y,0) = zmbI0b
(N−1)/2
i=1
(N−1)/2
j=0
x−(4i−N−1)d
2
2
+
y−(4j−N+1)d
2
2
+z2
−(mb+2)/2
+zmbI0b (N−1)/2
i=0
(N−1)/2
j=1
x−(4i−N+1)d
2
2
+
y−(4j−N−1)d
2
2
+z2
−(mb+2)/2 . (8)
The irradiance at point (x, y, 0) which is generated by all the far-red LEDs is found to be
Ef(x, y,0) =zmfI0f
(N−1)/2
i=−(N−1)/2
(N−1)/2
j=−(N−3)/2
(x−id)2+
y− (2j−1)d
2
2
+z2
−(mf+2)/2
. (9)
No matterN is even or odd, the total irradiance of the LED array at point (x,y, 0) is expressed as
E(x, y,0) =Er(x, y,0) +Eb(x, y,0) +Ef(x, y,0). (10) When distance d reaches an appropriate value, the total irradiance has a uniform distribution. This appropriate value ofdis called as optimal distance. The optimal distance is determined by
d2E(x, y,0)
dx2
x=0,y=0
The optimal distance is related toI0r,,I0b,I0f,mr,mb, andmf. WhenN is even, the optimal distance can be obtained by solving the following equation:
F(D) = (mr+2)I0r
(N−2)/2
i=0
N/2
j=1
h−ij(mr+4)/2−(mr+4)a2ih−ij(mr+6)/2D2
+(mr+2)I0r N/2
i=1 (N−2)/2
j=0
s−ij(mr+4)/2−(mr+4)c2is−ij(mr+6)/2D2
+(mb+2)I0b
(N−2)/2
i=0
(N−2)/2
j=0
t−ij(mb+4)/2−(mb+4)a2it−ij(mb+6)/2D2
+(mb+2)I0b N/2 i=1 N/2 j=1
u−ij(mb+4)/2−(mb+4)c2iu−ij(mb+6)/2D2
+(mf+2)I0f N/2
i=−(N−2)/2
(N−2)/2
j=−(N−2)/2
v−ij(mf+4)/2−(mf+4)(i−0.5)2v−ij(mf+6)/2D2 = 0, (12)
where coefficients hij,sij,tij,uij,vij,D,ai,aj,ci, and cj are defined as follow:
hij = (a2i +c2j)D2+ 1, sij = (c2i +a2j)D2+ 1, (13)
tij = (a2i +a2j)D2+ 1, uij = (c2i +c2j)D2+ 1, (14)
vij = [(i−0.5)2+j2]D2+ 1, D=d/z, (15)
ai = 4i−N2 + 1, aj = 4j−N2 + 1, (16)
ci = 4i−N2 −1, cj = 4j−N2 −1. (17) When N is odd, the optimal distance is given by solving the following equation:
F(D) = (mr+ 2)I0r
(N−1)/2
i=0
(N−1)/2
j=0
t−ij(mr+4)/2 −(mr+ 4)a2i t−ij(mr+6)/2D2
+(mr+ 2)I0r
(N−1)/2
i=1
(N−1)/2
j=1
u−ij(mr+4)/2−(mr+ 4)c2iu−ij(mr+6)/2D2
+(mb+ 2)I0b
(N−1)/2
i=1
(N−1)/2
j=0
s−ij(mb+4)/2−(mb+ 4)c2is−ij(mb+6)/2D2
+(mb+ 2)I0b
(N−1)/2
i=0
(N−1)/2
j=1
h−ij(mb+4)/2−(mb+ 4)a2ih−ij(mb+6)/2D2
+(mf + 2)I0f
(N−1)/2
i=−(N−1)/2
(N−1)/2
j=−(N−3)/2
w−ij(mf+4)/2−(mf + 4)i2w−ij(mf+6)/2D2 = 0, (18)
where the coefficient wij is defined by
wij = [i2+ (j−0.5)2]D2+ 1. (19) The ratio of the red irradiance to blue irradiance at the point (x,y, 0) yields
R/B=Er(x, y,0)/Eb(x, y,0). (20) The ratio of the red irradiance to far-red irradiance at the point (x,y, 0) turns out to be
3. NUMERICAL CALCULATIONS AND DISCUSSION
Typical values of the half-irradiance angle θ1/2 are 7.5◦, 15◦, 30◦, and 60◦, whose corresponding m
-parameters are 81, 20, 4.8, and 1. The red, blue, and far-red LEDs are chosen as follows. The shapes of red, blue, and far-red LEDs are circular. The half-irradiance angle, diameter, wavelength, and bandwidth of single red LED are 15◦, 5 mm, 637 nm, and 12 nm, respectively. Under the standard operating current 10 mA, Ir of the single red LED is 10cd. The half-irradiance angle, diameter, wavelength, and bandwidth of the single blue LED are 15◦, 5 mm, 459 nm, and 16 nm, respectively. Under the standard operating current 20 mA, Ib of single blue LED is 4cd. The half-irradiance angle, diameter, wavelength, and bandwidth of single far-red LED are 7.5◦, 5 mm, 735 nm, and 20 nm, respectively. Under the standard operating current 50 mA,If of single blue LED is 1.5cd. The central distance of adjacent far-red LEDs isd. However, the central distance between adjacent red LEDs is 2d, and adjacent blue LEDs have the same center distance. Therefore, the half-irradiance angle of selected red and blue LEDs is larger than that of the selected far-red LED.
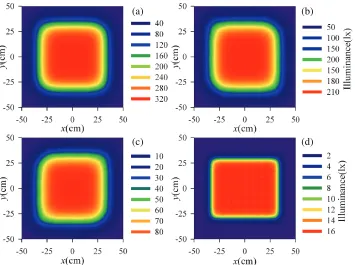
First, the case of N being even is considered. Without loss of generality, N is set to 8. By solving Equation (12), one can obtain the optimal distance D= 0.210355. The vertical distance of the selected illumination reference planez is 40 cm from the LED array. Fig. 2 shows the total, red, blue, and far-red irradiances of the LED array in the illumination reference plane. The maximum values of the total, red, blue, and far-red irradiances are about 326lx, 221lx, 88lx, and 16lx, respectively. The illumination area of the red light is the square region of 50 cm×50 cm. The same is true for the three mixed-color and blue areas. However, illumination area of the far-red light is a rectangular region of 40 cm × 36 cm. Irradiances of the three mixed-color, red, blue, and far-red lights appear uniformly distributed in most illumination areas. In order to further investigate the uniform distribution of each color light, the normalized irradiance distribution, ratio of R/B, and ratio of R/Fr in x-axis of the illumination reference plane for the LED array are shown in Fig. 3. Curves of the normalized irradiance distribution of the three mixed-color, red, and blue lights are coincident and show a flat top distribution.
(a) (b)
(c) (d)
(a) (b)
(c) (d)
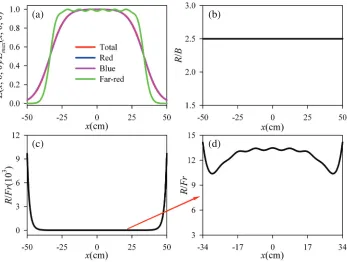
Figure 3. The normalized irradiance distribution, the ratio of R/B, and the ratio of R/Fr in the
x-axis of the illumination reference plane for the LED array. N = 8, D = 0.210355, and z = 40 cm. (a) Normalized irradiance distribution. (b)R/B. (c)R/Fr. (d)R/Fr.
The normalized irradiance distribution of the far-red light is also flat topped. Moreover, length of the flat top of the far-red light is longer than that for the three mixed-color, red, and blue lights. However, the normalized irradiance distribution of the far-red light has certain fluctuations in the flat top. The ratio of R/B is equal to 2.5 and keeps unvaried. The ratio of Ir/Ib of single red and blue LEDs under their standard operating current has the same value. The reason is that red and blue LEDs have the same half-irradiance angle and are uniformly arranged. As the illumination area of the red light is larger than that of the far-red light, the ratio of R/Fr is larger in two edges of the x-axis. The ratio of R/Fr
is relatively stable near the central area of thex-axis, but there is a slight fluctuation in the middle area of [−34 cm, 34 cm]. Figs. 2 and 3 indicate that the total, red, blue, and far-red irradiance distributions of the LED array are uniform whenN is even. The LED array has a uniform ratio of R/Band an ideal ratio of R/Fr in the illumination reference plane.
Finally, the case of N being odd is investigated. The LED array with N = 9 is considered.
D= 0.1559384 is obtained by solving Equation (18). The vertical distance of the selected illumination reference plane is still 40 cm from the LED array. The total, red, blue, and far-red irradiance distributions of the LED array are demonstrated in the illumination reference plane as shown in Fig. 4. The maximum values of the total, red, blue, and far-red irradiances are about 589lx, 400lx, 159lx, and 29lx, respectively. The maximum values of the total, red, blue, and far-red irradiances in the case of
(a) (b)
(c) (d)
Figure 4. The total, red, blue, and far-red irradiance distributions of the LED array in the illumination reference plane. N = 9, D = 0.1559384, and z = 40 cm. (a) Three mixed-color light. (b) Red light. (c) Blue light. (d) Far-red light.
(a) (b)
(c) (d)
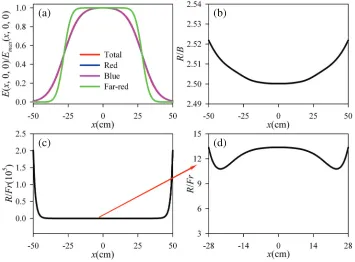
Figure 5. The normalized irradiance distribution, the ratio of R/B, and the ratio of R/Fr in the
the other three lights. The curve of the ratio of R/B is a parabola distribution. The ratio of R/B in
x = 0 is equal to 2.5. When the observation point gets away from x = 0, the ratio of R/B increases slowly. When x =±50 cm, the ratio of R/B reaches 2.5218. The ratio of R/Fr has two fluctuations in the range of [−28 cm, 28 cm]. Figs. 4 and 5 indicate that the total, red, blue, and far-red irradiance distributions of the LED array are also uniform when N is odd. Ratios of R/B and R/Fr of the LED array are uniform in the illumination reference plane. The ratio of R/B in the case of even number
N is more uniform than that in the case of odd number N. However, the ratio of R/Fr in the case of even numberN is less uniform than that in the case of odd numberN. It should be noted that the law obtained by numerical calculations is universal. The corresponding experiment will be done to support our numerical results. Also, the designed LED array will be used in the cultivation of plants. Due to the length of paper and length of cultivation test period, the experimental part is not reported here.
4. CONCLUSIONS
An LED array with 2N−1 lines andN rows is proposed, which consists of red, blue, and far-red LEDs. The red and blue LEDs have N lines and N rows. In each line and row, the red and blue LEDs are uniformly and intervallic arranged, and the central distance between adjacent red and blue LEDs isd. The far-red LEDs are filled in-between every two lines of red and blue LEDs. Therefore, the far-red LEDs haveN−1 lines and N rows. In each line and row, the central distance of adjacent far-red LEDs is alsod.
By using the imperfect Lambertian model of the irradiance distribution of a single LED, the irradiance distribution of the LED array with N being even or odd is derived in the illumination reference plane, respectively. Also, the determined equation of the optimal distancedis presented. The irradiance distribution, normalized irradiance distribution in thex-axis, ratio ofR/B in thex-axis, and ratio of R/Fr in x-axis of the LED array are numerically demonstrated in the illumination reference plane, respectively.
Numerical results show that the irradiance distributions of the three mixed-color, red, blue, and far-red lights are all uniform in the illumination reference plane. Ratios ofR/B and R/Fr in the x-axis are both relatively uniform in the illumination reference plane. The ratio of R/B in the case of even number N is more uniform than that in the case of odd numberN. However, the ratio ofR/Fr in the case of even numberN is less uniform than that in the case of odd number N. Therefore, the array of red, blue, and far-red LEDs is more suitable than the array of red and blue LEDs for the production of plants.
ACKNOWLEDGMENT
This research was supported by National Natural Science Foundation of China under Grant No. 11574272, and Zhejiang Provincial Natural Science Foundation of China under Grant No. LY16A040014.
REFERENCES
1. Bula, R. J., R. C. Morrow, T. W. Tibbits, and D. J. Barta, “Light-emitting diodes as a radiation source for plants,” Hort Sci., Vol. 26, 203–205. 1991.
2. Chen, J.-Y., J.-Y. Yeh, L.-W. Chen, Y.-G. Li, and C.-C. Wang, “Design and modeling for enhancement of light extraction in light-emitting diodes with archimedean lattice photonic crystals,” Progress In Electromagnetics Research B, Vol. 11, 265–279, 2009.
3. Whang, A. J. W., Y. Y. Chen, and Y. T. Teng, “Designing uniform illumination systems by surface-tailored lens and configurations of LED arrays,”J. Disp. Technol., Vol. 5, 94–103, 2009. 4. Yang, H., J. W. M. Bergmans, T. C. W. Schenk, J. P. M. G. Linnartz, and R. Rietman, “Uniform
5. Tan, J., K. Yang, M. Xia, and Y. Yang, “Analysis of uniform illumination system with imperfect Lambertian LEDs,” Opt. Appl., Vol. 41, 507–517, 2011.
6. Su, Z., D. Xue, and Z. Ji, “Designing LED array for uniform illumination distribution by simulated annealing algorithm,” Opt. Express, Vol. 20, 843–855, 2012.
7. Moreno, I., M. Avendaˇno-Alejo, and R. I. Tzonchev, “Designing light-emitting diode arrarys for uniform near-field irradiance,”Appl. Opt., Vol. 45, 2265–2272, 2006.
8. Zhou, G., J. Zhen, Y. Zhou, X. Chu, and Y. Ni, “Optimal design of LED assembled light source used in the production of greenhouse plant,”J. Optoelectron. Laser, Vol. 19, 1319–1323, 2008. 9. Heraut-Bron, V., C. Robin, C. Varlet-Grancher, D. Afif, and A. Guckert, “Light quality (red:
far-red ratio): does it affect photosynthetic activity, net CO2 assimilation, and morphology of young
white clover leaves?” Cana. J. Botany, Vol. 7, 1425–1431, 1999