427
STUDYING OF THE ENVIRONMENTAL CHANGES IN MARSH AREA USING LANDSAT SATELLITE IMAGES
Salah A. H. Saleh1
ABSTRACT
The marshes of Mesopotamia at the southern part of Iraq represent a unique component of our global heritage. During the last decades the Iraqi marshes subjected to many changes, these
changes have great impact on marshes environmental and ecosystem.
The goal of this research is to detect the environmental changes in Iraqi marshes that represented
main land cover in the area for the period 1973-2004, by using multi-temporal and multi-spectral satellite images. Landsat images have been used as a tool for detecting and studying land cover changes and its impact on the environment of Iraqi Marsh area.
The results showed that clear changes have occurred in the area, reducing in vegetation cover and
surface water area with increasing of barren dry and wet lands.
Key Words:Marsh of Iraq, Environmental changes, Land cover, NDVI , Landsat images
INTRODUCTION
Iraqi marshes were considered the largest wetland in the Middle East and characterized by varied environment such as rivers, lakes and vegetation covers. People lived in/around wetlands and interior of marshes, building reeds house on artificial floating island of reeds, moving around by boat, selling reed mats, and living on fish, water buffalo, and rice[3].
The wetlands are locations in which human civilization began with the Sumerian culture more than 5000 years ago. Scholars regard the marshes as the site of biblical "Garden of Eden" the "Great Flood" and the birthplace of the patriarch Abraham. On the shores the marshes the legendary Epic of Gilgamesh was enacted World- renowned archaeological sites on the fringes of the marshes including Ur, Lagash and Nina[7] .
1 College of Science University of Al-Nahrain E-mail: [email protected]
Journal of Asian Scientific Research
428 Iraqi marshes lies in the southern part of Iraq, the Iraqi marshes cut across three of Iraq's eighteen provinces: Misan (originally Al-Amarah), Dhi-Qar (originally Al-Nasiriyah), and Al-Basrah. The heartland of the marshes comprised three principal areas:
a-The Al-Hammar marshes are located south of the Euphrates, extending from near Al-Nasiriyah in the west to the outskirts of Al- Basrah on the Shatt Al-Arab .
b-The Central marshes located immediately above the confluence of the two Mesopotamian rivers, bounded by Tigris river to the east and the Euphrates river in the south, the area is roughly delimited by a triangle between Al-Nasiriyah, Qalat Saleh and Al-Qurnah.
c-The Al-Hawaizah marshes, located east of the Tigris river and extending into Iran (where they are known as the Al-Azim marshes).
Figure-1. location of study area[7].
DATA USED
Multi-temporal and Multi-Band Landsat images have used in this work as it shown in table (1).
IMAGES MOSAIC
429 Table-1. Landsat images used
Spatial Resolution(m) Bands Acquisition Date Data Type
80 1,2,4 1973 Landsat MSS 30 2,3,4 (7/9/1990) Landsat TM
120 6 (7/9/1990) Landsat TM path166 row38 120 6 (7/9/1990) Landsat TM path 166 row39 30 2,3,4 (26/3/2000) Landsat ETM+
60 6 (26/3/2000) Landsat ETM+ path 166row38 60 6 (26/3/2000) Landsat ETM+ path166 row39 30 1,2,3,4 (6/5/2003) Landsat ETM+ path166 row38 30 1,2,3,4 (6/5/2003) Landsat ETM+ path166 row39
60 6 (6/5/2003) Landsat ETM+ path166 row38
60 6 (6/5/2003) Landsat ETM+ path166 row39
30 1,2,3,4 (2/2/2004) Landsat ETM+ path166 row38 30 1,2,3,4 (2/2/2004) Landsat ETM+ path166 row39
60 6 (2/2/2004) Landsat ETM+ path166 row38
60 6 (2/2/2004) Landsat ETM+ path166 row39
Figure-2. Mosaic Landsat images for study
A- MSS , 1973 B- TM , 1990
430
IMAGE REGISTRATION
Registration is an important stage in the change detection technique using satellite data. Landsat ETM+ (2004) image have used as a reference image to register Landsat MSS (1973), Landsat TM (1990) and Landsat ETM+ (2000).
For Landsat MSS 1973 image registration (15) GCPs are selected, RMS error is 0.045 pixel. In case of Landsat TM (1990) image, (25) GCPs distributed on all image are used, RMS error is 0.64 pixel, and for Landsat ETM+(2000) image (25) GCPs distributed on the image are used with RMS error 0.069 pixel.
linear transformation (1st order polynomial) was applied . Nearest-neighbors method was used for resampling. Figure(3) shows an example of selection GCP on reference image (ETM+ 2004) and registered image (MSS 1973).
Figure-3. Distribution of the GCPs
A- Landsat image MSS (1973) B- ETM+(2004) (reference image)
IMAGE CLASSIFICATION
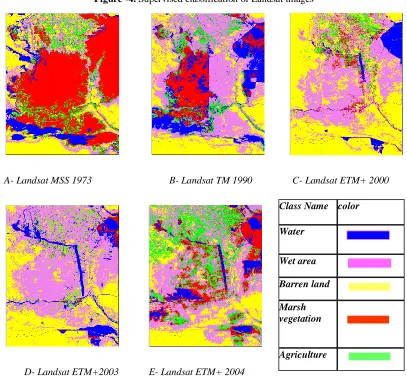
Classification is the process of grouping pixels or regions of the image into classes representing different ground-cover types. Both unsupervised and supervised classification techniques are used for Landsat images classification. The study area images were classified to five classes (water, wet land, barren land, marsh vegetation and agriculture) using supervised classification technique.
431 Figure -4. Supervised classification of Landsat images
A- Landsat MSS 1973 B- Landsat TM 1990 C- Landsat ETM+ 2000
D- Landsat ETM+2003 E- Landsat ETM+ 2004
Table-2 . Supervised classification statistics summery report for landsat images Landsat ETM Landsat
ETM Landsat
ETM Landsat
TM Landsat MSS 973 Color
Class Name
No. pixels No. pixels
No. pixels No. pixels
No. Pixels
856476 6.7% Water
Wet land
Barren land
color Class Name
Water
Wet area
Barren land
Marsh vegetation
432 Marsh vege
Agri. land
Figure-5. Comparative analysis for (1973-2004) land cover classes
It is clear from the above result that the marsh vegetation and water areas started to decrease since year 1990 and reach the lowest value in year 2000 because the desiccation marshes. This desiccation causing increase the barren and wet area, so that in year 2000 barren area increase by 24.8% more than year 1990. Re-flooding the marshes in mid of year 2003 increase the water area by about4.3% more than year 2000
NORMALIZED DIFFERENCE VEGETATION INDEX (NDVI)
Normalized difference vegetation index has been found to be good indicator for vegetation and land use/ land cover changes. It has been found that clear correlation between NDVI and surface temperature. NDVI can be computed from this formula [1].
Near IR band – Red band
NDVI = --- --- (1) Near IR band + Red band
The original NDVI had the values between -1 and +1, but we transformed NDVI values into 8 bit (0 – 255) using this equation:
NDVI – MIN
Scaled NDVI = ( --- ) * 255 ---(2) MAX − MIN
0.00% 10.00% 20.00% 30.00% 40.00% 50.00% 60.00%
water wet area barren area marsh veg. agri. Area
class name
p
er
ce
n
tage
N
o.
p
ixe
ls
433 Where NDVI = is the range -1 to +1, Min = Minimum value of NDVI and Max = Maximum value of NDVI.
The NDVI image computed from Landsat MSS 1973, Landsat TM (1990), Landsat ETM+ (2000), Landsat ETM+ (2003), Landsat ETM+(2004) images shows in figure(6 ) ,
Figure-6. NDVI ratio images from Landsat data
A- MSS 1973 B- TM 1990 C- ETM+ 2000
434 Table-3. Average NDVI for land use classes
Class Name NDVI
scaled NDVI value NDVI scaled NDVI value NDVI scaled NDVI value NDVI scaled NDVI value NDVI scaled NDVI value
- 34 -0.56 56 - 0.48 - 0.41 75 - 0.07 118 Water -Wet land -0.121 Barren Marsh veg Agriculture
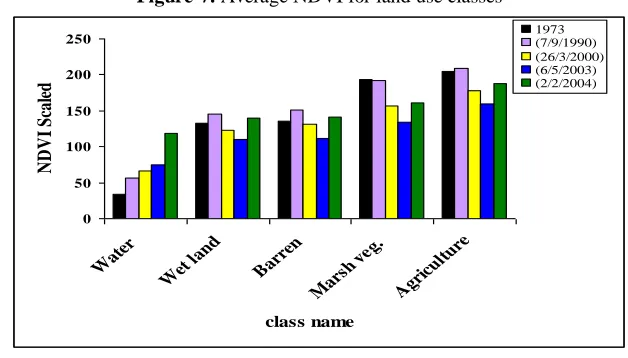
Figure-7. Average NDVI for land use classes
Table 3 and figures 6 and 7 shows that vegetation area(such as marsh vegetation and agriculture) had the highest NDVI value. While other areas (wet soil, barren) had the lowest NDVI because there were just a few green spaces in the area.
CONCLUSIONS
1- Environmental changes in Iraqi marsh during the period 1973-2004, effects on vegetation and water (ecosystem). Clear changes have occurred in marsh draining, reducing vegetation and water with increasing in barren and wet lands.
2- The results show that marsh vegetation decreased about 30.10% in year 1990, 40% in year 2000, 43.2% in year 2003, 30.10% in year 2004; comparable with year 1973. While wet area increase about 23.90%, 23.00%, 36.50% , 23.70% for years 1990, 2000, 2003 and 2004 respectively
0 50 100 150 200 250 Wat er
Wet l and
Bar ren
Mar sh ve
435 comparable with year 1973. Barren area increase about (1.20 -26.00)% during the period
1990-2000, after that decrease when re-flooding marshes.
REFERENCES
Gallo, K. P., McNab, A. L., Karl, T. R., Brown, J. F., Hood, J. J., and Tarpley, J. D.,(1993b) The use of a vegetation index for assessment of the urban heat island effect ,International Journal of Remote Sensing, 14, 2223–2230.
Gillies, R. R., and Carlson, T. N., (1995) Thermal remote sensing of surface soil water content with partial vegetation cover for incorporation into climate models. Journal of Applied Meteorology, 34, 745–756.Iraq-Marsh Arabs, available on line at: http://homepage.mac.com/weblink/Iraq/p05-MarshArab.htm
Jensen J.R., (2000)"Remote sensing of the environment: An earth resource perspective", Upper Saddle River., NJ: Prentice Hall Maarten Z., Elisabeth A.,(2005)"Remote Sensing a tool for Environmental Observation" Utrecht University, the Netherlands.
Myung H.J., and et al (2006) " The extraction method of surface temperature in agriculture area using Satellite Remote Sensing and GIS", Kyungil University, available on line at:
www.gisdevelopment.net/application/agricultyure/overview/agrio012.htm-19k.
Schott, J.R. & Volchock, W.J. (1985) Thematic Mapper infrared calibration. - Photogramm. Eng. Remote Sensing , 51, 9, p. 1351 - 1357, Falls Church, VA.
UNEP (2005)"Iraqi Marshlands monitoring Reflooding and vegetation change", available on line at :
http://imos.grid.unep.ch/unloads/050902.pdf.