Article
BrassicaEDB: A gene expression database for
Brassica
crops
Haoyu Chao1,2,†, Tian Li3,4,†, Chaoyu Luo1,†, Hualei Huang5, Yingfei Ruan3,4, Xiaodong Li1,6, Yue Niu1,6, Yonghai Fan1,6, Wei Sun1,6, Kai Zhang1,6, Jiana Li1,6, Cunmin Qu1,6, Kun Lu1,6*
1 College of Agronomy and Biotechnology, Southwest University, Beibei, Chongqing 400715, China; [email protected] (H.C.); [email protected] (C.L.); [email protected] (X.L.); [email protected] (Y.N.); [email protected] (Y.F.); [email protected] (W.S.); [email protected] (K.Z.); [email protected] (J.L.); [email protected] (C.Q.); [email protected] (K.L.)
2 Institute of Innovation & Entrepreneurship, Southwest University, Beibei, Chongqing 400715, China 3 State Key Laboratory of Silkworm Genome Biology, Southwest University, Chongqing 400715, China;
[email protected] (T.L.); [email protected] (Y.R.)
4 Chongqing Key Laboratory of Microsporidia Infection and Control, Southwest University 400715, Chongqing, China
5 Institute of Characteristic Crop Research, Chongqing Academy of Agricultural Sciences, Chongqing 402160, China; [email protected] (H.H.)
6 Academy of Agricultural Sciences, Southwest University, Beibei, Chongqing 400715, China † These authors contributed equally to the work.
* Correspondence: [email protected]; Tel./Fax: +86-23-6825-1264
Abstract: The Brassica family contains several economically important crops, including rapeseed (Brassica napus, 2n = 38, AACC), the second largest source of seed oil and protein meal worldwide. However, research in rapeseed is hampered because it is complicated and time-consuming for researchers to access different types of expression data. We therefore developed the Brassica Expression Database (BrassicaEDB, https://biodb.swu.edu.cn/brassica/) for the research community. We conducted RNA sequencing (RNA-Seq) of 103 tissues from rapeseed cultivar ZhongShuang11 (ZS11) at seven developmental stages (seed germination, seedling, bolting, initial flowering, full-bloom, podding, and maturation). We determined the expression patterns of 101,040 genes via FPKM analysis and displayed the results using the eFP browser. We also analyzed transcriptome data for rapeseed from 70 BioProjects in the SRA database and obtained three types of expression level data (FPKM, TPM, and read counts). We used this information to develop the BrassicaEDB, including eFP, Treatment, Coexpression, and SRA Project modules based on gene expression profiles and Gene Feature, qPCR Primer, and BLAST modules based on gene sequences. The BrassicaEDB provides comprehensive gene expression profile information and a user-friendly visualization interface for Brassica crop researchers. Using this database, researchers can quickly retrieve the expression level data for target genes in different tissues and in response to different treatments to elucidate gene functions and explore the biology of rapeseed at the transcriptome level.
Keywords: BrassicaEDB; Brassica napus; gene expression profile; coexpression
1. Introduction
With the availability and low cost of next-generation sequencing (NGS) technologies, genome-wide omics datasets are currently being generated at higher frequencies than ever before. These resources have rapidly expanded our knowledge of functional genomics in both animals and plants [1]. However, the storage, analysis, management, and maintenance of the massive quantities of data produced by NGS remain quite challenging.
In response to accumulating NGS-generated data, various bioinformatics databases have become popular, such as the Gene Expression Omnibus (GEO) from NCBI and ArrayExpress from EBI [2–3]. Among the multiple plant omics datasets, transcriptomic data provide important clues to help predict gene function or reveal hidden molecular mechanisms based on gene expression profiles [4]. Large-scale transcriptome analyses in plants have also led to the development of databases such as PlantExpress [5].
RNA sequencing (RNA-Seq) has emerged as an important approach for comprehensive gene expression analysis at the transcriptome level. RNA-Seq has several advantages over other techniques [6]. RNA-Seq can be used to comprehensively measure the expression levels of all transcripts in a plant tissue without the need to design probes. Since the emergence of RNA-Seq, RNA-Seq data are continuously being deposited into public databases, such as the NCBI Sequence Read Archive (SRA) database [7]. Other important databases housing large-scale RNA-Seq data from the animal and plants fields include Silk DB, Melonet-DB, and ePlant [8–10]. However, a gene expression database for Brassica crops based on RNA-Seq is still lacking.
Rapeseed (Brassica napus, 2n = 38, AACC), an important oilseed crop in the Brassica family, is an amphidiploid with an A subgenome originating from Brassica rapa (2n = 20) and a C subgenome originating from Brassica oleracea (2n = 18). Since genomic information for rapeseed first became publicly available [11], numerous transcriptome studies have been conducted to enhance our understanding of gene function in this important crop. However, these gene expression datasets remain to be further integrated and explored.
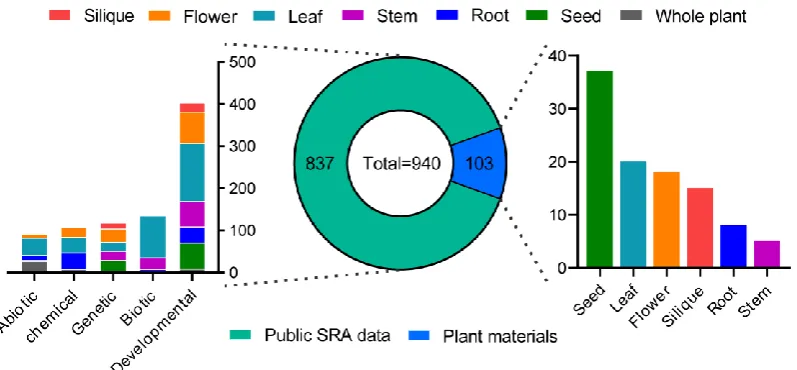
Here, we constructed the online database Brassica Expression Database (BrassicaEDB). We generated a large-scale gene expression profile of rapeseed based on RNA-Seq data obtained from 103 tissues from rapeseed cultivar ZS11 during seven developmental stages (germination, seedling, bolting, initial flowering, full-blooming, podding, and maturation) (Figure 1). We chose this elite cultivar for its ultra-high oil content, high lodging resistance, high disease resistance, and low erucic acid and glucosinolate levels, as well as its broad eco-physiological adaptation to different climatic
conditions worldwide [12]. We utilized the “Electronic Fluorescent Pictograph” (eFP) browser on our
website [13], allowing users to comprehensively view gene expression levels during tissues at various stages of development. To ensure that transcriptome data stored in the SRA database could be further mined and integrated, we also analyzed the transcriptome data from 70 BioProjects, which were obtained from 837 samples related to rapeseed in the SRA database (Figure 1). Three types of gene expression values (FPKM, TPM, and read counts) are provided in the BrassicaEDB. Finally, we developed the eFP, Treatment, Coexpression, and SRA Project modules based on gene expression profiles and the Gene Feature, qPCR Primer, and BLAST modules based on gene sequences, providing powerful tools for comprehensive gene expression analysis in rapeseed [14–15].
2. Results
2.1. RNA-Seq-based global expression data from 103 rapeseed samples
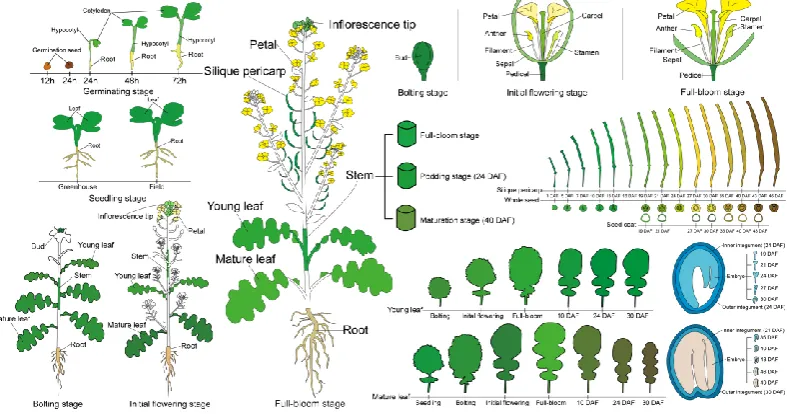
To obtain global expression data for rapeseed, we collected tissue samples from rapeseed cultivar ZS11, including seedlings grown in the greenhouse and plants grown in the field from late autumn to early summer, and performed RNA-Seq of 103 different tissues (Table S1). These tissues included seedling roots (sRo), hypocotyls (Hy), cotyledons (Co) (24, 48, and 72 hours after germination; HAG), and germinating seeds (GS) (12 and 24 HAG); roots (Ro) and mature leaves (ML) at the seedling stage; Ro, stems (St), young leaves (YL), ML, buds (Bu), and inflorescence tips (IT) at the bolting stage; Ro, St, YL, ML, pedicels (Ped), IT, sepals (Sep), petals (Pe), carpels (Ca), stamens (Sta), anthers (An), and filaments (Fi) at the initial bloom and full-bloom stages; ML and YL at 10, 24, and 30 days after flowering (DAF); seeds (Se) and silique pericarps (SP) at 15 and 12 regular intervals between 3 and 46 DAF; embryos (Em) and seed coats (SC) at ten stages of seed development (19 to 49 DAF); inner integuments (InI) at 21 and 24 DAF; and outer integuments (OuI) at 24 and 30 DAF (Figure 2). For each sample, two biological replicates, each obtained from three independent plants, were collected for RNA-Seq.
Figure 2. A cartoon illustrating 103 rapeseed ZS11 plant tissue samples used for RNA-seq analysis. These include Se (12 and 24 HAG), Co, Hy and sRo (24, 48 and 72 HAG) at germination stage; YL, ML and Ro at seedling stage; Ro, St, YL, ML, Bu at bolting stage; Ro, St, YL, ML, Ped, IT, Sep, Pe, Ca, Sta, An and Fi at initial bloom stage and full-bloom stage; ML, YL at 10, 24 and 30 DAF; Se and SP at 3-46 DAF; Em, SC at 19-49 DAF; InI at 21 and 24 DAF and OuI at 24 and 30 DAF.
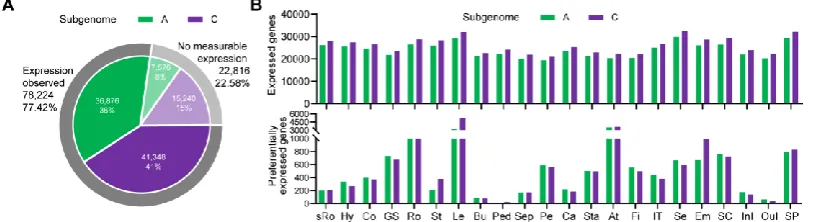
Using the Illumina HiSeq 2500 platform (Illumina Inc., San Diego, CA), we obtained 125 bp of paired-end read data. Using rapeseed genome v.4.1 as a reference, 101,040 genes were used to calculate the fragments per kilobase million (FPKM) in each sample. The average expression values from two biological replicates were summarized in a gene expression matrix 103×101,040 in size. In the 103 samples, 78,224 expressed genes were transcribed (the sum of gene expression values was > 1 for 103 samples) (Figure 3A). We calculated the number of expressed genes in the A and C subgenomes separately (the sum of gene expression values was > 1 in each tissue group) and calculated the number of preferentially expressed genes using the DESeq2 package in R (adjusted p-value < 0.05 and log2|fold change| > 1) (Figure 3B). We performed principal component analysis (PCA)
based on the 103 samples (Figure S1). All genes were expressed at values of FPKM > 1 in each sample. The expression values of 22,547 genes were standardized using Log2(FPKM+1) and subjected to PCA
Figure 3. Statistics of expressed genes in A and C sub-genomes in rapeseed. (A) Gene expression number in the A and C sub-genomes. The number of genes with expression observed was 78224, in which the A sub-genome included 36876 genes (36%) and the C sub-genome included 41348 genes (41%). The number of genes with no measurable expression was 22816, in which the A sub-genome included 7576 genes (8%) and the C sub-genome included 15240 genes (15%). (B) Gene expression and preferentially expression number. The upper bar chart shows the number of expressed genes in 22 tissue groups. The lower bar chart shows the number of preferentially expressed genes in 22 tissue groups. Green represents the A sub-genome and purple represents the C sub-genome.
2.2. RNA-Seq-based global expression data from 103 rapeseed samples
To provide users with multiple data types, we downloaded raw transcriptome data for 70 BioProjects from the NCBI SRA database, analyzed the expression patterns of 101,040 genes in 837 samples by RNA-Seq, and determined the FPKM, Transcripts Per Million (TPM), and read counts values of each gene. In total, we generated three 837×101,040 gene expression profiles. We also annotated 837 samples with BioProject IDs and run IDs from the NCBI SRA database and provided descriptions of the project, cultivar, sampling stage, sampling tissue, condition, treatment type, treatment reagent, treatment time, PubMed ID, and other important information (Table S2).
2.3. System architecture and user interface
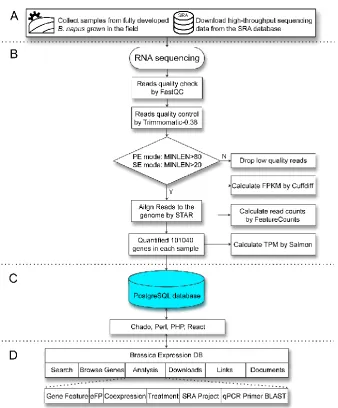
The BrassicaEDB is implemented using PostgreSQL (https://www.postgresql.org/), PHP (https://www.php.net/), Perl (https://www.perl.org/), and React (https://zh-hans.reactjs.org/) on the Linux CentOS 7 operating system. Our database is supported by the Chado database schema [16]. The dynamic web interface was written in HTML, CSS, and JavaScript. After collecting and analyzing the data, the gene expression profils and genomic information are loaded into the PostgreSQL database and presented in a userinterface framework (Figure 4).
The BrassicaEDB contains three major elements: a search panel on the left that supports dynamic
data input, a gene panel that keeps track of the user’s search, and a functional modules panel on the
Figure 4. Workflow for the development of the BrassicaEDB. (A) Data sources of BrassicaEDB. (B) Workflow for the RNA-Seq. Gene expression profils are loaded into the PostgreSQL database. (C) Implementation of BrassicaEDB via the integration of different programs. (D) Organization of BrassicaEDB.
2.3.1. Gene Feature module
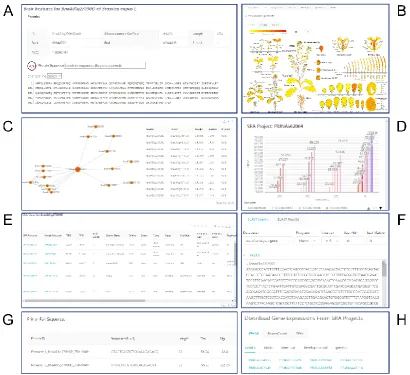
The Gene Feature module provides basic information about multiple aspects of the selected gene, such as its gene ID, location on the chromosome, and gene structure, including introns, untranslated regions (UTRs), and exons (Figure 6A). Gene Ontology (GO) annotations are available at the bottom. This module also provides DNA, mRNA, coding (CDS), and protein sequences.
2.3.2. eFP module
The eFP Map module displays the expression pattern of the selected gene by dynamically coloring the tissues of a pictographic representation of a plant based on the gene expression values (FPKM) from the 103 samples (Figure 6B). The figure is drawn as a vector image, allowing users to obtain good clarity when browsing and to modify the figure easily. Users can select the tissues of interest, explore the expression values of selected genes, choose the color system to change the display style (including absolute and relative mode), and save the figure in SVG format by clicking
the “Download SVG” icon. Relative mode allows users to customize the range of gene expression
levels, allowing them to easily compare the expression levels of multiple genes within a fixed range. The eFP Chart mode presents gene expression levels as a histogram sorted from lowest to highest. Users can hone in on samples with high expression levels accurately and rapidly (Figure S2). The eFP Table mode includes detailed information and expression values of selected genes in the 103 samples (Figure S3A). Users can download sample information and gene expression data by clicking
the “Export To Excel” button.
2.3.3. Coexpression module
Creating gene coexpression networks is a powerful approach for clustering coexpressed genes that are most likely functionally related, speculating about the functions of uncharacterized genes, and detecting genes with similar expression patterns across large amounts of transcriptome data [17]. The Coexpression module provides information about gene coexpression relationships based on transcriptome data from the 103 samples (Figure 6C). We used Weighted Gene Coexpression Network Analysis (WGCNA) to construct gene coexpression networks [18]. For this purpose, we selected the top 50% of genes with the highest variance to calculate the weight value for each gene pair. Based on the gene expression profiles of the 103 samples, the top 100 gene pairs with the highest weight values were identified by Pearson correlation coefficient (PCC) analysis. Gene pairs with PCC > 0 and P-value < 0.01 were retained. Weight values and PCCs between gene pairs are available for users to view in the Coexpression module. This module also presents a visual interface in which the selected gene is depicted as a big ball in the center surrounded by small balls depicting coexpressed genes, each connected to another ball representing the gene with the highest weight value. The Coexpression module displays all gene pairs for the selected gene by default. Users can limit the number of gene pairs displayed by inputting number in the box. If the user adjusts the parameters
appropriately, the data can be downloaded locally by clicking the “Export To Excel” button.
2.3.4. Treatment module
The Treatment module describes the results of gene expression analysis in rapeseed in response to three types of treatments, including abiotic stress, biotic stress, and chemical treatments. Each project contains all of the gene expression data. There are two modes to view: Table and Chart mode. Table mode presents all information and gene expression data for each sample (Figure S3B). Users
can download this information by clicking the “Export To Excel” button. Chart mode shows gene
expression levels in the form of multiple bar charts (Figure 6D). Users can choose the treatment of interest and explore the expression level of the selected gene under multiple treatments. Gene expression profiles from a selected project can be downloaded for transcriptome analysis in the Downloads module (Figure 6H).
2.3.5. SRA Project module
The SRA Project module shows many types of BioProjects to help the user quickly focus on experiments of interest (Figure 6E). In this function, we classified 837 samples into five biological models: biotic stress, abiotic stress, developmental, chemical, and genetic. Users can select a biological experiment and explore the expression values (FPKM, TPM, and read counts) of selected gene in each sample. All gene expression values can be downloaded locally for further analysis. In addition, descriptions of the experiment, cultivar used in the experiment, sampling stage, sampling tissue, condition, treatment type, treatment reagent, treatment time, PubMed ID, BioProject ID, and run ID
in the NCBI SRA database are available by clicking the “Export To Excel” button, allowing users to
obtain additional information to help them complete their research.
2.3.6. BLAST and qPCR Primer modules
The BLAST module allows users to compare nucleotide or protein sequences with the B. napus database of sequences and identify library sequences that resemble the query sequence (Figure 6F). The BLAST database was built with NCBI BLAST+ 2.6.0 [14]. The qPCR Primer module allows users to rapidly select the best primer pair for a gene (Figure 6G). All resources are from qPrimerDB [15].
2.3.7. Other modules
useful databases and website, which users can browse to obtain more information conveniently. Finally, the Documents module generates a user manual that will allow users to easily understand the features of our database and how to obtain information about a gene of interest easily and efficiently.
3. Discussion
The BrassicaEDB provides rapeseed researchers with comprehensive gene expression profiles and a visual interface, filling a gap in the tools available for exploring gene expression in rapeseed and laying the foundation for obtaining a preliminary understanding of gene function in rapeseed at the transcriptome level.
In the future, we plan to improve several aspects of the BrassicaEDB. First, we plan to add data from additional species to the BrassicaEDB. The Brassica genus includes several economically important plants. Six species (Brassica carinata, Brassica juncea, Brassica napus, Brassica oleracea, Brassica nigra, and Brassica rapa) evolved by combining chromosomes from three earlier species, as described
by the U’s Triangle theory [19]. Thus, in addition to B. napus, we will include the gene expression
profiles of these five other species. Second, we will expand the expression data and RNA types. The transcriptome data obtained from the public databases can be used for analysis at the gene expression
level. Using “Brassica” as the query, 8844 transcriptome samples could be retrieved from the SRA
database as of July 1, 2020. Clearly, the bulk of transcriptome data remains to be analyzed and further explored. The availability of big data could provide more comprehensive, accurate information about gene function in the future [20]. Finally, we plan to expand the analytical tools available in the BrassicaEDB. To help researchers complete their work more efficiently and conveniently, more tools based on gene expression profiles will be provided in the next version of BrassicaEDB.
4. Materials and Methods
4.1. Plant materials and growth conditions
The elite rapeseed cultivar ZS11, which is widely cultivated in China, was selected for developmental transcriptome sequencing. Seeds were germinated in plant growth chambers (PGC Flex; Conviron, Winnipeg, Canada) with a photoperiod of 16 h at 25/18 °C day/night, 60% humidity, and a light level of 250 µ moles/m2/s. After germination, the plants were transplanted to a field at the
Southwest University, China. During the plant lifecycle, 103 different tissues were collected, as described above.
4.2. RNA isolation and transcriptome sequencing
Total RNA was extracted from all tissues using an RNAprep Pure Kit for Plant (Tiangen Biotech,
Beijing, China) according to the manufacturer’s instructions and stored at −80℃ until use. 206
libraries were constructed using a TruSeq RNA Library Prep Kit v2 following standard operating procedures (Illumina, https://www.illumina. com/). All samples were multiplexed per lane of a flow cell, and 125 bp paired-end reads were generated using an Illumina HiSeq 2500 sequencer (Illumina Inc., San Diego, CA).
4.3. Public data sources
We downloaded the raw sequencing data for 837 samples in 70 BioProjects from the SRA database using fastq-dump from the SRA Toolkit (https://ftp-trace.ncbi.nlm.nih.gov/sra/sdk/2.10.7/), including 169 abiotic stress samples, 211 biotic stress samples, 110 chemical stress samples, 200 developmental samples, and 147 genetic samples, for a total of 2.4 TB of data.
4.4. RNA-seq data analysis
reads passing the quality filter were aligned to the rapeseed reference genome v.4.1 [11], and rapeseed reference annotation v.5.0 was used as a guide for BAM files using STAR software [11,22]. Quantification of the expression levels of 101,040 genes in each public sample was performed, generating FPKM, TPM, and Read counts values. Cufflinks were used to generate normalized counts in FPKM [23]. Reads or fragments were counted from BAM files using featureCounts; exons were defined as features at the gene level [24]. The TPM value for each sample was obtained using salmon with the parameter “validateMapping” to ensure that all genes would be preserved [25].
Supplementary Materials: Supplementary materials can be found at www.mdpi.com/xxx/s1. Table S1: 103 Samples used in this study; Table S2: The detailed information of 837 samples; Figure S1: Principal component analysis (PCA) of the global gene expression profile in 103 rapeseed ZS11 tissues; Figure S2: Chart mode for eFP; Figure S3: (A) Table mode for eFP; (B) Chart mode for Treatment; (C) Browse Genes module.
Author Contributions: H.C. performed all of the experiments, analyzed the data, prepared the figures and tables, and wrote the paper. T.L., Y.R., and H.C. contributed to build BrassicaEDB. K.L., K.Z., C.Q., and J.L. conceived and designed the experiments. C.L. and X.L. performed all of the experiments and performed parts of figures and tables. H.H., Y.N., and Y.H. assisted in the preparation of experimental materials. H.C. and W.S. performed parts of searching and statistics of some public data. All authors have read and agreed to the published version of the manuscript
Funding: This work was supported by grants from the National Key Research and Development Plan (2018YFD0100500 and 2016YFD0101007), the Southwest University's Training Program of Innovation and Entrepreneurship for Undergraduates (5240101327), the National Natural Science Foundation of China (31871653), the 111 project (B12006); the Natural Science Foundation of Chongqing, China (cstc2018jcyjA1219), and the Chongqing Agricultural Development Fund (NKY-2019AB008-2).
Acknowledgments: The authors are grateful to Biyue Ding and Yan Zhou from the Instrument and Equipment Sharing Service Platform, Academy of Agricultural Sciences, Southwest University, China.
Conflicts of Interest: The authors declare that they have no competing interests for this research.
Abbreviations
ZS11 ZhongShuang11
RNA-Seq RNA Sequencing
FPKM Fragments Per Kilobase Million TPM Transcripts Per Million
eFP Electronic Fluorescent Pictograph SRA Sequence Read Archive
NGS Next-generation sequencing GEO Gene Expression Omnibus
NCBI National Center for Biotechnology Information EBI European Bioinformatics Institute
HAG Hours after germination DAF Days after flowering
GO Gene Ontology
SVG Scalable Vector Graphics
WGCNA Weighted Gene Coexpression Netwoek Analysis PCC Pearson correlation coefficient
BLAST Basic Local Alignment Search Tool
References
1. Goodwin, S.; McPherson, J.D.; McCombie, W.R. Coming of age: ten years of next-generation sequencing technologies. Nature Reviews Genetics. 2016, 17, 333.
2. Clough, E.; Barrett, T. The gene expression omnibus database. Statistical Genomics. 2016, 93, 110. 3. Athar, A.; Füllgrabe, A.; George, N.; Iqbal, H.; Huerta, L.; Ali, A.; et al. ArrayExpress update–from bulk
4. Ohyanagi, H.; Takano, T.; Terashima, S.; Kobayashi, M.; Kanno, M.; Morimoto, K.; et al. Plant Omics Data Center: an integrated web repository for interspecies gene expression networks with NLP-based curation. Plant and Cell Physiology. 2015, 56, e9-e9.
5. Kudo, T.; Terashima, S.; Takaki, Y.; Tomita, K.; Saito, M.; Kanno, M.; et al. PlantExpress: a database integrating OryzaExpress and ArthaExpress for single-species and cross-species gene expression network analyses with microarray-based transcriptome data. Plant and Cell Physiology. 2017, 58, e1-e1. 6. Wang, Z.; Gerstein, M.; Snyder, M. RNA-Seq: a revolutionary tool for transcriptomics. Nature reviews
genetics. 2009, 10, 57-63.
7. Leinonen, R.; Sugawara, H.; Shumway, M.; et al. The sequence read archive. Nucleic acids research. 2010, 39, D19-D21.
8. Lu, F.; Wei, Z.; Luo, Y.; Guo, H.; Zhang, G.; Xia, Q.; Wang, Y. SilkDB 3.0: visualizing and exploring multiple levels of data for silkworm. Nucleic acids research. 2020, 48, D749-D755.
9. Yano, R.; Nonaka, S.; Ezura, H. Melonet-DB, a grand RNA-Seq gene expression atlas in melon (Cucumis melo L.). Plant and Cell Physiology. 2018, 59, e4-e4.
10. Waese, J.; Fan, J.; Pasha, A.; Yu, H.; Fucile, G.; Shi, R.; et al. ePlant: visualizing and exploring multiple levels of data for hypothesis generation in plant biology. The Plant Cell. 2017, 29, 1806-1821.
11. Chalhoub, B.; Denoeud, F.; Liu, S.; Parkin, I. A.; Tang, H.; Wang, X.; et al. Early allopolyploid evolution in the post-Neolithic Brassica napus oilseed genome. Science. 2014, 345, 950-953.
12. Sun, F.; Fan, G.; Hu, Q.; Zhou, Y.; Guan, M.; Tong, C.; et al. The high‐quality genome of Brassica napus cultivar ‘ZS 11’ reveals the introgression history in semi‐winter morphotype. The Plant Journal. 2017, 92, 452-468.
13. Winter, D.; Vinegar, B.; Nahal, H.; Ammar, R.; Wilson, G. V.; et al. An “Electronic Fluorescent Pictograph” browser for exploring and analyzing large-scale biological data sets. PloS one. 2007, 2. 14. Camacho, C.; Coulouris, G.; Avagyan, V.; Ma, N.; Papadopoulos, J.; Bealer, K.; Madden T.L. BLAST+:
architecture and applications. BMC bioinformatics. 2009, 10, 421.
15. Lu, K.; Li, T.; He, J.; Chang, W.; Zhang, R.; Liu, M.; et al. qPrimerDB: a thermodynamics-based gene-specific qPCR primer database for 147 organisms. Nucleic acids research. 2018, 46, D1229-D1236. 16. Mungall, C. J.; Emmert, D. B.; FlyBase, C. A Chado case study: an ontology-based modular schema for
representing genome-associated biological information. Bioinformatics. 2007, 23, i337-i346.
17. Stuart, J.M.; Segal, E.; Koller, D.; Kim, S.K. A gene-coexpression network for global discovery of conserved genetic modules. Science. 2003, 302, 249–255.
18. Langfelder, P.; Horvath, S. WGCNA: an R package for weighted correlation network analysis. BMC bioinformatics. 2008, 9, 559.
19. Lowe, A.J.; Jones, A.E.; Raybould, A.F.; Trick, M.; Moule, C.L.; Edwards K.J. Transferability and genome specificity of a new set of microsatellite primers among Brassica species of the U triangle. Molecular Ecology Notes. 2002, 2, 7-11.
20. Ma, C.; Zhang, H.H.; Wang X. Machine learning for big data analytics in plants. Trends in plant science.
2014, 19, 798-808.
21. Bolger, A.M.; Lohse, M.; Usadel, B. Trimmomatic: a flexible trimmer for Illumina sequence data. Bioinformatics. 2014, 30, 2114-2120.
22. Dobin, A.; Davis, C. A.; Schlesinger, F.; Drenkow, J.; Zaleski, C.; Jha, S. STAR: ultrafast universal RNA-seq aligner. Bioinformatics. 2013, 29, 15-21.
23. Trapnell, C.; Roberts, A.; Goff, L.; Pertea, G.; Kim, D.; Kelley, D.R. Differential gene and transcript expression analysis of RNA-seq experiments with TopHat and Cufflinks. Nature protocols. 2012, 7, 562-578.
24. Liao, Y.; Smyth, G.K.; Shi W. featureCounts: an efficient general purpose program for assigning sequence reads to genomic features. Bioinformatics. 2014, 30, 923-930.