Article
Performance Comparing and Analysis for Slot
Allocation Model
ZhiJian Ye
1, YanWei Li
2, JingTing Bai
3and XinXin Zheng
41 College of Air Traffic Management, Civil Aviation University of China, Tianjin300300, China;
2 College of Economics and Management, Civil Aviation University of China, Tianjin300300, China
3 College of Foreign Languages, Civil Aviation University of China, Tianjin300300, China
4 College of Cabin attendant, Civil Aviation University of China, Tianjin300300, China
Correspondence: ZhiJian [email protected];+86-13022226938
Abstract:
The purpose of this study is to ascertain whether implementation difficulty can
be used in slot allocation model as a new mechanism for slightly weakening grandfather
right. According to which,
a
linear integer programming model is designed to compare
and analyze displacement, implementation difficulty and priority with different weights.
Test results show that
the implementation difficulty can be
significantly
reduced without
causing excessive displacement and disruption of existing priorities,
by weight setting
while declared capacity is cleared. In addition to this, whether the movements are listed in
order of descending priority or not have great impact on displacement and implementation
difficulty within slot allocation model. Capacity is surely a key factor affecting
displacement and implementation difficulties. This study contributes to propose a new
mechanism for slightly weakening grandfather right, which can help decision makers to
upgrade slot allocation policies.
Keywords
Slot Allocation; Performance Comparing; Implementation Difficulty; Linear
Integer Programming
1 Introduction
Most of the busiest airports worldwide experience serious congestion and delay
problems, such as Beijing Capital International Airport (PEK), Shanghai Pudong
International Airport (PVG), and Guangzhou Baiyun International Airport (CAN) [1]. The
existing imbalance between supply and demand for air transport services forces all aviation
stakeholders to drastically rethink airport capacity and its utilization meanwhile
readdressing the issue of experienced or anticipated capacity shortages [2]. Results of past
research have proved that demand management could provide significant benefits at busy
airports worldwide by permitting large delay reductions through limited interference with
airline competitive scheduling [3] or by evenly small substantial increase in declared
capacity [4]. However, the latter, aiming to build new capacity, are capital intensive
solutions which require significant implementation time thus are often subject to heated
political debates. The need for an immediate relief to seriously congested airports calls for
short to medium-term, demand-side solutions that are based on the optimum allocation and
the use of available airport capacity [5]. To control over- capacity scheduling, the most
common demanding management schemes fall into two categories: (i) approaches
introducing market-driven or pure economic instruments (e.g., slot trading, auctions,
congestion pricing) , which aim to allocate capacity among competing users by considering
real market (or approximations of) valuations of access to congested airport facilities [6-12].
(ii) efforts aiming to improve the efficiency by using administrative allocation mechanism
[2-5, 13-19].
In order to control the excessive demand of airports, Chinese Civil Aviation (CAA) has
enacted slot regulation since 2010, but satisfactory effect has not been achieved.
Consequently, the new slot regulation of CAA similar to that of International Air Transport
Association (IATA) is introduced in April 2018. Although flight delay in Chinese airport has
been improved after the implementation of these slot management methods, the
unreasonable slot structure still exists [20-23]. As the analysis of these articles indicated, the
typical characteristics of slot structure in large Chinese airports are that the departure of
flights is concentrated in the morning while the arrival of flights in the evening, which is
showed in Figure 1.
Figure 1. The slot structure of PEK airport in 2015 [23]
Because of this unreasonable schedule, the problems of low punctuality rate of lights
in the morning and evening rush hours are doomed. Why is the application for all flights in
the slot allocation process meeting the declared capacity constraints, but still having to be
delayed while operating in large Chinese airports? One of the key reasons behind this is that
slot allocation does not take into account the actual implementation difficulties. This is a
typical case where peak hours are misused. The inefficiency of slot allocation (over-use or
lower use) also exists in other countries. The fundamental principle of the slot allocation
process of IATA is the grandfather right, i.e., the right of an airline to keep a slot of the
preceding equivalent season. This right is granted if and only if such a slot was used at least
80% of the time (use-it-or-lose-it rule). However, this procedure is far from being efficient.
Indeed, as reported by Airports Council International (ACI) Europe, unsatisfied/
unaccommodated demand, overbidding, late return of unwanted slots, flights operated
significantly and repeatedly off slot time (‘‘off slot’’), and failure to operate allocated slots
(the so called ‘‘no shows’’), are all
factors pointing or contributing to the inefficient
allocation and use of an already insufficient resource[4, 24, 25]. Picard, Tampieri [26] found
that, compared to public airports, private airports may restrain their supply of peak slots
strictly below their capacity levels when they serve airlines that compete to the same
destinations. Almost all airports in China are public-owned, so this will hardly happen in
China. Therefore, the
“off slot’’
is the focus of our attention.
of the airline’s network or the commercial viability of the flight. As a result, certain slots
may not be attractive enough to be actually operated by the assigned airport users, a fact
that may lead to waste of a really scarce resource[16]. At present, this situation is very
common in China's airports. Especially, the current schedule does not take into account the
actual implementation difficulties. Although the scheduled slot is constrained by capacity,
it cannot be implemented in actual operation, resulting in the accumulation and propagation
of delays[27].
Acquiring the appropriate slots at two congested airports like PEK and PVG
is extraordinarily difficult given the scarce capacity at both airports. This difficulty is
common, as Debbage [25]has pointed out for many years, but surprisingly it has not yet
been clearly integrated into any slot allocation model. Although the network-based slot
allocation model has emerged in recent years [15, 19], which explicitly considers the problem
of flight time matching at hinge airports, it is still subject to priority constraints. It is
conceivable that if a new entrant is to operate such a competitive route, the priority of his
application will be less than that of other applications with grandfather's rights when the
application slot is limited coincidentally by capacity. This application may be adjusted or
rejected, and other applications with grandfather's rights may not have this difficulty but
still occupy a scarce slot. This is obviously unreasonable, because it will increase the cost of
new entrants on this route, which in turn affects the welfare of passengers on this route,
although the new entrant may obtain this slot through secondary market transactions.
Therefore, incorporating implement difficulties into CAA rules seems to be one of the
promising solutions to the over-concentration of departure flights in the morning and
arrival flights in the evening in China. In this article, we do not try to solve all the problems
caused by the integration of implementation difficulties. We only discuss whether
introducing difficulty in our model and algorithmic framework based on
administrative
allocation mechanism of CAA
will affect the total displacement and priority.
Assuming that
our approach can hedge some of the implementation difficulties caused by the grandfather
right by introducing implementation difficulties without causing excessive displacement
and disruption of existing priorities, it will be a win-win situation for airports and airlines
operating at the airport.
The comment from Gillen, Jacquillat [28], Levine [29] that ‘‘an
imperfect solution is superior to a naive application of first-best theory” seems appropriate.
The remainder of this paper is organized as follows. Section 2 is the related work of
difficulty in slot allocation. Section 3 formulates the model, including the technical aspects
of capturing the CAA regulation and difficulty in optimizing the allocation of slots. Section
4 is the iterative linear integer programming algorithms based on data-splitting for
proposed model. Section 5 present tests and simulation results. Section 6 is the summary of
the study with implications for future research.
2 Related work of difficulty in slot allocation
year, Zografos [30] has a detail review of fairness, and constructed a fairness metric based
on ratio by schedule and ratio by required. Although fairness can improve acceptability, but
fairness is meaningless until feasibility is solved, so fairness is beyond the scope of our
discussion. We are only discussing how to reduce implementation difficulty because of the
concentration of morning departures and evening arrivals within the CAA slot allocation
framework similar to IATA.
Just as Zografos, Androutsopoulos [16] pointed out that most existing models of flight
scheduling typically do not consider acceptability of slot schedules. The more difficult the
slot displacement is, the less likely the flight will accept the displacement. On the contrary,
the less difficult the slot displacement is, the more likely the flight will accept it. Therefore,
instead of slot allocation acceptability, implementation difficulty is proposed in this study,
which is constructed into the model and examined together with slot displacement and
priority. Although acceptability and difficulty are two aspects of the feasibility problem,
difficulties can better reflect the nature of the feasibility problem. Because acceptability has
no uniform standard and is designated by airlines themselves, it is impossible to judge and
compare its rank. But the degree of difficulty is measurable and comparable. In addition,
since difficulty and acceptance are two aspects of a problem, the problem of acceptance
constraints can be reduced to the problem of unconstrained difficulty minimization by dual
theory [31]. By setting the objective function as the difficulty instead of acceptability
constraints in model of Zografos, Androutsopoulos [16], the number of constraints will be
greatly simplified, the calculation time will be saved and the calculation efficiency will be
improved. Therefore, in a sense, modeling with difficulty has advantages over modeling
with acceptability.
Of course, the fundamental way to reduce the implementation difficulties is to improve
the runway capacity, airspace capacity, and precisely integrate the slot allocation system
with the air traffic management system. Even extending the single airport slot allocation
model to multi-airport slot allocation model will be useful to reduce the implementation
difficulties. It can also be achieved by adjusting the slot structure through economic means.
But these solutions depend on systematic and comprehensive demand and capacity
management, which is time-consuming. On the contrary, considering the implementation
difficulty in slot allocation can produce an immediate effect, which means the reduction of
the implementation difficulties under the certain technical conditions is the key part to
conquer. Although the solution we proposed is one of all solutions, even imperfect solutions,
but no one has tried, so it is worth trying. Therefore, we tentatively assume that in airport
operation, when the declared capacity is cleared (the existing technical conditions and
equipment deployment remain unchanged), the slot coordinator (manager) and the
airlines(operator) are very willing to find a new slot displacement mechanism that can not
only ensure small displacement change, but also effectively reduce the implementation
difficulties.
Especially by encouraging new entrants to open up some new competitive routes, and
the arrival time (departure time) of flights running on these routes coincides within the early
departure peak (arrival peak) of these airports. Therefore, some inefficient departure flights
(departure peak) and arrival flights (arrival peak) are squeezed into other periods, which
not only reduces the implementation difficulties, but also has important significance for
balancing arrival and departure and improving the unreasonable slot structure in these
airports.
to be carefully considered, such as: with our algorithm, is it possible for high priority
movement to have a lower probability of being displaced? Can priority is considered as the
cost of displacing the unit time to ensure that the high priority movement has a low
probability of being displaced (HPLA)? What are the differences in performance indicators
when priority is fed into a computer program in priority order or in the order of morning to
night (final slot-table presentation) when priority is considered as the cost of displacing the
unit time? All these questions have not been investigated in previous articles will be
discussed and answered within this study. If there are clear answers to these questions, it is
feasible to introduce difficulty performance objectives into the model to reduce
implementation difficulty.
The main contribution of this paper is three folds. The first is that the difficulty index of
slot displacement for quantifying implementation difficulties of each movement is
proposed. Secondly, a multi-objectives linear integer programming model and algorithm
are developed to minimize the total compound cost of slot allocation. Thirdly, we found that
the implementation difficulty can be
significantly
reduced without causing excessive
displacement and disruption of existing priorities,
by weight setting while declared capacity
is cleared. By encouraging new entrants to develop competitive routes in favourable periods
and squeezing inefficient or low priority applications into non-peak periods,
implementation difficulties caused by the concentration of morning departure flights and
evening arrival flights at typical busy airports in China can be reduced. Then, the current
unreasonable slot structure will be gradually changed and optimized. This is a new
mechanism for weakening grandfather right.
3 Proposed slot displacement models
Before describing the model, notations are stated as follows:
𝑝𝑚: Priority of movement 𝑚.
𝑓𝑚𝐷: Flight implementation difficulties
𝐼𝑚𝐷: Flight difficulty index of one displacement unit
𝜏𝑚: Interval that movement 𝑚 required.A movement corresponds to an application.
𝑡𝑚: Interval that movement 𝑚 is scheduled.
𝑛: Seats of flights corresponding movement 𝑚.
𝜋𝑚: The average flight elapse time of movement 𝑚, to (arrival flight) or from (departure flight)
this airport.
𝐿𝑎 : Coordination level parameters of this airport (main coordinator, auxiliary coordinated
airport and uncoordinated airport; 7, 4, 1).
𝐿𝑏: Coordination level parameters of associated airports.
𝑥𝑚𝑡: { 0, 1}, if movement 𝑚 is scheduled at 𝑡 interval. 𝐶_60: Hourly capacity constraint;
𝐶_15: 15-minute capacity constraint; 𝐶_5: 5-minute capacity constraint;
𝑏𝑚𝑒: Corridor capacity constraints, 𝑒 = (1,2 … 𝐸).
𝑎𝑚𝑑: Movement 𝑚 plans to operate on day 𝑑 of a series day, usually series day expressed as [1, 2, 3, 4, 5, 6, 7]. 𝑎𝑚𝑑 is set mandatorily as 1, which means the same flight operating in one day has two movement number, such as 𝑚1 and 𝑚2.
𝑏𝑚𝑐: The amount of the kind of capacity 𝑐 consumed by movement 𝑚. In our model, 𝑐 may be hourly capacity, 15-minute capacity, 5-minute capacity, or corridor capacity. In our model, the amount of each capacity consumed by a movement is 1, which means all of 𝑏𝑚𝑐_60, 𝑏𝑚𝑐_15, 𝑏𝑚𝑐_5 and 𝑏𝑚𝑒 are set as 1.
𝑛: Number of seats.
coordination time interval represents the unit of time (e.g., 5-min, 15-min, 60-min) used as the basis for capacity determination and slot allocation. Usually each time interval contains multiple slots. A movement corresponds to a takeoff or landing activity. A slot refers specifically to the interval occupied by one movement.The following example further illustrates the meaning of interval, slot and displacement.
Assuming that the operator of flight AF125 submitted an application for departure, and the required departure time is 9:14. When the interval is set as one hour, there is 24 slots within a day,
and 𝜏AF125 is 9 (𝜏AF125 is located at 9th interval). When the interval is set as 15 minutes, there are 96
slots within a day, and 𝜏AF125 turns to 37. When the interval is set as 5 minutes, there are 288 slots within a day, and 𝜏AF125 is 111.
In the process of slot allocation, if the departure application of flight AF125 is scheduled at 11:14
( 𝑡AF125 is 11) when the interval is set as one hour, then the displacement (|𝑡AF125− 𝜏AF125|) of 𝜏AF125
is 2, which is showed in Figure 2.Similarly, it can be inferred that the displacement of this application is 8 when the interval is set as 15 minutes, and that is 24 when interval is set as 5 minutes.If Flight AF125 is scheduled before 9:14, the displacement may be negative or zero, thus an absolute value symbol is added to the displacement.
Figure 2. Displacement of 𝜏AF125 when interval is set as hour
We are motivated by the idea that the less difficult it is to adjust slot, the easier it will be accepted; the more difficult it is to adjust slot, the harder it will be accepted. Therefore, the problem of acceptability is transformed into the problem of minimizing the difficulty of slot displacement subject to the priority rule stipulated by CAA slot regulations and other operational constraints.
3.1 Difficulty index and difficulty of Displacement
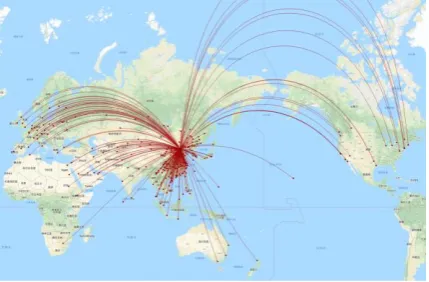
Difficulty index, 𝐼𝑚𝐷, is inversely proportional to elapse time 𝜋𝑚, and is proportional to slot displacement. Because elapse time increases with the range of flight distance as shown in Figure 3, the longer the flight distance is, the more time the aircraft will be shortened or increased by adjusting its speed during flight. This means that long-haul flights can receive larger slot adjustments than short-haul flights. Changing flight time by adjusting speed is not only considered as a technology to schedule, but also utilized to support other technical methods, such as four dimension trajectory [32-35],conflict detection and resolution [36-38], airborne technology[39], and air flow management [40-44]. These technical methods in turn make changing flight time by adjusting speed more mature and feasible. Therefore, difficulty index is inversely proportional to elapse time.
Figure 3. Air route network connected with PEK in 2018
Flight implementation difficulties index 𝐼𝑚𝐷 and difficulty 𝑓𝑚𝐷 brought by difficulty expressed as follow:
𝐼𝑚𝐷=⌊( 𝑛
𝜋𝑚)
1
2∙ (𝐿𝑎𝐿𝑏) 3
2⌋ (1)
𝑓𝑚𝐷=|𝑡𝑚− 𝜏𝑚| ∙ 𝐼𝑚𝐷=|𝑡𝑚− 𝜏𝑚| ∙ ⌊( 𝑛
𝜋𝑚)
1
2∙ (𝐿𝑎𝐿𝑏) 3
2⌋ (2)
The peak departure time in Figure 1 is around 7:00-8:00. It is almost impossible to balance the arrival and departure of flights in PEK airport by domestic flights, which have to take off at 5:00-6:00 in domestic cities and are not in line with people's travel habits.However, if international long-haul flights are introduced, the problem will be solved easily. The flight time of domestic flights is generally less than 150 minutes, and the number of seats is mostly more than 180. This will make 𝑛
𝜋𝑚
of domestic flights larger than that of international long-haul flights. Therefore, it is necessary to curb
the impact of the greater difficulty index of domestic flights. The purpose of (𝑛
𝜋𝑚)
1
2 is to reduce the
possibility of excessive difficulty index of domestic flights.
Whether the local airport and airport connected with it are coordinated airport and the coordination level of them exert great impact on the implementation difficulty index, consequentially,
the (𝐿𝑎𝐿𝑏)
3
2 is utilized. Graph of functions 𝑦 = 𝑥 1
2 and 𝑦 = 𝑥 3
2 are showed in Figure 4. The
characteristics of these two functions happen to meet our requirements.This makes difficulty index, 𝐼𝑚𝐷, grow slowly with the growth of
𝑛
𝜋𝑚 and relatively sharply with the growth of 𝐿𝑎𝐿𝑏.
When the priority of a movement 𝑚 is greater than the difficulty index (𝑝𝑚>𝐼𝑚𝐷), priority plays a key role.On the contrary, when 𝑝𝑚<𝐼𝑚𝐷, difficulty index plays a key role. We tested formula (1) and found that the average value of the difficulty index of all flights is about 42% of the average value of
priority allocation (∑1418𝑚=1𝐼𝑚𝐷
1418 ≈ 0.42
∑1418𝑚=1𝑝𝑚
1418 ). This is an ideal numerical range which makes the slot allocation generally tend to adjust low priority flights.
3.2 Standardized priority
and finally by the remaining slots. The CAA slot regulations clearly stipulate that priority should be determined from high to low according to the product of allocation cardinality and time efficiency allocation coefficient of aviation enterprises. We standardize the calculated priority values, so that the four types of priority are distributed within a clearly distinguishable range showed as in Table 1.
Table 1. Range of standardized priority
historic series of slots [1501,2000] “change to historic” series of slots [1001,1500]
new entrant slots [501,1000]
remaining slots [1,500]
In reality, priority determines the priority of slot selection. Similarly, in model computing, priority determines which movement can enter the model earlier and get the preferred slot. This is called High-Priority First (HPF).
3.3 Comprehensive displacement cost
As mentioned before, cost of one movement in most of traditional slot allocation models[4, 13, 24] is as following:
𝑓𝑚𝑂 = |𝑡𝑚− 𝜏𝑚| ∙ 1 (3)
In expression (3), 𝑓𝑚𝑂 is the interval displacement when required interval 𝜏𝑚 is replaced with scheduled interval 𝑡𝑚.
When priority is considered as the cost of displacing the unit time, cost of one movement can be presented as following:
𝑓𝑚𝑃= |𝑡𝑚− 𝜏𝑚| ∙ 𝑝𝑚 (4)
In our model, we integrate cost of displacement, difficulties and priorities as a whole in order to facilitate calculation and comparison. At the same time, three weight factors (𝑤1, 𝑤2, 𝑤3) are introduced artificially for the same reason. The comprehensive displacement cost of a movement, displaced from required interval 𝜏𝑚 to scheduled interval 𝑡𝑚, could be expressed as following:
𝛿𝑚𝑂𝐷𝑃= (𝑤1∙ 1 + 𝑤2∙ 𝐼𝑚𝐷 + 𝑤3∙ 𝑝𝑚) = (𝑤1∙ 1 + 𝑤2∙ ⌊( 𝑛 𝜋𝑚
) 1 2
(𝐿𝑎𝐿𝑏) 3
2⌋ + 𝑤3∙ 𝑝𝑚) (5)
𝑓𝑚𝑡 = 𝑤1∙ 𝑓𝑚𝑂+ 𝑤2∙ 𝑓𝑚𝐷+ 𝑤3∙ 𝑓𝑚𝑃= |𝑡𝑚− 𝜏𝑚|𝛿𝑚𝑂𝐷𝑃 (6)
We call δmODP as the comprehensive displacement cost factor with the consideration of implementation difficulties and priority. It is important found that δmODP is a constant, which makes it possible to solve it by Linear Integer Programming (LIP).
3.4 Displacement model for all flights
minimize ∑ ∑ 𝑓𝑚𝑡𝑥𝑚𝑡 𝑡∈𝑇 𝑚∈𝑀
= ∑ ∑|𝑡𝑚− 𝜏𝑚| 𝛿𝑚𝑂𝐷𝑃𝑥𝑚𝑡 𝑡∈𝑇
𝑚∈𝑀
(7)
subject to ∑𝑡∈𝑆𝑥𝑚𝑡=1, 𝑚 ∈ 𝑀 (8) ∑𝑚∈𝑀∑𝑡∈𝑇𝑐𝑠𝑎𝑚𝑑𝑏𝑚𝑐𝑥𝑚𝑡 ≤ 𝑢𝑐
𝑑𝑠, c∈C,d ∈ 𝐷,s∈ 𝑇
𝑐 (9)
𝑥𝑚𝑡 ∈ {0,1}, 𝑚 ∈ 𝑀, 𝑡 ∈ 𝑆 (10) The objective function (7) minimizes the overall displacement cost of all flights. Constraint (8) stipulates that every movement must be allocated to one interval. Constraint (9) specifies that total movement consumption cannot exceed capacity, for each constraint, day and interval. Constraint (10) ensures that this model can be solved by integer programming method. There is no detailed description of the coefficient matrix in previous papers. Thus, in the next section, we will elaborate proposed approach.
4 LIP for slot displacement models
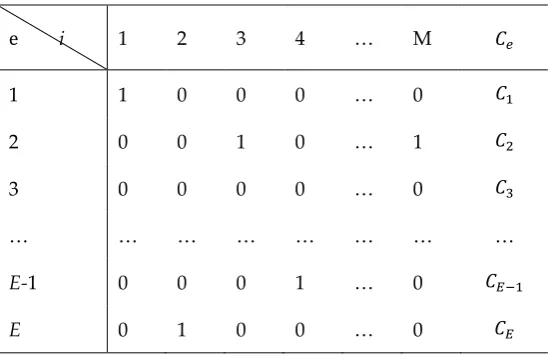
In general, the number of corridors for arrival is equal to the number of corridors for departure. Each corridor entrance must meet the capacity constraints. All movement is classified according to the number of corridors and assigned evenly to corridor before executing LIP. By designing the variable 𝑦𝑖𝑒= {0,1}, 𝑖 = 1 … 𝑀, 𝑒 = 1 … 𝐸, the relationship matrix of movement and corridors is constructed as shown in table 2. The sum of each column must be 1, that is, each movement i must be assigned to a corridor 𝑒. The sum of each row is limited by the capacity of the corridor in every interval. This makes it easy to solve the capacity constraints of the corridor with linear
programming, but with the increase of the number of flights and the number of corridors, the dimension of the constraints increases rapidly.
Table 2. relationship matrix of movement i and corridors e
e i 1 2 3 4 … M 𝐶𝑒
1 1 0 0 0 … 0 𝐶1
2 0 0 1 0 … 1 𝐶2
3 0 0 0 0 … 0 𝐶3
… … … …
E-1 0 0 0 1 … 0 𝐶𝐸−1
E 0 1 0 0 … 0 𝐶𝐸
Considering that the flight execution cycle is usually at least once a week, and that most flights operate every day,in order to reduce the computing time with the proposed approach, it is possible to determine the calendar days with the same set of requests, and then represent these as a single calendar day.In order to keep the accumulated rolling volume of flights from exceeding the hourly capacity, we consider three kinds of capacities in brackets (hourly capacity, 15-minute capacity and 5-minute capacity) to prevent this from happening. For preventing memory overflow, these three capacities are arranged separately and in the order of hourly capacity, 1minute capacity and 5-miute capacity sequentially, that is to say, the other two are not active in the arrangement of the third capacity. Because of the fact that 5-minute capacity has greatest impact on the uniform distribution of time, the check of minute capacity is put at the end. When the proposed algorithm is used for 5-minute check, the dimension of the constraint is too large, and sometimes the memory is insufficient to execute. So we activate constrains of runway capacity and corridors capacity in batches according to the order of priority. The corresponding capacity is updated after each batch of arrangement. The following is the procedures of iterative linear integer programming algorithms based on data-splitting.
Iterative linear integer programming algorithms based on data-splitting
Priority calculation 𝑓𝑚𝑃
For i=1:7
Load movement in day 1
Set up hourly capacity 𝑐_60, 15-minute capacity 𝑐_15,5-minute capacity 𝑐_5
Calculating the minimum total capacity , Z=Min (24∙ 𝑐_60, 96∙ 𝑐_15, 288∙ 𝑐_5)
Compared with M and Z, if M is larger than Z, the number of discarded requests is equal to M-Z Use simplex method to arrange all remaining applications into each hourly period
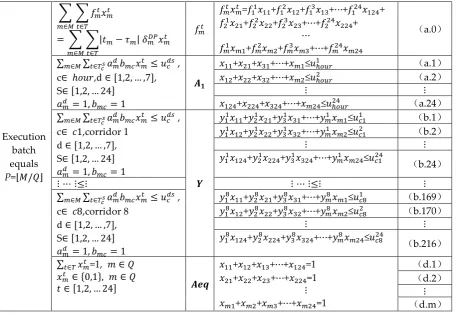
Table 3 is an example of description of the coefficient matrix in detail in the objective function and constrains within hours.
Table 3. Coefficient matrix and detailed expression when interval is based on hour
Execution batch equals
P=⌊𝑀/𝑄⌋
∑ ∑ 𝑓𝑚𝑡𝑥𝑚𝑡 𝑡∈𝑇 𝑚∈𝑀
= ∑ ∑|𝑡𝑚− 𝜏𝑚| 𝛿𝑚𝐷𝑃𝑥𝑚𝑡 𝑡∈𝑇
𝑚∈𝑀
𝑓𝑚𝑡
𝑓𝑚𝑡𝑥𝑚𝑡=𝑓11𝑥11+𝑓12𝑥12+𝑓13𝑥13+⋯+𝑓124𝑥124+ 𝑓21𝑥21+𝑓22𝑥22+𝑓23𝑥23+⋯+𝑓224𝑥224+
⋯
𝑓𝑚1𝑥𝑚1+𝑓𝑚2𝑥𝑚2+𝑓𝑚3𝑥𝑚3+⋯+𝑓𝑚24𝑥𝑚24
(a.0)
∑𝑚∈𝑀∑𝑡∈𝑇𝑐𝑠𝑎𝑚𝑑𝑏𝑚𝑐𝑥𝑚𝑡 ≤ 𝑢𝑐
𝑑𝑠,
c∈ ℎ𝑜𝑢𝑟,d ∈ [1,2, … ,7], S∈ [1,2, … 24]
𝑎𝑚𝑑 = 1, 𝑏𝑚𝑐 = 1
𝑨𝟏
𝑥11+𝑥21+𝑥31+⋯+𝑥𝑚1≤𝑢ℎ𝑜𝑢𝑟1 (a.1) 𝑥12+𝑥22+𝑥32+⋯+𝑥𝑚2≤𝑢ℎ𝑜𝑢𝑟2 (a.2)
⋮ ⋮
𝑥124+𝑥224+𝑥324+⋯+𝑥𝑚24≤𝑢ℎ𝑜𝑢𝑟24 (a.24) ∑𝑚∈𝑀∑𝑡∈𝑇𝑐𝑠𝑎𝑚𝑑𝑏𝑚𝑐𝑥𝑚𝑡 ≤ 𝑢𝑐𝑑𝑠,
c∈ 𝑐1,corridor 1 d ∈ [1,2, … ,7], S∈ [1,2, … 24] 𝑎𝑚𝑑 = 1, 𝑏𝑚𝑐 = 1
𝒀
𝑦11𝑥11+𝑦21𝑥21+𝑦31𝑥31+⋯+𝑦𝑚1𝑥𝑚1≤𝑢𝑐11 (b.1) 𝑦11𝑥12+𝑦21𝑥22+𝑦31𝑥32+⋯+𝑦𝑚1𝑥𝑚2≤𝑢𝑐12 (b.2)
⋮ ⋮
𝑦11𝑥124+𝑦21𝑥224+𝑦31𝑥324+⋯+𝑦𝑚1𝑥𝑚24≤𝑢𝑐124 ( b.24)
⋮ ⋯ ⋮≤⋮ ⋮ ⋯ ⋮≤⋮ ⋮
∑𝑚∈𝑀∑𝑡∈𝑇𝑐𝑠𝑎𝑚𝑑𝑏𝑚𝑐𝑥𝑚𝑡 ≤ 𝑢𝑐𝑑𝑠, c∈ 𝑐8,corridor 8
d ∈ [1,2, … ,7], S∈ [1,2, … 24] 𝑎𝑚𝑑 = 1, 𝑏𝑚𝑐 = 1
𝑦18𝑥11+𝑦28𝑥21+𝑦38𝑥31+⋯+𝑦𝑚8𝑥𝑚1≤𝑢𝑐81 (b.169) 𝑦18𝑥12+𝑦28𝑥22+𝑦38𝑥32+⋯+𝑦𝑚8𝑥𝑚2≤𝑢𝑐82 (b.170)
⋮ ⋮
𝑦18𝑥124+𝑦28𝑥224+𝑦38𝑥324+⋯+𝑦𝑚8𝑥𝑚24≤𝑢𝑐824 (b.216)
∑𝑡∈𝑇𝑥𝑚𝑡=1, 𝑚 ∈ 𝑄 𝑥𝑚𝑡 ∈ {0,1}, 𝑚 ∈ 𝑄
𝑡 ∈ [1,2, … 24] 𝑨𝒆𝒒
𝑥11+𝑥12+𝑥13+⋯+𝑥124=1
𝑥21+𝑥22+𝑥23+⋯+𝑥224=1
⋮
𝑥𝑚1+𝑥𝑚2+𝑥𝑚3+⋯+𝑥𝑚24=1
(d.1) (d.2)
⋮ (d.m)
5 Testing and results
Many previous papers have made intensive study on some specific performance of the slot allocation model, and some significant conclusions have been drawn. The primary performance criterion of the slot allocation problem [4, 24, 45] is the minimization of a delay based cost function, which is expressed either in the form of typical operational delay or the “schedule delay” concept [46].Operational delay is usually expressed in terms of the expected arrival/departure delays and total passenger delays. “Schedule delay” is same as displacement described in section 3 of this article. In addition to allocation efficiency considerations (usually expressed in terms of delays), fairness and equity[30, 47, 48], access and competition, as well as environmental objectives[49] have been also proposed by researchers. Employing a game-theoretic framework of airline frequency competition, Vaze and Barnhart [11] showed that small reductions in allocated airport capacity can reduce delays and improve airline profitability.Computational results in [47] suggest that, under a wide range of current and hypothetical scheduling settings, ignoring inter-airline equity can lead to highly inequitable outcomes, but under a wide range of realistic and hypothetical scenarios, inter-airline equity can be achieved at small efficiency losses. Performance objectives in article[16] include the minimization of the total schedule displacement (total ‘cost’ of schedule delay) and the minimization of the maximum schedule displacement. Test results of [16] suggest that substantial improvements in schedule acceptability metrics are achieved without sacrificing a lot in terms of scheduling efficiency. The comparison between NGFR (Non Grandfathered Rights) and GFR (Grandfathered Rights) scenarios of [16] demonstrates clearly the strong impact of GFR on potential schedule acceptability for airlines. Performance objectives in article[16] is the most relevant to our work.
1) Whether there is opportunity to reduce implementation difficulty while not to increase too much displacement.
2) With our algorithm, is it possible for high priority movement to have a lower probability of being displaced?
3) Can priority is considered as the cost of displacing the unit time to ensure that the high priority movement has a low probability of being displaced (HPLA)?
4) What are the differences in performance indicators when priority is fed into a computer program in priority order or in the order of morning to night (final slot-table presentation) when priority is considered as the cost of displacing the unit time?
If these questions are answered affirmatively, then displacement, difficulty and priority in slot allocation process will be effectively controlled by weights setting.
5.1 Performances compare with different weight factors of evaluation objectives
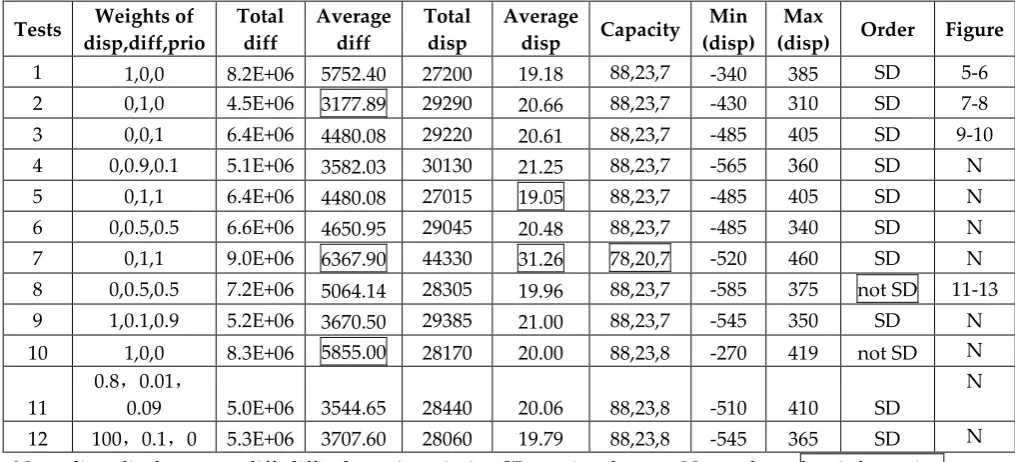
Weights setting and results with different weights of objective functions are showed in Table 4. Table 4. Performance compare with different weight factors of evaluation objectives
Tests Weights of disp,diff,prio
Total diff
Average diff
Total disp
Average
disp Capacity
Min (disp)
Max
(disp) Order Figure 1 1,0,0 8.2E+06 5752.40 27200 19.18 88,23,7 -340 385 SD 5-6 2 0,1,0 4.5E+06 3177.89 29290 20.66 88,23,7 -430 310 SD 7-8 3 0,0,1 6.4E+06 4480.08 29220 20.61 88,23,7 -485 405 SD 9-10 4 0,0.9,0.1 5.1E+06 3582.03 30130 21.25 88,23,7 -565 360 SD N 5 0,1,1 6.4E+06 4480.08 27015 19.05 88,23,7 -485 405 SD N 6 0,0.5,0.5 6.6E+06 4650.95 29045 20.48 88,23,7 -485 340 SD N 7 0,1,1 9.0E+06 6367.90 44330 31.26 78,20,7 -520 460 SD N 8 0,0.5,0.5 7.2E+06 5064.14 28305 19.96 88,23,7 -585 375 not SD 11-13 9 1,0.1,0.9 5.2E+06 3670.50 29385 21.00 88,23,7 -545 350 SD N 10 1,0,0 8.3E+06 5855.00 28170 20.00 88,23,8 -270 419 not SD N
11
0.8,0.01,
0.09 5.0E+06 3544.65 28440 20.06 88,23,8 -510 410 SD
N
12 100,0.1,0 5.3E+06 3707.60 28060 19.79 88,23,8 -545 365 SD N Note: disp=displacement, diff=difficulty, prio=priority, SD=sorting descent, N=not show, key information
➢ For question 1: Whether there is opportunity to reduce implementation difficulty while not to increase too much displacement?
According to results in table 4, we found that there is a contradictory relationship between displacement and difficulty, and still cannot answer the first question. So, we leave it to next part.
➢ For question 2: With our algorithm, is it possible for high priority movement to have a lower probability of being displaced?
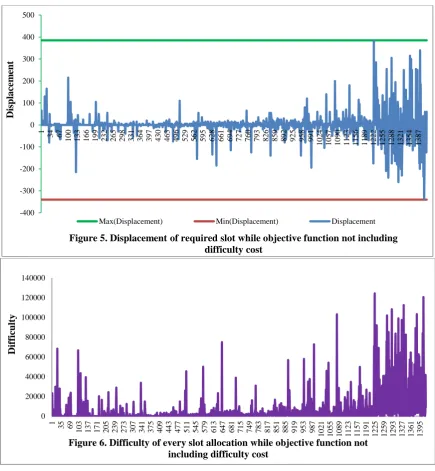
Displacement and difficulty of slot allocation and weights are set as [1,0,0] (test 1 in Table 4) as showed in Figure 5-6. In this case, the slot with small priority (late entering procedure) has more probability of being displaced, and the amount of slot displacement and its displaced probability will increase significantly with priority decreasing. While weights are set as [0,1,0] in test 2, displacement and difficulty of each slot allocation are showed in Figure 7-8. In this case, as the priority decreasing, the displaced probability of a movement has the same trend as in test 1, but the difference is that even if the priority is high, there is a certain probability of being displaced greatly. In test 1, the average slot displacement is relatively small, but the average difficulty of the slot displacement is greater than in test 2. This means just using displacement or difficulty as objective cannot guarantee priority well.
(using displacement as objective function only, weights setting as [1,0,0]). When weights are set as [0,0,1], both of displacement and difficulty, showed in Figure 9&10, are gradually increasing with decreasing priority.
According to Figure 5, 7, 9 and 11, although the number of applications with large displacement is different with weights setting, the displacement probability of high priority movement is always low. On the contrary, even if the priority of an application is high, the displacement amount and the probability of being adjusted are high if it is fed later in the process.Obviously, the determinant of the amount of displacement and the probability of being adjusted is the order of the feeding process. Interestingly, from Figure 6, 8, 10, 12, we find that the same is true for the determinant of difficulty and the probability of difficulty increasing.
Therefore, we conclude that no matter how the weight is set, the application with high priority will have a lower probability of being adjusted as long as movements are sent to the process according to the priority order, but the amount of displacement will vary with the weight setting. The same is true for difficulty.
-400 -300 -200 -100 0 100 200 300 400 500
1 34 67
1 0 0 1 3 3 1 6 6 1 9 9 2 3 2 2 6 5 2 9 8 3 3 1 3 6 4 3 9 7 4 3 0 4 6 3 4 9 6 5 2 9 5 6 2 5 9 5 6 2 8 6 6 1 6 9 4 7 2 7 7 6 0 7 9 3 8 2 6 8 5 9 8 9 2 9 2 5 9 5 8 9 9 1 1 0 2 4 1 0 5 7 1 0 9 0 1 1 2 3 1 1 5 6 1 1 8 9 1 2 2 2 1 2 5 5 1 2 8 8 1 3 2 1 1 3 5 4 1 3 8 7 Dis pla ce m ent
Figure 5. Displacement of required slot while objective function not including difficulty cost
Max(Displacement) Min(Displacement) Displacement
0 20000 40000 60000 80000 100000 120000 140000
1 35 69
1 0 3 1 3 7 1 7 1 2 0 5 2 3 9 2 7 3 3 0 7 3 4 1 3 7 5 4 0 9 4 4 3 4 7 7 5 1 1 5 4 5 5 7 9 6 1 3 6 4 7 6 8 1 7 1 5 7 4 9 7 8 3 8 1 7 8 5 1 8 8 5 9 1 9 9 5 3 9 8 7 1 0 2 1 1 0 5 5 1 0 8 9 1 1 2 3 1 1 5 7 1 1 9 1 1 2 2 5 1 2 5 9 1 2 9 3 1 3 2 7 1 3 6 1 1 3 9 5 Dif ficulty
➢ For question 3: Can priority is considered as the cost of displacing the unit time to ensure that the high priority movement has a low probability of being displaced (HPLA)?
According to Figure 9-10, we found when priority is the solely evaluation objective (weights setting as [0,1,0] in test 3 showed in table 4), both of difficulty and amount of displacement will increase gradually with priority decreasing (Figure 9-10). This means that making priority an objective is a good way to ensure priority, even if the displacement or difficulty is not so excellent.
So, according to investigation of question 2&3, we found three of these evaluation objectives should be include in slot model.
-500 -400 -300 -200 -100 0 100 200 300 400
1 47 93
13 9 18 5 23 1 27 7 32 3 36 9 41 5 46 1 50 7 55 3 59 9 64 5 69 1 73 7 78 3 82 9 87 5 92 1 96 7 10 13 10 59 11 05 11 51 11 97 12 43 12 89 13 35 13 81 D isp lac e m e n t
Figure 7. Displacement while weights set as [0,1,0] in test 2
Max(Displacement) Min(Displacement) Displacement
0 10000 20000 30000 40000 50000 60000 70000 80000 90000 100000
1 35 69
1 0 3 1 3 7 1 7 1 2 0 5 2 3 9 2 7 3 3 0 7 3 4 1 3 7 5 4 0 9 4 4 3 4 7 7 5 1 1 5 4 5 5 7 9 6 1 3 6 4 7 6 8 1 7 1 5 7 4 9 7 8 3 8 1 7 8 5 1 8 8 5 9 1 9 9 5 3 9 8 7 1 0 2 1 1 0 5 5 1 0 8 9 1 1 2 3 1 1 5 7 1 1 9 1 1 2 2 5 1 2 5 9 1 2 9 3 1 3 2 7 1 3 6 1 1 3 9 5 Diff icu lty
➢ For question 4: What are the differences in performance indicators when priority is fed into a computer program in priority order or in the order of morning to night (final slot-table presentation) when priority is considered as the cost of displacing the unit time?
Comparing data of test 8 and test 6 in Table 4, we found that when other conditions remain unchanged, if application is fed to the process without application sorting, then the average difficulty will increase, but the average displacement remain almost unchanged. This means that the effect of sorting or not on difficulty is greater than that on displacement.
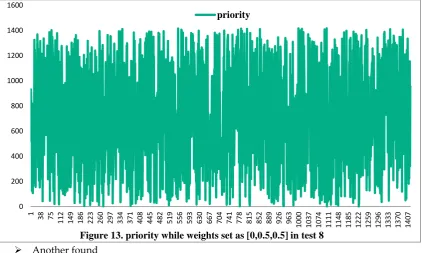
Comparing data of test 8 and test 6 (or data of test 10 and test 1) in Table 4, if movements are not listed according to the descent order of priority (In Figure 13, priority fluctuates as movements are fed to program according to required slot 𝜏𝑚), total difficulty is more greater than that while movements are listed according to the descent order of priority. This means that if movements are not listed (and fed to program) according to the descent order of priority, difficulty will increase.
From Figure 11 (test 8), movements listed later in inputting data have more probability of being displaced and being displaced greater (and more hard difficulty, Figure 12) than a movement ahead of the list. It is very obvious that when a movement listed at the end of the roster, the remaining capacity becomes less and less, the probability of being displaced becomes larger and larger, and the difficulty become harder and harder.
-600 -500 -400 -300 -200 -100 0 100 200 300 400 500
1 33 65 97
1 2 9 1 6 1 1 9 3 2 2 5 2 5 7 2 8 9 3 2 1 3 5 3 3 8 5 4 1 7 4 4 9 4 8 1 5 1 3 5 4 5 5 7 7 6 0 9 6 4 1 6 7 3 7 0 5 7 3 7 7 6 9 8 0 1 8 3 3 8 6 5 8 9 7 9 2 9 9 6 1 9 9 3 1 0 2 5 1 0 5 7 1 0 8 9 1 1 2 1 1 1 5 3 1 1 8 5 1 2 1 7 1 2 4 9 1 2 8 1 1 3 1 3 1 3 4 5 1 3 7 7 1 4 0 9 Dis pla ce m ent
Figure 9. Displacement of required slot while weights set as [0,0,1] in test 3
Max(Displacement) Min(Displacement) Displacement
0 20000 40000 60000 80000 100000 120000 140000 160000 180000
1 34 67
1 0 0 1 3 3 1 6 6 1 9 9 2 3 2 2 6 5 2 9 8 3 3 1 3 6 4 3 9 7 4 3 0 4 6 3 4 9 6 5 2 9 5 6 2 5 9 5 6 2 8 6 6 1 6 9 4 7 2 7 7 6 0 7 9 3 8 2 6 8 5 9 8 9 2 9 2 5 9 5 8 9 9 1 1 0 2 4 1 0 5 7 1 0 9 0 1 1 2 3 1 1 5 6 1 1 8 9 1 2 2 2 1 2 5 5 1 2 8 8 1 3 2 1 1 3 5 4 1 3 8 7 Dif ficulty
-800 -600 -400 -200 0 200 400 600
1 37 73
1 0 9 1 4 5 1 8 1 2 1 7 2 5 3 2 8 9 3 2 5 3 6 1 3 9 7 4 3 3 4 6 9 5 0 5 5 4 1 5 7 7 6 1 3 6 4 9 6 8 5 7 2 1 7 5 7 7 9 3 8 2 9 8 6 5 9 0 1 9 3 7 9 7 3 1 0 0 9 1 0 4 5 1 0 8 1 1 1 1 7 1 1 5 3 1 1 8 9 1 2 2 5 1 2 6 1 1 2 9 7 1 3 3 3 1 3 6 9 1 4 0 5 Dis pla ce m ent
Figure 11. Displacement while weights set as [0,0.5,0.5] in test 8
Max(Displacement) Min(Displacement) Displacement
0 20000 40000 60000 80000 100000 120000 140000
1 37 73
1 0 9 1 4 5 1 8 1 2 1 7 2 5 3 2 8 9 3 2 5 3 6 1 3 9 7 4 3 3 4 6 9 5 0 5 5 4 1 5 7 7 6 1 3 6 4 9 6 8 5 7 2 1 7 5 7 7 9 3 8 2 9 8 6 5 9 0 1 9 3 7 9 7 3 1 0 0 9 1 0 4 5 1 0 8 1 1 1 1 7 1 1 5 3 1 1 8 9 1 2 2 5 1 2 6 1 1 2 9 7 1 3 3 3 1 3 6 9 1 4 0 5 Dif ficulty
➢ Another found
According to data of test 4-6, 9, 11-12 in Table 4, when difficulty and priority exist simultaneously in evaluation objectives while movements are sorted according to priority, the changes of the weight of these two objectives mainly affect the change of difficulty while the average displacement amount remains almost unchanged. This maybe implies that priority has not too much effect to displacement, but has effect to difficulty while movements are sorted according to priority.
According to data test 7 in Table 4, due to the fact that the limited capacity (limited capacity equal to minimum in [78,20×4,7×12], which is 78) is smaller than that (minimum in [88,23×4,12] is 84) in other tests, the average displacement amount and the displacement difficulty are significantly increased. This comparing result implies that capacity is the key factor affecting the displacement.
5.2 Analysis of the correlation between average displacement and average difficulty
The following formula of Pearson correlation coefficient is used to calculate the correlation coefficients of average displacement and average difficulty with the same capacity setting [88,23,7].
𝑟 = ∑ 𝑋𝑌 − ∑ 𝑋 ∑ 𝑌 √(∑ 𝑋2−(∑ 𝑋)2
𝑁 )(∑ 𝑌2− (∑ 𝑌)2
𝑁 )
(11)
Three columns in table 4 (excluding test 7, because the capacity of this test is different from others) are extracted to table 5, and then all rows are ranked according to the average displacement in ascending order. The first column is index of test. After calculating with formula 11 and table 5, the results show that there is a negative correlation between mean displacement and average difficulty with correlation coefficient 𝑟=-0.54. That is, one decreases while another one increases. If the average difficulty is sensitive to the average displacement, there is an opportunity to increase the average displacement a little to achieve a significant reduction in the average difficulty. Therefore, we need to test the sensitivity of the average difficulty to the average displacement.
Table 5. data sorting according to average displacement
The first set of tests Average disp X
Average diff Y
5 19.05 4480.08
1 19.18 5752.40
12 19.79 3707.60
8 19.96 5064.14
0 200 400 600 800 1000 1200 1400 1600
1 38 75
112 149 186 223 260 297 334 371 408 445 482 519 556 593 630 667 704 741 778 815 852 889 926 963 1000 1037 1074 1111 1148 1185 1222 1259 1296 1333 1370 1407
10 20.00 5855.00
11 20.06 3544.65
6 20.48 4650.95
3 20.61 4480.08
2 20.66 3177.89
9 21.00 3670.50
4 21.25 3582.03
The following formula is used to test the sensitivity of average difficulty to average displacement.
δ𝑖𝑋=𝑋𝑖− 𝑋𝑖−1, i=2…N; (12)
δ𝑖𝑌=𝑌𝑖− 𝑌𝑖−1, i=2…N; (13)
σ =(∑𝑁𝑖=2δ𝑖𝑋)/𝑁
(∑𝑁𝑖=2δ𝑖𝑌)/𝑁=
∑𝑁𝑖=2δ𝑖𝑋
∑𝑁𝑖=2δ𝑖𝑌, i=2…N; (14) Using the data in Table 5, we obtained the following sensitivity coefficients,σ=-408.20. This shows that the average difficulty is very sensitive to the average displacement. The average displacement only needs to increase a small amount, which can greatly reduce the implementation difficulty.
6 Discussion and conclusion
The test results show that the average difficulty is very sensitive to the average displacement. This means the average displacement only needs to increase by a small amount, which can greatly reduce the implementation difficulty. It is worthwhile to increase some amount of slot displacement appropriately in return for a significant reduction in average execution difficulty. Especially when the number of seats on some regional flights is small, the air elapse time is large, or when the linked airports are uncoordinated, it is reasonable to make more displacement for these flights.
Priority cost also should be included in the objectives to guarantee priority, but it is not suitable to give priority cost too much weight, because too much weight will lead to increased difficulty. Furthermore, “lower displacement for movements with higher priority” has been guaranteed by that high priority list ahead of data table. Therefore, airlines should pay more attention to “the position in the list” not priority itself. When applications are not listed according to priority,great differences in priorities make displacement become more difficult. For the management department of slot allocation, it is an effective way to ensure “lower displacement for movements with higher priority” by inputting programs in priority order.
The test results show implementation difficulties, displacement and priority can be trade-off by suitable weights setting, which means that when the publication capacity is fixed, by setting the weight, the displacement and difficulty will be balanced, and the grandfather rights owned by some inefficient flights could be weaken by introducing implementation difficulties into performance evaluation objectives.
have their suitable slot, reduce the overall implementation difficulty, and also help to further cut the peak,fill the valley, and improve gradually the current slot structure.
The real-time applicability of our method is that at airports like Beijing Capital International Airport, the main base airlines have a number of ineffective slots, which seriously hinders the application of some new entrant carriers for new significant routes. Through our approach, the difficulty of implementation can be reduced, and grandfather rights can be weakened according to the strategic needs of the airport. At the same time, peak cutting and valley filling will be done to optimize the slot structure of these airports.
The main limitation of the study is that priority is produced by simulation, because of limitation of available data. This implies the relationship of implementation difficulty and priority need further research. We believe that with the improvement of technical methods and awareness of slot allocation, it is promising to make slot allocation more scientific and reasonable by investigating new slot performance evaluation objectives, suitable weights setting and other constraints in future research.
Acknowledge
This study is supported by the National Natural Science Foundation of China (71571182), the National Natural Science Youth Foundation of China (61603396), the National Natural Science Foundation of China and the Civil Aviation Grant (U1633124) and the research projects of the social science, humanity on Young Fund of the ministry of Education of China (14YJC630185).
Reference
1. Wu, W., H. Zhang, and W. Wei, Optimal design of hub-and-spoke networks with access to regional hub airports: a case for the Chinese regional airport system. 2018.
2. Zografos, K.G., M.A. Madasz, and Y. Salourasx, A decision support system for total airport operations
management and planning. Journal of Advanced Transportation, 2013. 47(2): p. 170-189.
3. Jacquillat, A. and A.R. Odoni, An Integrated Scheduling and Operations Approach to Airport Congestion Mitigation. Operations Research, 2015. 63(6): p. 1390-1410.
4. Zografos, K.G., Y. Salouras, and M.A. Madas, Dealing with the efficient allocation of scarce resources at congested airports. Transportation Research Part C-Emerging Technologies, 2012. 21(1): p. 244-256.
5. Zografos, K.G., M.A. Madas, and K.N. Androutsopoulos, Increasing airport capacity utilisation through optimum slot scheduling: review of current developments and identification of future needs. Journal of Scheduling, 2017. 20(1): p. 3-24.
6. Basso, L.J. and A.M. Zhang, Pricing vs. slot policies when airport profits matter. Transportation Research Part B-Methodological, 2010. 44(3): p. 381-391.
7. Verhoef, E.T., Congestion pricing, slot sales and slot trading in aviation. Transportation Research Part B-Methodological, 2010. 44(3): p. 320-329.
8. Zhang, A.M. and Y.M. Zhang, Airport capacity and congestion pricing with both aeronautical and
commercial operations. Transportation Research Part B-Methodological, 2010. 44(3): p. 404-413.
9. Czerny, A.I. and A.M. Zhang, Airport congestion pricing and passenger types. Transportation Research Part B-Methodological, 2011. 45(3): p. 595-604.
10. Le, L., et al., Optimum airport capacity utilization under congestion management: A case study of New York LaGuardia airport. Transportation Planning and Technology, 2008. 31(1): p. 93-112. 11. Vaze, V. and C. Barnhart, Modeling Airline Frequency Competition for Airport Congestion Mitigation.
Transportation Science, 2012. 46(4): p. 512-535.
13. Jacquillat, A. and A.R. Odoni, Congestion Mitigation at John F. Kennedy International Airport in New York City: Potential of Schedule Coordination. Transportation Research Record, 2013(2400): p. 28-36.
14. Pyrgiotis, N. and A. Odoni, On the Impact of Scheduling Limits: A Case Study at Newark Liberty International Airport. Transportation Science, 2016. 50(1): p. 150-165.
15. Ribeiro, N.A., et al., An optimization approach for airport slot allocation under IATA guidelines. Transportation Research Part B-Methodological, 2018. 112: p. 132-156.
16. Zografos, K.G., K.N. Androutsopoulos, and M.A. Madas, Minding the gap: Optimizing airport schedule displacement and acceptability. Transportation Research Part A: Policy and Practice, 2018. 114: p. 203-221.
17. Jacquillat, A. and A.R. Odoni, Endogenous control of service rates in stochastic and dynamic queuing models of airport congestion. Transportation Research Part E-Logistics and Transportation Review, 2015. 73: p. 133-151.
18. Jacquillat, A. and A.R. Odoni, A roadmap toward airport demand and capacity management. Transportation Research Part a-Policy and Practice, 2018. 114: p. 168-185.
19. Benlic, U., Heuristic search for allocation of slots at network level. Transportation Research Part C-Emerging Technologies, 2018. 86: p. 488-509.
20. Li, X., et al., Classification and characteristics of flights taking off and landing waveforms. FLIGHT DYNAMICS, 2016. 34(02): p. 90-94.
21. Sun, C.L. and X. Su, Analysis & Optimization of Beijing Capital Airport's flight waves. China Civil Aviation, 2013(10): p. 30-31.
22. Hu, M., T. Yi, and Y. Ren, Optimization of airport slot based on improved Hungarian algorithm. Application Research of Computers, 2019(08): p. 1-7.
23. Huang, J. and J. Wang, A comparison of indirect connectivity in Chinese airport hubs: 2010 vs. 2015. Journal of Air Transport Management, 2017. 65: p. 29-39.
24. Corolli, L., G. Lulli, and L. Ntaimo, The time slot allocation problem under uncertain capacity. Transportation Research Part C-Emerging Technologies, 2014. 46: p. 16-29.
25. Debbage, K.G., Airport runway slots: Limits to growth. Annals of Tourism Research, 2002. 29(4): p. 933-951.
26. Picard, P.M., A. Tampieri, and X. Wan, Airport capacity and inefficiency in slot allocation. International Journal of Industrial Organization, 2019. 62: p. 330-357.
27. Ahmadbeygi, S., et al., Analysis of the potential for delay propagation in passenger airline networks. Journal of Air Transport Management, 2008. 14(5): p. 221-236.
28. Gillen, D., A. Jacquillat, and A.R. Odoni, Airport demand management: The operations research and economics perspectives and potential synergies. Transportation Research Part A: Policy and Practice, 2016. 94: p. 495-513.
29. Levine, M.E., Airport congestion: when theory meets reality. Yale J. on Reg., 2009. 26: p. 37. 30. Zografos, K., A Bi-objective Efficiency-Fairness Model for Scheduling Slots at Congested Airports.
Transportation Research Part C: Emerging Technologies, 2019.
31. Ogryezak, W., Symmetric duality theory for linear goal programming. Mathematische Operationsforschung Und Statistik, 1988. 19(3): p. 373-396.
32. Brooker, P., Simple Models for Airport Delays During Transition to a Trajectory-Based Air Traffic System. Journal of Navigation, 2009. 62(4): p. 555-570.
34. Richard, O., S. Constans, and R. Fondacci, Computing 4D near-optimal trajectories for dynamic air
traffic flow management with column generation and branch-and-price. Transportation Planning
and Technology, 2011. 34(5): p. 389-411.
35. Tang, X.M. and Y.X. Han, 4d Trajectory Estimation for Air Traffic Control Automation System Based on Hybrid System Theory. Promet-Traffic & Transportation, 2012. 24(2): p. 91-98.
36. Cafieri, S. and C. D’Ambrosio, Feasibility pump for aircraft deconfliction with speed regulation. Journal of Global Optimization, 2017(1): p. 1-15.
37. Durand, N., C. Allignol, and N. Barnier, A Ground Holding Model for Aircraft Deconfliction. 29th Digital Avionics Systems Conference: Improving Our Environment through Green Avionics and Atm Solutions, 2010.
38. Han, Y.X., X.Q. Huang, and Y. Zhang, Traffic system operation optimization incorporating buffer size. Aerospace Science and Technology, 2017. 66: p. 262-273.
39. Jackson, M.R.C., et al., Airborne Technology for Distributed Air Traffic Management. European Journal of Control, 2005. 11(4): p. 464-477.
40. Wang, T.C. and Y.J. Li, Optimal Scheduling and Speed Adjustment in En Route Sector for Arriving Airplanes. Journal of Aircraft, 2011. 48(2): p. 673-682.
41. Rey, D., et al., Minimization of Potential Air Conflicts Through Speed Regulation. Transportation Research Record, 2012(2300): p. 59-67.
42. Rosenow, J., et al., Impact of optimised trajectories on air traffic flow management. Aeronautical Journal, 2019. 123(1260): p. 157-173.
43. Haraldsdottir, A., et al., Performance analysis of arrival management with 3D paths and speed control. 2007 Ieee/Aiaa 26th Digital Avionics Systems Conference, Vols 1-3, 2007: p. 62-+. 44. Rezaee, A. and S. Izadpanah, An Optimized, Mathematical-Based Flight Performance Planning.
Proceedings of the 2009 International Conference on Computer Technology and Development, Vol 1, 2009: p. 162-+.
45. Koesters, D. Airport scheduling performance—An approach to evaluate the airport scheduling process by using scheduled delays as quality criterion. in Proceedings of the Air Transport Research Society (ATRS) annual world conference, June 21. 2007.
46. Swaroop, P., et al., Do more US airports need slot controls? A welfare based approach to determine slot levels. Transportation Research Part B: Methodological, 2012. 46(9): p. 1239-1259.
47. Jacquillat, A. and V. Vaze, Interairline Equity in Airport Scheduling Interventions. Transportation Science, 2018. 52(4): p. 941-964.
48. Castelli, L., P. Pellegrini, and R. Pesenti, Airport slot allocation in Europe: economic efficiency and fairness. International journal of revenue management, 2011. 6(1-2): p. 28-44.
![Figure 1. The slot structure of PEK airport in 2015 [23]](https://thumb-us.123doks.com/thumbv2/123dok_us/7919416.1314986/2.595.184.441.281.417/figure-slot-structure-pek-airport.webp)
![Figure 7. Displacement while weights set as [0,1,0] in test 2](https://thumb-us.123doks.com/thumbv2/123dok_us/7919416.1314986/13.595.79.519.68.491/figure-displacement-weights-set-test.webp)
![Figure 9. Displacement of required slot while weights set as [0,0,1] in test 3](https://thumb-us.123doks.com/thumbv2/123dok_us/7919416.1314986/14.595.78.528.68.573/figure-displacement-required-slot-weights-set-test.webp)
![Figure 11. Displacement while weights set as [0,0.5,0.5] in test 8](https://thumb-us.123doks.com/thumbv2/123dok_us/7919416.1314986/15.595.89.506.63.557/figure-displacement-weights-set-test.webp)