Text Summarization Challenge 2
Text summarization evaluation at NTCIR Workshop 3
Manabu Okumura
Tokyo Institute of Technology
[email protected]
Takahiro Fukusima
Otemon Gakuin University
[email protected]
Hidetsugu Nanba
Hiroshima City University
[email protected]
Abstract
We describe the outline of Text Summarization Challenge 2 (TSC2 hereafter), a sequel text summarization evaluation conducted as one of the tasks at the NTCIR Workshop3. First, we describe briefly the previous evaluation, Text Summarization Challenge (TSC1) as introduction to TSC2. Then we explain TSC2 including the participants, the two tasks in TSC2, data used, evaluation methods for each task, and brief report on the results.
Keywords: automatictext summarization, summarization evaluation
1
2
Introduction
As research on automatic text summarization is being a hot topic in NLP, we also see the needs to discuss and clarify the issues on how to evaluate text summarization systems. SUMMAC in May 1998 as a part of TIPSTER (Phase III) project ([1], [2]) and Document Understanding Conference (DUC) ([3]) in the United States show the need and importance of the evaluation for text summarization.
In Japan, Text Summarization Challenge (TSC1), a text summarization evaluation, the first of its kind, was conducted in the years of 1999 to 2000 as a part of the NTCIR Workshop 2. It was realized in order for the researchers in the field to collect and share text data for summarization, and to make clearer the issues of evaluation measures for summarization of Japanese texts ([4],[5],[6]). TSC1 used newspaper articles and had two tasks for a set of single articles with intrinsic and extrinsic evaluations. The first task (task A) was to produce summaries (extracts and free summaries) for intrinsic evaluations. We used recall, precision and F-measure for the evaluation of the extracts, and content-based as well as subjective methods for the evaluation of the free summaries.
The summarization rates for task A were as follows:
10, 30, 50% for extracts and 20, 40% for free summaries.
The second task (task B) was to produce summaries for information retrieval (relevancejudgment) task. The measures for evaluation were recall, precision and F-measuretoindicate theaccuracy ofthe task, as well as the time to indicate how long it takes to carry out the task.
We also prepared human-produced summaries including key data for the evaluation. In terms of genre, we used editorials and business news articles at TSC1’s dryrun, and editorials and articles on social issues at the formal run evaluation.
As sharable data, we had summaries for 180 newspaper articles by spring 2001. For each article, we had the following seven types of summaries: important sentences (10, 30, 50%), important parts specified (20, 40%), and free summaries (20, 40%).
In comparison, TSC2 uses newspaper articles and
has two tasks (single- and multi-document
summarization) for two types of intrinsic evaluations. In the following sections, we describe TSC2 in detail.
Two Tasks in TSC2 and its Schedule
TSC2 has two tasks. They are single document summarization (task A) and multi-document summarization (task B).
Task A: We ask the participants to produce summaries in plain text to be compared with human-prepared summaries from single documents. Summarization rate is a rate between the number of characters in the summary and the total number of characters in the original article. The rates are about 20% and 40%. This task is the same as task A-2 in TSC1.
summarization lengths are given to the participants. Two summarization lengths are specified, short and long summaries for one set of documents.
The schedule of evaluations at TSC2 was as follows: dryrun was conducted in December 2001 and formal run was in May 2002. The final evaluation results were reported to the participants by early July 2002.
3
Data Used for TSC2
We use newspaper articles from the Mainichi newspaper database of 1998, 1999. As key data (human prepared summaries), we prepare the following types of summaries.
Extract-type summaries:
We asked captioners who are well experienced in summarization to select important sentences from each article. The summarization rates are 10%, 30%, and 50%.
Abstract-type summaries:
We asked the captioners to summarize the original articles in two ways. The first is to choose important parts of the sentences recognized important in extract-type summaries (abstract-type type1). The second is to summarize the original articles “freely” without worrying about sentence boundaries, trying to obtain the main idea of the articles (abstract-type type2). Both types of abstract-type summaries are used for task A. The summarization rates are 20% and 40%.
Both extract-type and abstract-type summaries are summaries from single articles.
Summaries from more than two articles:
Given a set of newspaper articles that has been selected based on a certain topic, the captioners produced free summaries (short and long summaries) for the set. Topics are various, from kidnapping case to Y2K problem.
4
Evaluation Methods for each task
We use summaries prepared by human as key data for evaluation. The same two intrinsic evaluation methods are used for both tasks. They are evaluation by ranking summaries and by measuring the degree of revisions. Here are the details of the two methods. We use 30 articles for task A and 30 sets of documents (30 topics) for task B at formal run evaluation. Unfortunately, due to the limitation of the budget, only an evaluator evaluates a system’s result for an article(or a set).
4.1. Evaluation by ranking
This is basically the same as the evaluation method used for TSC1 task A-2 (subjective evaluation). We ask human judges, who are experienced in producing summaries, to evaluate and rank the system summaries in terms of two points of views.
1. Content: How much the system summary covers the important content of the original article. 2. Readability: How readable the system summary is.
The judges are given 4 types of summaries to be evaluated and rank them in 1 to 4 scale (1 is the best, 2 for the second, 3 for the third best, and 4 for the worst).
For task A, the first two types are human-produced abstract-type type1 and type2 summaries. The third is system results, and the fourth is summaries produced by lead method.
For task B, the first is human-produced free summaries of the given set of documents, and the second is system results. The third is the results of the baseline system based on lead method where the first sentence of each document is used. The fourth is the results of the benchmark system using Stein method ([7]) whose procedure is as follows:
1. Produce a summary for each document.
2. Group the summaries into several clusters. The number of clusters is adjusted to be less than the half of the number of the documents.
3. Choose the most representative summary as the summary of the cluster.
4. Compute the similarity among the clusters and output the representative summaries in such order that the similarity of neighboring summaries is high.
4.2. Evaluation by revision
It is a newly introduced evaluation method in TSC2 to evaluate the summaries by measuring the degree of revision to system results. The judges read the original documents and revise the system summaries in terms of the content and readability. The revisions are made by one of three editing operations (insertion, deletion, replacement). The degree of the revision is computed based on the number of the operations and the number of revised characters. The revisers could be completely free in what they did, though they were instructed to do minimum revision.
When more than half of the document needs to be revised, the judges can ‘give up’ revising the document.
5
Participants
We had 4 participating systems for Task A, and 5 systems for Task B at dryrun. We have 8 participating systems for Task A and 9 systems for Task B at formal run. As group, we had 8 participating groups, which are all Japanese, of universities, governmental research institute or companies in Japan. Table 1 shows the breakdown of the groups.
University 6 Governmental
research institute 1
Company 2
Table 1 Breakdown of Participants
(Please note that one group consists of a company and a university.)
6
Results
6.1. Results of Evaluation by ranking
Table 2 shows the result of evaluation by ranking for task A and Table 3 shows the result of evaluation by ranking for task B. Each score is the average of the scores for 30 articles for task A, and 30 topics for task B at formal run.
Table 2 Ranking evaluation (task A)
In Tables 2 and 3, F01* and F02* are labels for the different systems involved, respectively. In Table 2, ‘TF’ indicates a baseline system based on term-frequency method, and ‘Human’ indicates
human-produced summaries that are different from the key data used in ranking judgement.
In Table 3, ‘Human’ indicates human-produced summaries that are different from the key data used in ranking judgement.
Table 3 Ranking evaluation (task B)
In Appendix A, we also show tables giving the fraction of time that each system beats the baseline, one human summary, or two human summaries for task A. In Appendix B, we show tables giving the fraction of time that each system beats the baseline, the benchmark, or human summary for task B.
Table 4 Ranking evaluation (task A, human and baseline)
In comparison with the system results (Table 2 and Table 3), the scores for the human summaries, the baseline systems, and the benchmark system(the summaries to be compared) are shown in Table 4 and Table 5.
6.2. Results of Evaluation by revision
Table 6 shows the result of evaluation by revision for task A at rate 40%, and Table 7 shows the result of evaluation by revision for task A at rate 20%. Table 8 shows the result of evaluation by revision for task B long, and Table 9 shows the result of evaluation by revision for task B short. All the tables show the evaluation results in terms of average number of revisions (editing operations) per document.
Deletion Insertion Replacement System
UIM RD IM RD C RD F0101 2.0 0.1 1.5 0.4 0.5 0.7
F0102 1.6 0.4 1.5 0.4 0.4 0.8
F0103 2.3 0.2 2.4 0.2 0.4 0.5
F0104 2.4 0.4 2.7 0.5 0.4 0.5
F0105 2.0 0.3 1.7 0.1 0.7 0.7
F0106 2.8 0.2 2.3 0.4 0.3 0.6
F0107 2.5 0.6 1.8 0.2 0.1 0.5
F0108 2.0 0.4 2.4 0.1 0.4 0.6
ld 2.9 0.1 0.7 0.1 0.4 0.1
free 0.4 0.4 1.2 0.4 0.1 0.3
part 0.7 0.6 0.9 0.3 0.1 0.4
edit 0.3 0.1 0.4 0.3 0.1 0.2 ALL 1.9 0.3 1.8 0.3 0.3 0.5
Table 6 Evaluation by revision (task A 40%)
Please note that UIM stands for unimportant, RD for readability, IM for important, C for content in Tables 6 to 9. They mean the reason for the operations, e.g. ‘unimportant’ is for deletion operation due to the part judged to be unimportant, and ‘content’ is for replacement operation due to excess and deficiency of content.
In Table 6 and Table 7, ‘ld’ means a baseline system using lead method, ‘free’ is free summaries produced by human (abstract type 2), and ‘part’ is human-produced (abstract type1) summaries, and these three are baseline and reference scores for task A.
Deletion Insertion Replacement System
UIM RD IM RD C RD F0101 1.4 0.4 1.3 0.2 0.5 0.3
F0102 1.2 0.4 1.0 0.0 0.4 0.5
F0103 0.8 0.1 1.2 0.0 0.2 0.1
F0104 0.8 0.1 1.2 0.1 0.1 0.2
F0105 1.2 0.1 0.7 0.0 0.4 0.2
F0106 2.1 0.2 1.7 0.1 0.1 0.2
F0107 0.8 0.6 0.9 0.1 0.2 0.1
F0108 1.4 0.1 1.1 0.1 0.2 0.6
ld 1.9 0.1 1.3 0.0 0.0 0.0
free 0.6 0.4 1.1 0.1 0.2 0.1
part 0.7 0.3 1.1 0.1 0.1 0.2
edit 0.2 0.1 0.5 0.1 0.2 0.2
ALL 1.1 0.3 1.1 0.1 0.2 0.3
Table 7 Evaluation by revision (task A 20%)
Deletion Insertion Replacement System
UIM RD IM RD C RD
F0201 3.8 0.7 7.2 1.4 1.1 0.9
F0202 5.2 0.6 3.5 0.4 0.7 0.5
F0203 5.1 0.6 3.8 0.5 0.9 0.6
F0204 4.2 0.6 3.4 0.7 1.4 0.7
F0205 8.1 0.6 5.4 1.7 3.0 1.3
F0206 3.2 0.2 4.7 0.7 0.8 0.6
F0207 7.0 1.1 4.1 1.1 1.1 1.1
F0208 4.8 0.7 4.0 0.4 0.8 0.9
F0209 4.6 0.5 3.9 0.5 0.5 0.5
human 3.0 0.9 3.4 7.8 1.0 1.2
ld 5.7 0.9 2.9 0.4 0.7 0.5
stein 4.0 0.5 2.2 0.3 0.8 0.5
edit 3.0 1.2 2.9 0.7 0.7 1.1
ALL 4.9 0.7 4.0 1.3 1.1 0.8
Table 8 Evaluation by revision (task B long)
In Table 8 and Table 9, ‘human’ means human-produced summaries which are different from the key data, and ‘ld’ means a baseline system using lead method, ‘stein’ means a benchmark system using Stein method, and these three are baseline, reference, and benchmark scores for task B.
To determine the plausibility of the judges’ revision, the revised summaries were again evaluated with the evaluation methods in section 5. In Tables 6 to 9, `edit’ means the evaluation results for the revised summaries.
the judges. Please look at the detailed data at NTCIR Workshop 3 data booklet.
Figure 1 indicates how much the scores for content and readability vary for the summaries of the same summarization rate. It shows that the readability scores tend to be higher than those for content, and it is especially clearer for 40% summarization.
Deletion Insertion Replacement System UI
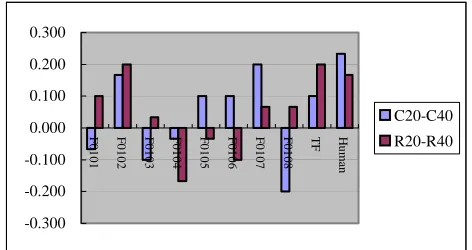
Figure 2 Score difference between 20% and 40% summarizations (Task A)
Figure 2 shows the differences in scores for the different summarization rates, i.e. 20% and 40% of task A. ‘C20-C40’ means the score for content 20% minus the score for content 40%. ‘R20-R40’ ’means the score for readability 20% minus the score for readability 40%.
Table 9 Evaluation by revision (task B short)
7
Discussion
Figure 2 tells us that the ranking scores for 20% summarization tend to be higher than those for 40%, and this is true with the baseline system and human summaries as well.
7.1. Discussion for Evaluation by ranking
Second, consider task B. Figure 3 shows the differences in scores for content and readability for each system for task B. ‘CS-RS’ means the score for content short summaries minus the score for readability short summaries. ‘CL-RL’ is computed in the same way for long summaries.
We here further look into how the participating systems perform by analysing the ranking results in terms of differences in scores for content and those for readability.
First, consider task A. Figure 1 shows the differences in scores for content and readability for each system. ‘C20-R20’ means the score for content 20% minus the score for readability 20%. ‘C40-R40’ means the score for content 40% minus the score for readability 40%.
-0.800
Figure 1 Score difference between Content and Readability (Task A)
Figure 3 Score difference between content and readability (Task B)
larger than the differences we saw for task A, i.e. in Figure 1.
Figure 4 shows the differences in scores for the different summarization lengths, i.e. short and long summaries of task B. ‘CS-CL’ means the score for content short summaries minus the score for content long summaries. ‘RS-RL’ means the score for readability short summaries minus the score for readability long summaries.
Figure 4 tells us, unlike Figure2, the scores for short summaries tend to be lower than those for long summaries. This tendency is very clear for the readability ranking scores.
Figure 1 and 3 show that when we compare the ranking scores for content and readability summaries, the readability scores tend to be higher than those for content, which means that the evaluation for readability is worse than that for content. Figure 2 and 4 shows contradicting tendencies. Figure 2 indicates that short (20%) summaries are higher in ranking scores, i.e. worse in evaluation. However, Figure 4 indicates the other way round.
Intuitively longer summaries can have better readability since they have more words to deal with, and it is shown in Figure2. However, it is not the case with task B ranking results. Longer summaries had worse scores, especially in readability evaluation.
-0.800
Figure 4 Score difference between different summarization lengths (Task B)
7.2. Discussion for Evaluation by revision
To determine the plausibility of the judges’ revision, the revised summaries were again evaluated with the evaluation methods in section 5. As Tables 6 to 9 show, the degree of the revisions for the revised summaries is rather smaller than that for the original ones and is almost same as that for human summaries.
Tables 10 and 11 show the results of evaluation by ranking for the revised summaries at task A and B respectively. Compared with Tables 2 to 5, Tables 10
and 11 show that the scores for the revised summaries are rather smaller than those for the original ones and are almost same as those for human summaries.
From these results, the quality of the revised summaries is considered as same as that of human summaries.
Table 10 Ranking evaluation (task A)
System No Content
Table 11 Ranking evaluation (task B)
8.
Conclusions
We have described the outline of the Text Summarization Challenge 2. In addition to the two evaluation runs, we held two round-table discussions, one right after dryrun, and the other after formal run. At the second round-table discussion, it was pointed out that we might need to examine more closely the results of evaluation, especially the one by ranking.
We are now starting the third evaluation (TSC3). Please see our web page[4] for the details of the task.
References
[1] Proceedings of The Tipster Text Program Phase III, Morgan Kaufmann, 1999.
[2] Mani, I., et al. The TIPSTER SUMMAC Text Summarization Evaluation, Technical Report, MTR 98W0000138, The MITRE Corp., 1998.
[3] http://www-nlpir.nist.gov/projects/duc/. [4] http://oku-gw.pi.titech.ac.jp/tsc/index-en.html. [5] Takahiro Fukusima and Manabu Okumura, “Text
Summarization Challenge –Text Summarization Evaluation at NTCIR Workshop 2”, In Proceedings of NTCIR Workshop 2, pp.45-50, 2001.
[6] Takahiro Fukusima and Manabu Okumura, “Text Summarization Challenge – Text Summarization Evaluation in Japan”, North American Association for Computational Linguistics (NAACL2001), Workshop on Automatic Summarization, pp.51-59, 2001. [7] Gees C. Stein, Tomek Strazalkowski and G. Bowden
Appendix A
20%
readability lead human humans
F101 0.767 0.100 0.033
F102 0.667 0.100 0.033
F103 0.667 0.100 0.033
F104 0.733 0.133 0.067
F105 0.833 0.233 0.100
F106 0.867 0.233 0.133
F107 0.733 0.233 0.200
F108 0.833 0.067 0.033
human 0.933 0.467 0.233
tf 0.267 0.067 0.067
20%
content lead human humans
F101 0.867 0.200 0.167
F102 0.900 0.200 0.100
F103 0.800 0.067 0.033
F104 0.767 0.067 0.033
F105 0.933 0.200 0.067
F106 0.900 0.200 0.100
F107 0.800 0.167 0.133
F108 1.000 0.267 0.167
human 1.000 0.400 0.233
tf 0.233 0.000 0.000
40%
readability lead human humans
F101 0.833 0.233 0.033
F102 0.700 0.133 0.100
F103 0.800 0.100 0.067
F104 0.800 0.133 0.033
F105 0.767 0.200 0.167
F106 0.800 0.167 0.100
F107 0.767 0.200 0.167
F108 0.833 0.100 0.067
human 0.867 0.467 0.300
tf 0.400 0.100 0.100
40%
content lead human humans
F101 0.967 0.167 0.100
F102 0.900 0.267 0.200
F103 0.800 0.100 0.033
F104 0.900 0.133 0.067
F105 0.867 0.200 0.167
F106 0.967 0.200 0.100
F107 0.933 0.233 0.167
F108 1.000 0.167 0.100
human 0.967 0.300 0.267
tf 0.367 0.000 0.000
Appendix B
short
readability lead stein human
F201 0.233 0.167 0.333
F202 0.333 0.267 0.367
F203 0.367 0.333 0.533
F204 0.300 0.233 0.300
F205 0.200 0.233 0.267
F206 0.267 0.233 0.233
F207 0.200 0.267 0.400
F208 0.367 0.300 0.233
F209 0.433 0.167 0.433
human 0.667 0.600 0.533
short
content lead stein human
F201 0.533 0.400 0.267
F202 0.433 0.333 0.200
F203 0.500 0.500 0.100
F204 0.433 0.400 0.200
F205 0.500 0.533 0.233
F206 0.300 0.200 0.100
F207 0.633 0.633 0.233
F208 0.400 0.333 0.133
F209 0.433 0.267 0.167
human 0.700 0.700 0.467
long
readability lead stein human
F201 0.167 0.167 0.267
F202 0.367 0.333 0.300
F203 0.300 0.267 0.367
F204 0.233 0.267 0.333
F205 0.300 0.100 0.233
F206 0.133 0.100 0.233
F208 0.333 0.300 0.333
F209 0.267 0.300 0.367
human 0.567 0.533 0.467
long
content lead stein human
F201 0.500 0.500 0.400
F202 0.533 0.300 0.167
F203 0.433 0.300 0.100
F204 0.333 0.400 0.233
F205 0.567 0.367 0.300
F206 0.200 0.067 0.167
F207 0.567 0.500 0.233
F208 0.433 0.533 0.200
F209 0.567 0.533 0.267