Manchester, United Kingdom - August 10-14, 2015 Division I, Paper ID 152
CORRELATION BETWEEN MICROSTRUCTURE EVOLUTION AND
CREEP PROPERTIES OF POLYCRYSTALLINE AUSTENITIC
STAINLESS STEEL
Jia-Nan Hu1, and Alan C.F. Cocks2
1
Postdoctoral Researcher, Department of Engineering Science, University of Oxford, UK 2
Professor, Department of Engineering Science, University of Oxford, UK
ABSTRACT
Creep deformation is one of the most important life limitation issues of nuclear reactor structural components. It has been observed that long-term creep curves of solution-treated Type 316H austenitic stainless steels exhibit multiple minimum creep rates or secondary stages. A change in the creep response is understood to be due to the evolution of the microstructure, in particular, precipitation, phase transformations and changes in composition of the matrix phase. Precipitates nucleate, grow and coarsen at elevated temperature, leading to a depletion of solute elements remaining in the matrix, thus reducing solute strengthening. Meanwhile, evolution of the precipitation population may also change the way that dislocations bypass them, either by Orowan bowing or climb-controlled mechanisms, depending on the extent of the obstacle resistance and the applied stress. This paper aims at quantifying and explaining how microstructure evolution may lead to strengthening and softening and the variation in the creep properties of polycrystalline austenitic stainless steels. A simple phase transformation model embedded in a multi-scale self-consistent crystal plasticity framework is used to examine the creep rate vs time curves and available information on microstructural changes at different temperatures and/or stresses. Correlations between precipitation evolution and the observed shape of the creep curves are shown and analysed.
Keywords: Microstructure evolution; Precipitation; Creep property; Stainless steel.
INTRODUCTION
The current operating Generation II Advanced Gas-Cooled Reactors (AGR), built mainly in 1960s and 70s, are approaching their designed life. Besides the development of new Generation III systems of mainly Pressurised Water Reactors (PWR) with advanced safety systems, the life of some AGRs are also being extended due to economical purposes. This necessitates the deep investigation and understanding of the life limiting issues such as creep deformation and failure of the components, typically made from the Type 316H austenitic stainless steels. Unexpected failure of the components could cause closure of the whole nuclear power plant.
Division I
(a) (b)
Figure 1. Creep rate vs time curves of solution-treated 316H stainless steels at (a) 600oC and (b) 650oC.
AAL is the reference code of the specimen and data are obtained from Kubo et al. (1996)
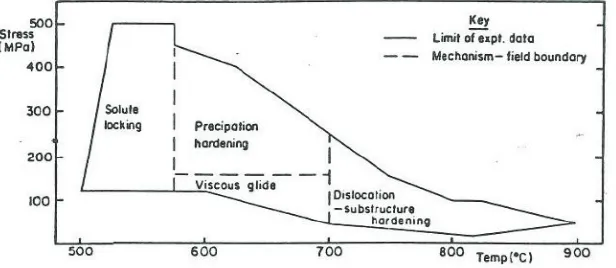
It has been shown from a strengthening-mechanism map (Figure 2) for initially solution-treated 316 stainless steels proposed by Aplin and Angelo (1990), that deformation mechanisms associated with different microstructural elements such as solid solution (solute locking in Figure 2) and precipitation may dominate the creep response at intermediate temperature and stress ranges, depending on the microstructural state. The boundaries separating different mechanisms in Figure 2 may vary with different material states. A change in the creep response is understood to be due to the evolution of the microstructure, in particular, precipitation, phase transformations and changes in composition of the matrix phase. However, to date, none of the present model has systematically incorporated the evolution of microstructure and the influence on the creep behaviour of the material.
Figure 2. Strengthening-mechanism map for 316 stainless steels, proposed by Aplin and Angelo (1990)
In this paper, the effect of phase transformation and thermal solute strengthening is incorporated into a multi-scale self-consistent model established in our previous work (Hu et al. (2015), Hu (2015)) to evaluate the complex phenomenon of multiple secondary stages in solution-treated 316H stainless steels.
STRUCTURE OF MULTI-SCALE SELF-CONSISTENT MODEL
23 Conference on Structural Mechanics in Reactor Technology Manchester, United Kingdom - August 10-14, 2015 Division I
been presented elsewhere by a series of papers from the authors (Hu et al. (2015), Hu and Cocks (2015), Hu (2015)). In this paper, only the essential ideas and equations are to be shown.
Continuum model of individual grains and polycrystal
The continuum model establishes the relationship between the response of individual anisotropic grains
and that of the polycrystalline aggregate. Given an applied stresss, the response of each grain is given by
( ) ( )
1 1( )
1(
)
*t a a i a i i i t
C
C
R
C
C I
S
S
e
+
é
ê
--
-ú
ù
s
=
ê
é
--
+
ù
ú
e
ë
û
ë
û
(1)where a, i
C C are respectively the elastic stiffness matrices for each anisotropic grain and the isotropic
polycrystal; i
S is a tensor related to the geometry of the grain and Poisson’s ratio of the isotropic
polycrystal Mura (1982); et aand et*are the misfit strain in the anisotropic grain or an equivalent isotropic
grain, physically caused by the plastic deformation mismatch between the grain and the surrounding
homogeneous polycrystal; R is the orientation matrix for the grain; and I is the unity matrix. Equation 1
can be used to determine the stress/strain field of each individual grain during elastic deformation when
no plastic mismatch occurs, i.e.et a=0
, and during plastic deformation whenet a ¹0
, with the latter
involving accumulation of residual stress. The expression ofet aduring plastic deformation has been given
by Kroner (1961), Budiansky and Wu (1962) (expressed in the rate form)
ta p T p
R E
e
ta =e
p- -TT ppR ETT pp
e
tatatatatatae
e
pppppp- TTT pppE
T p T p
(2)
whereeepp
and p
Ep
E are the plastic strain rate in the grain with respect to the local co-ordinate system and the
macroscopic plastic strain rate of the polycrystal with respect to the global co-ordinate system, with the latter of which determined from the plastic strain rates in all the grains of the polycrystal by the virtual
work principle (Hu and Cocks (2015)). The T
R- used in Equation 2 is due to the transformation between
the mathematical strain component and the engineering strain component.
Crystal plasticity framework for individual grains
Each grain in a F.C.C. austenitic stainless steel contains four slip planes and each plane has three slip directions, giving totally twelve slip systems. The plastic strain rate in each grain within the polycrystal is calculated by the crystal plasticity model by adding all the shear strain rates on all the active slip systems
12 12
( )
p
sym bnb sb b b
b b
e
p =å
g
Ä =å
q g
q g
bbb bbbe
på
b b bå
( )
sym(((((
g
)))sym((( )) (3)
wherenbis the normal to a plane andsbis one of the slip directions associated with the slip systemb, and
(
)
sym n s
b b b
q = Ä is the Schmid factor of the slip system b and Ärepresents the dyadic product. A
thermally activated glide rule following Frost and Ashby (1982) is employed here to describe the plastic
shear strain rateggbbassociated with the slip system b and the deformation kinetics at elevated temperature.
(
)
( )
4/3 3/4
0
0
exp
sgn
1
1
sol crF
F
kT
b b b bg
g
t
t
t
æ
æ
ö
ö
D
ç
ç
÷
÷
=
ç
-
-
÷
ç
÷
ç
è
ø
÷
è
+
ø
0exp
bg
bg
ç D
exp
g
ç
k
çç
-çç
wheretbis the resolved shear stress (RSS) of the slip system b , related to the grain stress through the
Schmid factor; cr
b
t is the slip strength or critical resolved shear strength (CRSS) on the same system,
associated to the different obstacles that a moving dislocation can encounter on its slip plane; gg00is a
reference shear strain rate, which is understood to be physically related to the dislocation vibration frequency and mobile dislocation density (Frost and Ashby (1982)) and has been estimated to be 1/s (see
Hu (2015)); k is Boltzmann’s constant; T is temperature; DF0is the total activation energy required to
overcome obstacles without aid from external stress. Detailed expression ofDF0 for different types of
obstacles has been given by Frost and Ashby (1982) and discussed in Hu (2015) and is not shown here.
In Equation 4, Fsolis a term describing the enhancement of slip strength by the mobile solute atoms in the
matrix at elevated temperature, following the theory of Schmidt and Miller (1981a), which states that solute atoms have more diffusion mobility in the network at elevated temperatures and may either diffuse into the core of continuously gliding (climbing) dislocations, or form atmospheres or clusters around dislocations. In either case, the mobile solutes can usually be dragged along by moving dislocations,
impeding their motion. A simple version of Fsolretaining the essential physics of the solute drag process
from their theory is incorporated into our crystal plasticity framework, which can be written as
2
max
log log
exp
sol
F Ac
B b
g
g
é æ - ö ù
ê ú
= -ç ÷
ê è ø ú
ë û
ù
2
log
b
g
log
ú ùù ö
g
log
g
log
g
maxlog
g
max öölog
(5)
where A and B are fitting parameters. ggmaxmaxis the magnitude of the shear strain rate at which the solute drag
effect reaches its maximum. Its value for 316 stainless steels is given by Schmidt and Miller (1981b). cis
the current solute concentration in the clusters, where the controlling contents in 316 stainless steels has
been considered to be solute complexes Mo-C or Mo-N (Asbury (1986)). The term
(
1+Fsol)
is introducedin Equation 4 when solute clusters are present thus the slip strength is enhanced. But when there is no
clusters or the atoms are extremely mobile at very low or very high temperatures, Fsol=0, i.e. solutes do
not enhance the slip strength in Equation 4. In their theory, Fsol has been understood to be linearly
proportional to the concentration of solutes in the clusters or atmospheres (Schmidt and Miller (1981a)).
Dislocation link length model of individual slip planes
Dislocation link length model provides a physical basis of the CRSS on each slip system in Equation 4 as contributed from distributions of different types of obstacles, such as forest dislocations, precipitates and solute atoms. It is understood that coplanar slip systems belonging to the same slip plane have identical CRSS (Bronkhorst et al. (1992)), thus the model is simply based on slip planes rather than on slip systems.
The model describes a two-dimensional distribution of forest dislocation links with various lengths on individual slip planes of each grain, which is related to the distribution of pinning points or forest dislocation junctions on the same planes Hu (2015). Here a dislocation link is defined as the dislocation segment between two pinning points on a slip plane, which in the current model refers to only the forest dislocation junctions or the intersections of links from other slip planes. The CRSS contributed from
forest dislocation junctions tdon each slip plane is inversely proportional to the mean spacing of the
pinning points on the planeLd.
d d
d Gb L
a
23 Conference on Structural Mechanics in Reactor Technology Manchester, United Kingdom - August 10-14, 2015 Division I
where G is the shear modulus, b is the length of the Burgers vector and adis a constant determining the
strength of the pinning points. The model captures the hardening behaviour through the multiplication of dislocations gliding on a slip plane, leading to the increase of number of junctions and links. Hardening on a slip plane by the increase of pinning points on the same plane is called self-hardening, while that by multiplication on other intersecting planes is called latent hardening. At elevated temperature, the dislocation network can recover through climb-controlled network coarsening, where long links grow at the expense of short links, thus reducing the number of pinning points of individual slip planes and leading to the softening of the material. A simple thermodynamic kinetic analysis has been carried out on
the recovery of the mean spacing on individual slip planes Hu (2015). Given a slip plane i, the overall
change of the mean spacing Ldicombining hardening and recovery processes can be expressed as
3
1 2 3
1
di di i j
j i di
L
L
J
J
K
L
g
g
¹æ
ö
= -
ç
+
÷
+ ×
è
å
ø
3L
dididididiL
L
L
ddididd33 ii jjK
1
3L
ö
×
K
K
÷
i i j
i i j
i i j
i i j
i i j
i i j
öö
i i j
i i j
i i j
÷÷
i i j
i i j
i i
J
ji 111 i 222 j i 1111 i
JJJJJ
2222 ji i j
i i j
i i j
i 11111 i 22222 j i 11 i 22 j
i i j
i i j
i i j
i i j
i i j
i i j
i i j
i i j (7)
where J J K1, 2, are parameters describing respectively self-hardening, latent hardening and recovery. The
effect of solid solution (ts) or precipitation (tp) on the resistance to dislocation slip on individual slip planes is similarly considered to be inversely proportional to the mean spacing of all the solute elements
(Ls) or second-phase precipitates (Lp), which are assumed to be randomly distributed on the plane.
p p p Gb L
a
t
= and s ss Gb L
a
t
=(8)
where αp and αs are respectively the constant determining the strength of precipitates and solute atoms.
The values of all these constants can be found in the literature (see Hu (2015)). For precipitation strengthening, dislocations bypass precipitates by an Orowan bowing mechanism, leading to the formation of dislocation loops around precipitates that contribute to forest dislocation junctions and some internal stress (Ashby (1966)). Note that mechanism could change from Orowan bowing to dislocation climb bypassing over precipitates at elevated temperature when the applied stress is very low, where the climb bypassing involves less strengthening but much slower deformation kinetics than Orowan bowing. Details of this can be found in Hu (2015). According to Dong et al. (2010), the appropriate way to express the combined CRSS from all three types of obstacles described above can be written as:
2 2
cr d p s
t
=t
+t
+t
(9)The evolution of tdis determined by Equation 7 while that of tpis determined separately by a phase
transformation model through the change of mean size and volume fraction of precipitates. tsis treated as
a constant calculated from material’s chemical composition (Hirth and Lothe (1982)). Finally, it should be
noted that all obstacle strengths scale with temperature-dependent modulus (see Frost and Ashby (1982)).
PHASE TRANSFORMATION
At elevated temperature, the initially solution-treated state of materials is thermodynamically unstable and changes in the microstructure, in particular, transformation of different precipitate phases, can be made to occur by thermo-mechanical treatment. Thermal ageing in 316 stainless steels promotes formation of
carbides (mainly M23C6, M refers to metallic elements) and other more stable intermetallic phases such as
Laves (Fe2Mo). However, only the intragranular precipitates interact and retard the dislocation motion
Division I
The classical phase transformation model proposed by Avrami or more generally called the Johnson-Mehl-Avrami-Kolmogorov (JMAK) model (reviewed by Fanfoni and Tomellini (1998), Christian (1975)) has been used to predict the evolution of intragranular precipitates in 316H austenitic stainless steels (see Hu (2015)) during thermal ageing. The model is able to determine the evolution of mean size, number density and volume fraction of different intragranular phases, as well as depletion of solute atoms in the matrix, during precipitation nucleation, growth and coarsening processes, where the last process is similar to the dislocation network coarsening and is also called Ostwald Ripening (Shewmon (1969)). Usually the first two processes strengthen the materials by introducing more precipitates (i.e. mean spacing decreases) while the coarsening process softens the materials by reducing the number of small particles (i.e. mean spacing increases). However, care needs to be taken when transformation of multiple phases occur simultaneously, such as carbide and Laves phase in 316 stainless steels, where different phases may have different kinetics of transformation, leading to a more complex evolution of the result between all the precipitates. Moreover, the concomitant creep deformation has been understood to promote or accelerate the phase transitions by introducing more dislocations as energetically favourable nucleation sites and short-circuit diffusion paths (see Morris and Harries (1978), Embury et al. (2003)). However, to date, very few microstructure information is available, and none of simple models have been proposed or developed that can fully capture the kinetics of phase transformation as influenced by creep deformation.
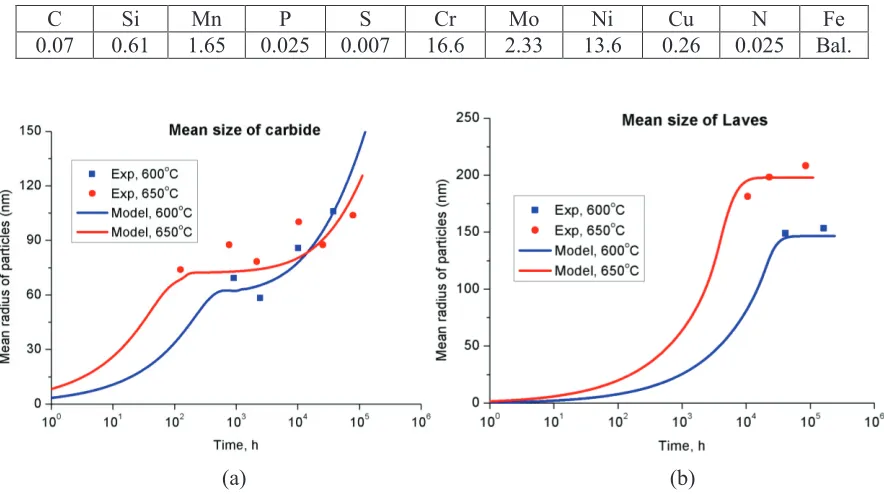
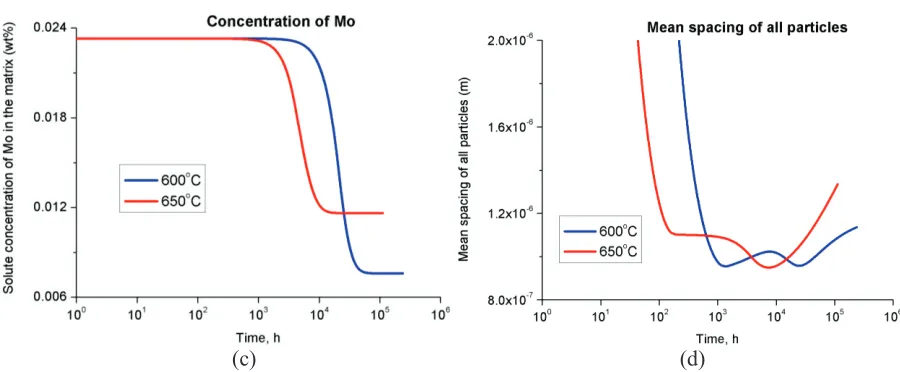
Some preliminary model predictions of phase transformation in initially solution-treated 316H austenitic stainless steels (the chemical composition is shown in Table 1) subjected to pure thermal ageing (no
creep) at 600oC and 650oC are presented here in Figure 3, together with some available microstructure
data related to the mean size of carbide (Figure 3a) and Laves phases (Figure 3b). The depletion of a
typical solute element Mo (mass percent) is shown in Figure 3c. Detail of this simulation can be found in
Hu (2015). These results captured the basic characteristics of phase transformation, where the rate is slow at the beginning and the end of the process but rapid in between. At the same time, the mean spacing between all carbides and Laves phase particles at these two temperatures is shown in Figure 3d, demonstrating a complex evolution due to simultaneous transformation of the two phases.
Table 1: Chemical composition (wt.%) of Type 316H stainless steel
C Si Mn P S Cr Mo Ni Cu N Fe
0.07 0.61 1.65 0.025 0.007 16.6 2.33 13.6 0.26 0.025 Bal.
23 Conference on Structural Mechanics in Reactor Technology Manchester, United Kingdom - August 10-14, 2015 Division I
(c) (d)
Figure 3. Evolution of the mean size of (a) carbides and (b) Laves phase, and evolution of (c) the concentration of Mo and (d) the mean spacing of all particles.
EVALUATION OF CREEP RATE VS TIME CURVES
The multi-scale self-consistent model described in this paper has been validated in simulations of monotonic loading and/or creep of ex-service plus laboratory aged 316H stainless steels specimens, which contain a considerable population of precipitates (Chen et al. (2015), Hu and Cocks (2015), Hu (2015)). In all these simulations, the evolution of precipitates during the short-term creep was ignored due to very slow phase transformation in these materials, so as to the effect of solute drag due to large depletion of solute elements, essential for the complexes, by the present precipitates. In this section, we attempt to
evaluate the creep rate vs time curves of initially solution-treated 316H stainless steels at 600oC and
650oC (Figure 1), which may exhibit multiple minimum creep rates or secondary stages, using the
combined self-consistent model and phase transformation model. The influence of creep on phase transformation is not considered. At each temperature, we select three curves with three different stresses. We intend to understand how, and to what extent, the evolution in the microstructure can be correlated to the change in the creep property of the material, and thus do not attempt to fit each particular curve.
The material was first subjected to pre-straining at each temperature up to the required stress, and then followed by creep. The recovery of dislocation structure and the phase transformation were ignored during the short-term monotonic pre-straining. At each time step during creep, carbide and Laves phases were allowed to transform simultaneously, with increment of volume fraction, mean size, mean spacing and solute concentration determined by the improved JMAK phase transformation model, as shown in Figure 3. Values of some parameters used in this simulation are shown in Table 2.
Table 2. Material parameters of Type 316H austenitic stainless steel used in the simulation
Parameter Value Parameter Value
11
C a 198 GPa ad 0.35
12
C a 125 GPa ap 0.84
44
C a 122 GPa as 0.000457
b 2.5´10-10 m DF0 654.7 KJ mol
-1
0 g0
Division I
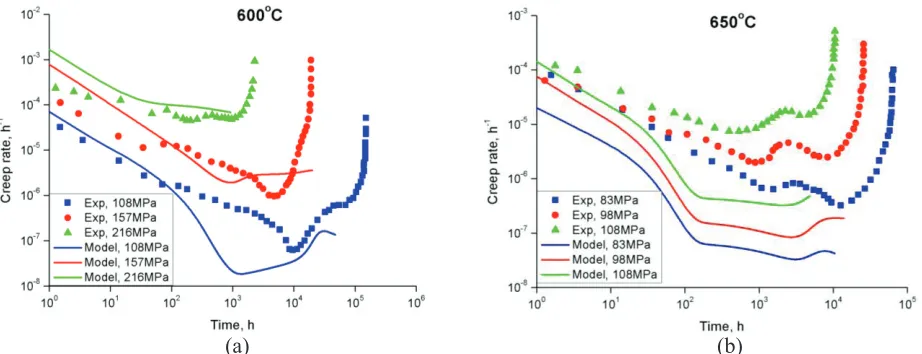
Figure 4 present the simulated and measured creep rate vs time curves for the solution-treated 316H
stainless steels at 600oC and 650oC at three different stresses. For all stresses and temperatures considered
here, it is found that dislocation climb bypassing over particles does not dominate. The initial decrease of creep rate (primary stage) results from the dislocation multiplication (hardening) since thermal solute drag and phase transformation are weak at the beginning. Without phase transformation and solute drag, it is expected that, as the recovery rate of dislocation structure gradually catches up with the hardening rate, the creep rate will eventually become almost constant towards secondary stage (Hu (2015)). However, here the model predicts some subsequent transitions at some stresses, e.g. some minimum creep rates or secondary stages, indicating changes in the precipitate strength (CRSS) described in Equations 8 & 9 as different phases transform or coarsen in a complex way as shown in Figure 3 (d). Solute drag also plays an important role such that it either enhances the creep strength (reduces the creep rate) as the creep rate
decreases (see Equation 5), or enhances the creep rate as its effect attenuates as the concentration of Mo
gradually decreases (Figure 3c).
(a) (b)
Figure 4. Predictions and measurements of creep rate vs time curves at (a) 600oC and (b) 650oC, taking
into account effect of solute drag and phase transformation.
Some differences can be seen between the predictions and data in Figure 4, e.g. the data does not exhibit same transitions and the minimum creep rate may occur at a different time. Reason for these differences may consist that some small precipitates can be easily cut by the dislocations thus they do not contribute to the strength through Orowan bowing, as expressed in Equation 8 (Hu (2015)). In fact, as can be seen in the strengthening-mechanism map in Figure 2, solute drag may dominate the creep response at these
temperatures and stresses considered in this simulation (termed “viscous glide” in Figure 2), indicating
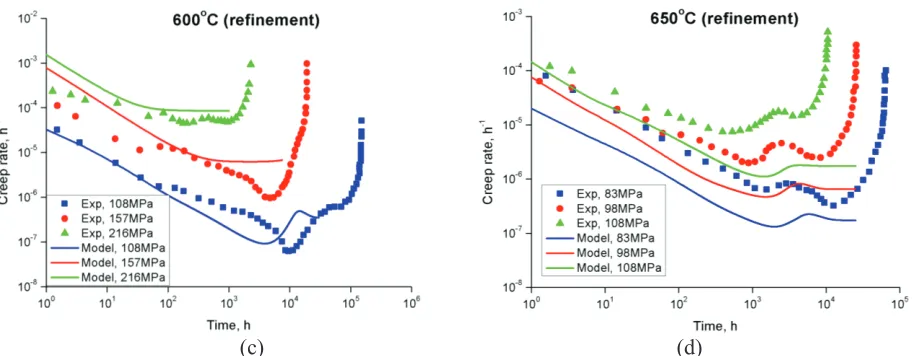
either not many small precipitates or too large mean spacing between large precipitates that they may not directly influence the creep behaviour of the material. However, such feature cannot be reflected in the phase transformation model employed here. As an alternative, some refined results are shown in Figure 5
where we have neglected the precipitate strength at these temperatures but retained the depletion of Mo
during phase transformation. The updated results are closer to the data compared with Figure 4. Some
large difference between the prediction and data can still be observed at 650oC, which may be because
solute atoms are more mobile at 650oC thus contribute less to the strength (Equation 8) than that at 600oC.
Now the increase of creep rate is purely caused by reduced effect of solute drag, which almost coincides
with the depletion of Mo, as shown in Figure 3 (c), and the subsequent decrease of creep rate is due to
23rd Conference on Structural Mechanics in Reactor Technology Manchester, United Kingdom - August 10-14, 2015 Division I
(c) (d)
Figure 5. Refined predictions of creep rate vs time curves at (a) 600oC and (b) 650oC, taking into account
effect of solute drag and phase transformation but ignoring precipitation strength described in Equation 8.
CONCLUSION
The creep behaviour of solution-treated 316H stainless steels at 600oC and 650oC was evaluated using the
combined self-consistent model enhanced by phase transformation and solute drag. The general trend of the multiple minimum creep rates or multiple secondary stages observed in creep rate vs time curves was captured by the model and correlated with the evolution of microstructural state. Understanding the effect of thermal solute drag and phase transformation on the creep behaviour of the solution-treated material at elevated temperatures is beneficial to the assessment of the evolution of materials internal state and enables physical modelling for a broader range of stress and temperature in the future.
REFERENCES
Aplin, P. F. and Angelo, D. D. (1990). Dislocation-creep mechanisms in type 316 steel. . In Creep and
Fracture of Engineering Materials and Structures, eds. B. Wilshire, R.W. Evans. Institute of Metals, London, 537-545.
Asbury, F. E. (1986). Factors Influencing Long-Term Creep of Type-316 Steel at 600-Degrees-C.
Materials Science and Technology, 2, 1123-1130.
Ashby, M. F. (1966). The theory of the critical shear stress and work hardening of dispersion-hardened
crystals, Defense Technical Information Center, UK.
Bronkhorst, C. A., Kalidindi, S. R. and Anand, L. (1992). Polycrystalline Plasticity and the Evolution of
Crystallographic Texture in Fcc Metals. Philosophical Transactions of the Royal Society of
London Series a-Mathematical Physical and Engineering Sciences, 341, 443-477.
Budiansky, B. and Wu, T. T. (1962). Theoretical prediction of plastic strains of polycrystals. Proc. 4th
Congr. Appl. Mech, 1175-1185.
Chen, B., Hu, J. N., Wang, Y. Q., Zhang, S. Y., Petegem, S. V., Cocks, A. C. F., Smith, D. J. and Flewitt, P. E. J. (2015). Role of the misfit stress between grains in the Bauschinger effect for a
polycrystalline material. Acta Materialia, 85, 229-242.
Chen, B., Smith, D. J., Flewitt, P. E. J. and Spindler, M. W. (2011). Constitutive equations that describe
creep stress relaxation for 316H stainless steel at 550 degrees C. Materials at High Temperatures,
28, 155-164.
Christian, J. W. (1975). The theory of transformations in metals and alloys : an advanced textbook in
Division I
Dong, Y., Nogaret, T. and Curtin, W. A. (2010). Scaling of dislocation strengthening by multiple obstacle
types. Metall. Mater. Trans. A, 41, 1954-1960.
Dyson, B. (1997). An alternative constitutive description of AISI 316 stainless steel for use in weld reheat
cracking. Report prepared for Nuclear Electric plc Barnwood Gloucester.
Embury, J. D., Deschamps, A. and Brechet, Y. (2003). The interaction of plasticity and diffusion
controlled precipitation reactions. Scripta Materialia, 49, 927-932.
Fanfoni, M. and Tomellini, M. (1998). The Johnson-Mehl-Avrami-Kolmogorov model: A brief review.
Nuovo Cimento Della Societa Italiana Di Fisica D-Condensed Matter Atomic Molecular and Chemical Physics Fluids Plasmas Biophysics, 20, 1171-1182.
Frost, H. J. and Ashby, M. F. (1982). Deformation-mechanism maps : the plasticity and creep of metals
and ceramics, Oxford, Pergamon Press.
Hirth, J. P. and Lothe, J. (1982). Theory of Dislocations, New York, John Wiley.
Hu, J. N. (2015). A theoretical study of creep deformation mechanisms of Type 316H stainless steel at
elevated temperatures. DPhil Thesis, University of Oxford.
Hu, J. N., Chen, B., Smith, D. J., Flewitt, P. E. J. and Cocks, A. C. F. (2015). Self-consistent modelling
and the evaluation of lattice deformation in a polycrystalline austenitic stainless steel. Materials
Today: Proceedings. In press.
Hu, J. N. and Cocks, A. C. F. (2015). A multi-scale self-consistent model describing the lattice
deformation in austenitic stainless steels. International Journal of Solids and Structures, Under
review.
Kamaya, M. (2009). A procedure for estimating Young's modulus of textured polycrystalline materials.
International Journal of Solids and Structures, 46, 2642-2649.
Kroner, E. (1961). On the Plastic Deformation of Polycrystals. Acta Metallurgica, 9, 155-161.
Kubo, K., Ohba, T., Kimura, K., Abe, F. and Yagi, K. (1994). Effect of changes in microstructure on
complex creep deformation behaviour of SUS 316. CAMP-ISIJ, 7, 1791-.
Kubo, K., Ohba, T., Kimura, K., Abe, F., Yagi, K. and Irie, H. (1996). Effect of microstructural evolution
on complex creep deformation behaviour of SUS 316 steel at 823K and 923K. CAMP-ISIJ, 9,
1435-.
Lagneborg, R. and Forsen, B. H. (1973). A model based on dislocation distributions for work-hardening
and the density of mobile and immobile dislocations during plastic flow. Acta Metallurgica, 21,
781-790.
Morris, D. G. and Harries, D. R. (1978). Creep and rupture in Type 316 stainless steel at temperatures
between 525 and 900C-Part 1: creep rate. Metal Science, 525-531.
Mura, T. (1982). Micromechanics of defects in solids, The Hague ; London, Martinus Nijhoff.
National Institute of Materials Science, N. (2003). Micrographs and Microstructural Characteristics of Crept Specimens of 18Cr-12Ni-Mo Stainless steel for Boiler and Heat exchanger seamless tubes (SUS 316H TB).
Ostrom, P. and Lagneborg, R. (1976). A recovery-athermal glide creep model. Journal of Engineering
Materials and Technology-Transactions of the Asme, 98, 114-124.
Schmidt, C. G. and Miller, A. K. (1981a). A Unified Phenomenological Model for Non-Elastic Deformation of Type-316 Stainless-Steel .1. Development of the Model and Calculation of the
Material Constants. Res Mechanica, 3, 109-129.
Schmidt, C. G. and Miller, A. K. (1981b). A Unified Phenomenological Model for Non-Elastic
Deformation of Type-316 Stainless-Steel .2. Fitting and Predictive Capabilities. Res Mechanica,
3, 175-193.
Shewmon, P. G. (1969). Transformations in metals, New York ; London, McGraw-Hill.