140
THE VISUALIZATION OF POWER DENSITY AND
TEMPERATURE DISTRIBUTION OF ELECTRONIC SYSTEM
USING ELLIPTIC PDE SOLVER
Norma Alias', Noriza Satam
2Zarith Safiza Abd. Ghaffar
2,'Institute ofibnu Sina University Teknologi Malaysia
81300 Skudai, Johor 2Department of Mathematics,
Faculty of Science, University Teknologi Malaysia
81300 Skudai, Johor Email: [email protected]
Abstract: The visualization of power density and temperature are critical in electronic-chip industries. Taking the advantages of mathematical algorithm that is based on elliptic equation of partial differential equation (PDE), the two-dimensional simulation has successfully been generated. The numerical iterative methods that are being used results in efficient elliptic PDE solvers. Numerical analysis is done in terms of execution time, number of iterations and computational complexity of the algorithm being used. The comparison is done between two iterative methods which are Gauss-Seidel and Red-Black Gauss Seidel. The elliptic solver is developed using C language and executed in Linux operating system's environment.
Keywords: full-chip thermal simulation, elliptic equation, power density distribution, temperature visualization, multilayered architecture.
1. INTRODUCTION
The increasing needs in managing energy efficiency in electronic-chip industries drives the route of research to produce efficient tools for predicting on-chip temperature behavior. The power and temperature visualization involves large scale of computational complexity and consuming lots of execution time. In this paper, the visualization of power density behavior and temperature distribution for multi-layer full-chip structure is being focused on. Figure 1 shows the packaging of multilayer full-chip structure including the heat spreader and heat sink are explicitly shown in the model below.
Full-chip
packaging
Figure 1: Simplified model of the multilayered full-chip structure
The solution that is based on numerical computational mathematics proposed the development of partial differential equation based on Poisson's equation oftWOdimensional
elliptic equations. The equation is discretized using Finite Difference Method (FDM) in order to transfonn it into matrix fonn.
2. MATHEMATICAL MODELING
Temperature distribution inside the multilayered chip is governed by the following Poisson's equation.
Where !(x,y) is the function introduced in [2]. The function introduced is as follows: (I)
!(x,y)
=
g(x,y)
k,(x,y)
(2)
With g(x,y)represent power density distribution on the multilayer full-chip and k,(x,y) is thennal conductivity of the layer at pointx,y. Whereas, the discretization of (I) results in
h2
Where p=
--,-
k-U i+1J- 2 u ij· +U,_lj U'j+1 - 2 u iJ' +U,J-I ( )
,
;
, + '
;
,
=f
x,y
h
k
Ui+l. J +ur-I,J
+
PUr,J+1-(2
+
2p)u"j
+
PU',J-l=!(x,y)
(3)
(4)
Assume that the chip is MxNof grid sIze and from [2] the on-chip power density distribution can be referred as
142
M-IN-I
(i1l(2m+l»)
(i
1l(2n+l»)
Pij
=
L Leos
cos
m=On=O
2M
2N
3. NUMERICALMETHODS
(5)
To numerically solve equation (4), we use the iterative methods which are Gauss-Seidel and
Red-Black Gauss-Seidel. A brief description for both methods is given below.
3.1 Gauss Seidel Method (GS)
Gauss Seidel method represents an improved version of 1acobi method in solving the system
of linear equations, AU;f. This method coined by the German mathematicians Carl Friedrich
Gauss and Philipp Ludwig von Seidel. By using previously computed results as soon as they
become available, this implementation is explicitly shown in the following pseudocode.
Set number of iterations
Calculations of equation (5)
For round: = 1 increase 1 until numbers of iterations do
Initial values
For timestep :=1 until convergence criterion met do
For i=lincrease 1 until matrix size do
For j=l increase until matrix size do
U1+ •I ..1
+
U1- •I ..1+
U1./·+1 -4u .
1•.1+
U'.1-. I=
f
(x, Y)
End loop j
End loop i
Check convergence
End loop timestep
End loop round
Figure 2: Pseudocode of Gauss-Seidel Iteration Method
3.2 Red-Black Gauss Seidel Method
Red-Black Gauss-Seidel method represents the same computational way as Gauss Seidel
method. The only difference is that this method divides the computation into two sub-regions
Set number of iterations
Calculations of power
For round: ~ 1 increase 1 until maximum number of iterations
(k)
doInitial values
For timestep :=1 until convergence criterion met do
For i= 1 increase until matrix size do
For j=l increase until matrix size do
If odd, do
U1+1 ..j
+
u
1- .j1+
UI.j+1 -4u .
I.j+
UI,j-.I=
!(x,y)
End loop j
End loop i
For i=lincrease 1 until matrix size do
For j=l increase until matrix size do
If even, do
U1+ ,j1·
+U
, - .j1·+U
I.j+·1-4u . +u .
I.j I.}-I=
!(x,y)
End loop j
End loop i
Check convergence
End loop timestep
End loop round
Figure 3: Pseudocode of Red-Black Gauss-Seidel Iteration Method
144
4. TEMPERATURE ALGORITHM
Boundary condition and Power Density Calculation
Numerical Method under consideration
Figure 4: Sequential algorithm of parabolic equation
Figure 4 shows the computational flow in calculating the temperature of multilayer full-chip architecture. The item countis the number of iterations taken in order to fulfill the stopping criterion. Variableroundis being referred as the number of time step in calculating U'Jvalue.
5. NUMERICAL RESULTS AND ANALYSIS
The two-dimensional visualization of power and temperature distribution for multilayer
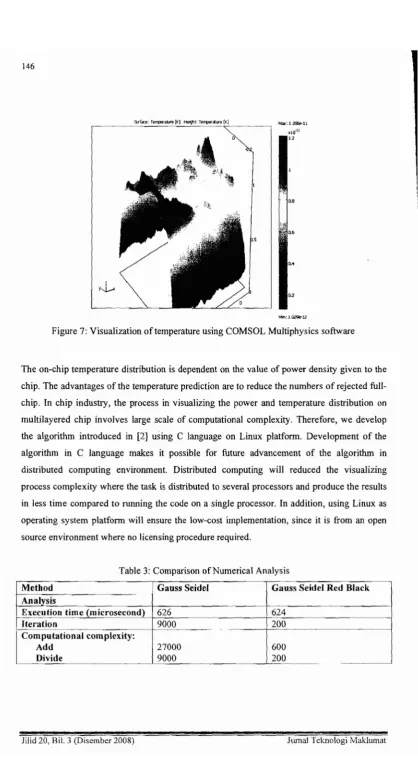
full-chip architecture is shown in figure 5 and 6. Visualization of graph (figure 5) is based on equation (5) and the graph of temperature (figure 6) is the result gained from equation (1). While figure 7 shows the three-dimensional visualization of the temperature profile using COMSOL Multiphysics software.
Table 1: Power density distribution based on grid value
xiy 0 I 2 3 4 5 6 7 8 9
0 201.95 203.71 205.11 206.00 206.31 206.00 205.11 203.71 201.95 200.00
I 201.76 203.35 204.61 205.42 205.70 205.42 204.61 203.35 201.76 200.00 2 201.40 202.66 203.66 204.30 204.52 204.30 203.66 202.66 201.40 200.00
3 200.90 201.71 202.35 202.76 202.90 202.76 202.35 201.71 200.90 200.00 4 200.31 200.59 200.81 200.95 201.00 200.95 200.81 200.59 200.31 200.00
5 199.69 199.41 199.19 199.05 199.00 199.05 199.19 199.41 199.69 200.00 6 199.10 198.29 197.65 197.24 197.10 197.24 197.65 198.29 199.10 200.00 7 198.60 197.34 196.34 195.70 195.48 195.70 196.34 197.34 198.60 200.00
8 198.24 196.65 195.39 194.58 194.30 194.58 195.39 196.65 198.24 200.00 9 198.05 196.29 194.89 194.00 193.69 194.00 194.89 196.29 198.05 200.00
Table 2: Temperature distribution based on grid value
xiv 0 I 2 3 4 5 6 7 8 9
0 28.00 28.00 28.00 28.00 28.00 28.00 28.00 28.00 28.00 28.00
I 28.00 133.48 181.42 196.61 204.82 203.60 202.44 195.48 179.93 142.96 2 28.00 180.60 248.17 281.48 286.85 290.82 285.59 276.13 250.61 194.51
3 28.00 194.60 279.80 309.06 324.17 322.73 320.49 307.88 279.03 214.80 4 28.00 201.61 283.24 321.92 330.37 334.29 329.42 318.00 287.64 221.29 5 28.00 199.41 285.48 318.24 331.79 332.58 330.04 318.28 288.54 222.04 6 28.00 197.66 279.03 314.17 324.64 327.52 324.51 313.88 284.92 219.70 7 28.00 190.65 269.08 300.50 311.59 313.68 311.56 301.69 274.67 212.19 8 28.00 175.63 244.03 271.69 280.69 282.84 281.02 272.82 249.07 193.42 9 28.00 139.87 189.55 208.99 215.46 216.87 215.71 209.66 192.36 150.17
208.00 206.00 204.00 ;;-202.00
S
200.00 ~ 198.00.i
196.00 :: G> 194.00 Q 192.00I
100.008.
16800 • 186.00 6 7 8 9M
Figure5: Power density distribution
lilid 20, Bil. 3(Disember 2008)
350.00 300.00
I.i
250.00 ! 200.00~
150.00E'
100.00 iii ~ 50.00 000: 0.0.1 2 4321 M
N 34 5 6 7 B glB 765
Figure6: Prediction of temperature behavior
146
0.2 0.8
l, ~-f
D.b .s
0.4
Mal:L206e-H
.10. 11
1.2
Mh:1,02Qe-12
Figure 7: Visualization of temperature using COMSOL Multiphysics software
The on-chip temperature distribution is dependent on the value of power density given to the chip. The advantages of the temperature prediction are to reduce the numbers of rejected full-chip. In chip industry, the process in visualizing the power and temperature distribution on multilayered chip involves large scale of computational complexity. Therefore, we develop the algorithm introduced in [2] using C language on Linux platform. Development of the algorithm in C language makes it possible for future advancement of the algorithm in distributed computing environment. Distributed computing will reduced the visualizing process complexity where the task is distributed to several processors and produce the results in less time compared to running the code on a single processor. In addition, using Linux as operating system platform will ensure the low-cost implementation, since it is from an open source environment where no licensing procedure required.
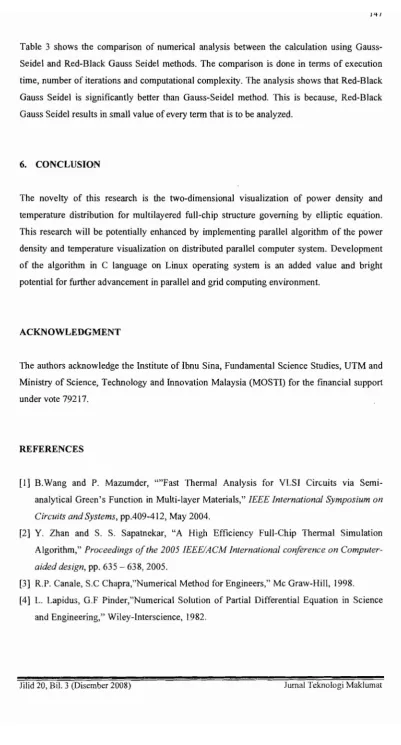
Table 3: Comparison of Numerical Analysis
Method Gauss Seidel Gauss Seidel Red Black Analvsis
Execution time (microsecond)
626
624
Iteration
9000
200
-Computational complexity:
Add
27000
600
Divide
9000
200
_.Table 3 shows the comparison of numerical analysis between the calculation using Gauss-Seidel and Red-Black Gauss Gauss-Seidel methods. The comparison is done in terms of execution time, number of iterations and computational complexity. The analysis shows that Red-Black Gauss Seidel is significantly better than Gauss-Seidel method. This is because, Red-Black Gauss Seidel results in small value of every term that is to be analyzed.
6. CONCLUSION
The novelty of this research is the two-dimensional visualization of power density and temperature distribution for multilayered full-chip structure governing by elliptic equation. This research will be potentially enhanced by implementing parallel algorithm of the power density and temperature visualization on distributed parallel computer system. Development of the algorithm in C language on Linux operating system is an added value and bright potential for further advancement in parallel and grid computing environment.
ACKNOWLEDGMENT
The authors acknowledge the Institute of Ibnu Sina, Fundamental Science Studies, UTM and Ministry of Science, Technology and Innovation Malaysia (MOSTI) for the fmancial support under vote 79217.
REFERENCES
[1] B.Wang and P. Mazumder, ""Fast Thermal Analysis for VLSI Circuits VIa
Semi-analytical Green's Function in Multi-layer Materials,"iEEE international Symposium on Circuits and Systems,ppA09-412, May 2004.
[2] Y. Zhan and S. S. Sapatnekar, "A High Efficiency Full-Chip Thermal Simulation Algorithm,"Proceedings of the 2005 iEEE/ACM international conference on Computer-aided design, pp. 635 - 638,2005.
[3] R.P. Canale, S.C Chapra,"Numerical Method for Engineers," Mc Graw-Hill, 1998. [4] L. Lapidus, G.F Pinder,"Numerical Solution of Partial Differential Equation in Science
and Engineering," Wiley-Interscience, 1982.
148
[5] Evans, D.J. "Group explicit methods for the numerical solution of partial differential equations, Gordon and Breach Science Publishers, 1997.
[6] R.L. Burden and J.D. Faires,''Numerical Analysis,"PWS-KENT Publishing Company, I 989.
[7] A. D. Polyanin, Handbook of Linear Partial Differential Equations for Engineers and Scientists, Chapman&Hall/CRC Press, Boca Raton, 2002.
[8] Arfken, G. Mathematical Methods for Physicists, 3rd ed.T Orlando, FL: Academic Press, pp. 485-486,905, and 912, 1985.