ABSTRACT
PARKER, DOUGLAS SEABROOK. Using Botanical Analysis to Shape a Longleaf Restoration Project. (Under the direction of Gary Blank.)
This thesis focuses on the rare and endangered Piedmont Transitional Longleaf Pine Community (PTLC) found on the Harris Research Tract (HRT) located in southern Wake County, North Carolina. The goal of this thesis is to lay a
foundation of knowledge to guide the restoration and preservation of the PTLC.
This guidance is via three different papers with three different perspectives (current,
historical, and social).
The current condition and range of the PTLC is assessed and verified through
the use of the North Carolina Vegetation Survey (NCVS). During the summer of
1997, 56 plots 20m X 50m were intensively surveyed. The data were analyzed using
cluster analysis, detrended correspondence analysis, canonical correspondence
analysis, and non-metric multidimensional scaling. The 1222 acre HRT was
subsequently divided into eight different forest communities of which two were
identified as variants of the PTLC.
The historical land use practices, identified in a previous study by Scott Bode,
are combined with the vegetation survey data to further refine the PTLC into input
levels for restoration. One portion of the PTLC is seen to contain no longleaf pine
and would require high input for restoration. Another portion is seen to have only
suffered fire suppression as evidenced by old photos, land records, and species
composition and would require low input for restoration. In addition, the vegetative
survey data is compared to other PTLC in North Carolina and the historical record
to generate a target list of species for longleaf community restoration.
As the study progressed, a social aspect that could become an obstacle to the
PTLC restoration effort presented itself. The negative attitude of the neighboring
communities of New Hill, Holly Springs, Fuquay-Varina, and Apex toward the use
of prescribed fire as a management tool became apparent after an incident in the
spring of 1998. This attitude based on old information could become an obstacle if
unchallenged. Thus, a white paper was written to the neighboring communities to
confront the mythos of the evilness of fire. A rationale discussing the need for the
DEDICATION
to my dad
DARRYL NEWTON PARKER, SENIOR
BIOGRAPHY
I was born in Charleston, SC on August 13, 1971 and grew up in North
Carolinas. My family has always lived on the edge of small towns, so I was never far
from the woods. We also made frequent day trips to the North Carolina mountains
and coast. From these early experiences, I discovered the diversity of North
Carolina's ecosystems and developed a fondness for the plant world. This early
fascination with plants lead me to pursue Bachelor of Science degrees in both Botany
and Horticultural Science, at North Carolina State University, which I completed in
May of 1994.
As an undergraduate, I completed an independent research project in Botany
under the direction of Dr. Jon Stucky. I presented the project before the Collegiate
Association of the North Carolina Academy of Science and won the John Dieux
Research Award (first place Biological Sciences III). As part of this award, I was
published in their official collegiate journal. I also participated in the First Annual NC
State University Undergraduate Research Symposium, where I received one of eleven
equivalent recognition awards out of seventy participants.
Throughout my life, I have always had an appreciation of history. This
appreciation was expressed in the acquisition of a undergraduate minor in history and
(at the time of this writing) nine years participation with the Society for Creative
Anachronism. After graduation, I worked for two years. In 1996, I returned to NC
State University but this time to the College of Forest Resources to pursue this
ACKNOWLEDGMENTS
I would like to thank the following people who helped or had an input in the following areas:
The Landowner and Grantor:
Carolina Power and Light
My Committee Members:
Dr. James Svara Dr. Thomas Wentworth Dr. Gary Blank
Field work:
Shannon MacDonald David Cook Sarah Lynn Hitchner James Cooper
Stacey Norris Kimberly Eaton
Mark Romagosa
Plant Identifications:
Dr. Jon Stucky Dr. Robert Wilbur Jennifer Floyd
Data:
Chris Ulrew Amaechi Okigbo
John Fels Ray Tucker
Susan Langley
Input:
Cecil Frost Michale Shafale Jose Castro
And moral support:
Caroline Williams (mom) Jennifer Nerone
Amy Slavin Sandra Wash
Darryl Parker Esther Campbell
Kimberly Eaton James Cooper
Margaret King Donna Wright
TABLE OF CONTENTS
Page
LIST OF TABLES ...iv
LIST OF FIGURES ...v
INTRODUCTION ...1
BOTANICAL COMMUNITY ANALYSIS OF THE HARRIS TRACT ...6
Introduction ...6
Background ...7
Methods and Materials ...10
Data Summary and Analysis ... 13
Results ...15
Environment ...15
Cluster Analysis ...15
Detrended Correspondence Analysis ... 16
Conclusions ...17
Discussion ...18
References Cited ...37
INTEGRATION OF HISTORICAL AND BOTANICAL INVENTORY DATA ON THE HARRIS TRACT ... 38
Introduction ...38
Methodology ...39
The Current Status of the PTLC Forest ... 41
Background ...41
Variant I ...43
Variant II ...45
Northeast ...46
Central Ridge ...48
Restoration ...51
Comparing the Harris Research Tract to the
Historical Record ...56
Conclusions ...58
References Cited ...65
AN ARGUMENT FOR RESTORING FIRE ECOLOGY TO THE SHEARON HARRIS LANDS ...67
Introduction ...67
Part I ...69
Importance of PTLC ...69
Changing Attitudes on the use of Prescribed Fire ... 72
Applicable Laws and Regulations ... 75
Strategies for CP&L ...77
Part II ...80
Rationale for the White Paper ... 80
The White Paper: A Letter to the Community Leaders of Holly Springs, Fuquay-Varina, New Hill, and Apex ... 82
Introduction ...82
Background ...82
Benefits and Alternatives of Prescribed Fire ... 84
Ecosystem Restoration and Health ... 84
Wildlife Habitat Maintenance ... 85
Nutrient Recycling ...86
Plant Reproduction ...86
Fuel Reduction ...87
Air Quality ...88
Conclusions ...89
References Cited ...90
APPENDIX A ...91
Group A -- Bottomlands ...91
Bottomland Loblolly Pine Forest (GA-1) Moist Variant ... 91
Bottomland Hardwood/Pine Forest (GA-2) Moist Variant ... 91
Bottomland Hardwood/Pine Forest (GA-3) Wet Variant ... 92
Bottomland Loblolly Pine Forest (GA-4) Wet Variant ... 92
Historical Integration ...93
Group B -- Uplands ...94
Mixed Pine/Hardwood Forest (GB-1) ... 94
Mixed Hardwood/Pine Forest (GB-3) ... 94
Historical Integration ...95
APPENDIX B ...97
Harris Tract Master Species List ...97
Extend Species Listings (Informal Surveys) ... 101
Soils Data ...109
Topographic Data ...113
Terrain Variables ...117
LIST OF TABLES
Page
BOTANICAL COMMUNITY ANALYSIS OF THE HARRIS TRACT
Table 1. Plot Groupings ...22
Table 2. Basal Area of Selected Species (m2) ... 22
Table 3. Cover Value of Selected Species ... 23
Table 4. Forest Types and Associated NCVS Plots ... 24
INTEGRATION OF HISTORICAL AND BOTANICAL INVENTORY DATA ON THE HARRIS TRACT Table 1. Forest Types and Associated NCVS Plots ... 59
Table 2. Basal Area of Selected Species (m2) ... 60
Table 3. Cover Value of Selected Species ... 61
Table 4. Synopsis of Scott Bode's Historical Record ... 62
Table 5. Peet and Allard (1993) Description ... 63
Table 6. Shafale (1994) Description ...63
Table 7. Restoration Species Composition Recommendation ... 64
APPENDIX B Table 1. Forest Community Average Basal Areas (m2) ... 102
Table 2. Forest Community Average Mean Cover Values ... 103
LIST OF FIGURES
Page
BOTANICAL COMMUNITY ANALYSIS OF THE HARRIS TRACT
Figure 1. Plot Distributions ...25
Figure 2. Cluster Analysis Dendrogram ... 26
Figure 3. Initial DCA of All Plots ... 27
Figure 4. Overlay of Juncus effusus Abundance for All Plots ...28
Figure 5. Overlay of Pinus echinata Abundance for All Plots ... 29
Figure 6. Secondary DCA of Group B ... 30
Figure 7. Overlay of Pinus echinata Abundance in Group B ... 31
Figure 8. Overlay of Pinus palustris Abundance in Group B ... 32
Figure 9. Overlay of Pinus taeda Abundance in Group B ... 33
Figure 10. Overlay of Quercus falcata Abundance in Group B ... 34
Figure 11. Overlay of Quercus phellos Abundance in Group B ... 35
Figure 12. Forest Communities of the Harris Research Tract ... 36
Introduction
The Harris Research Tract (HRT) in southern Wake County was leased to
NC State University in 1985 to enhance research and demonstration. To date, the
HRT has primarily served as a convenient laboratory for teaching undergraduate
forestry students to apply their knowledge in forest planning exercises. Relatively
close to the main campus, of sufficient size to meet specific pedagogical needs, and
essentially maintained in custodial care rather than active silviculture since the mid
1970s, the HRT serves the Department of Forestry's educational aims.
During this period of educational use, the HRT's potential as a research
laboratory -- "involving collection of data on natural habitats and animal populations
and to demonstrate various successional stages and management practices for forests,
old fields, and wetlands" (CP&L Lease, 1985) -- was relatively neglected. However,
the forestry students' inventory and planning activities on the HRT generated
information suggesting several potential lines of research inquiry. Notable among
information generated was the observation that some HRT stands of natural origin
included longleaf pine (Pinus palustris). The observations of longleaf presence, coupled with regionwide attention to overall decreases in longleaf pine forest
acreage, generated questions about the HRT's history and about pre-settlement
condition of the land. These questions prompted thesis research by Scott Bode and
his writing of an environmental and land use history for the HRT. That work, in
2
of associated vegetation communities on the HRT. Hence, the possibility of
restoring a viable longleaf community where appropriate emerged as a focus for
research and demonstration on the HRT.
This study had two major goals: refining basic data necessary for a
management plan and groundwork for the restoration of longleaf pine. In
accomplishing these goals, the study naturally diverged into three distinct tasks: the
botanical inventory, the historical integration, and the addressing of obstacles to
implementing a management plan. The amount of information generated is extensive
and is documented in the Appendix. From this wealth of information, the thread of
longleaf restoration was followed as an organizational theme for this thesis. Longleaf
restoration was chosen because we believe that restoring the original Piedmont Transitional Longleaf Pine Community (PTLC) is an important conservation issue on the HRT. The thesis evolved into three papers, reflecting the distinctiveness of
the three original goals.
The botanical inventory was conducted during the summer of 1997 and was
necessary for three reasons: establishing permanent research plots, classifying the
forest communities, and focusing the restoration effort. The permanent research
plots establish a baseline for monitoring changes in vegetation as the restoration plan
and conventional management are implemented. The permanent plots also lend
themselves to other research efforts such as entomological and ornithological
3
PTLC type of the HRT and locate the concentrations of extant longleaf pine.
Previously, only commercial timber stand typing had been conducted on the tract.
Because the timber typing was based on low intensity surveying and did not examine
the herbaceous component, it did not precisely identify the variety of ecological plant
communities. The botanical inventory divided the HRT into community types for
specific management purposes. Finally, the botanical inventory focused the
restoration effort. The first paper of the thesis was written to illustrate how the
analysis of the botanical inventory data allowed portions of the HRT to be delineated
as distinctively PTLC. This delineation allowed the restoration effort to focus on the
remnant PTLC on the HRT.
The forest communities identified by the botanical inventory were examined
through the perspective of past land use practices that occurred on the HRT. This
historical integration built directly upon the work previously done by Scott Bode.
The integration was necessary to tailor the management plan for best utilization of
the HRT in three ways: future impacts, future use, and refining the longleaf
restoration effort. By examining how human use influenced the current vegetation,
the original community components and the result of that influence became readily
apparent. Separating what is original from what was generated by human
disturbance allows some insight into what the future impact will be of changes we
make to the HRT today. Having a baseline for prediction allows for better decision
4
future. This concept has already altered the course of the HRT. Recently CP&L
acquired an in-holding of private land that had been clearcut. Initially, CP&L
planned to replant this acreage in loblolly pine but the information generated in the
current study persuaded them to plant longleaf pine instead. This decision will
directly benefit the longleaf restoration effort by eliminating a seedsource of invasive
loblolly on the west boundary of the PTLC. Finally, the historical integration refined
the restoration effort. It is this refinement that the second paper emphasizes. It
analyzes the PTLC forest type identified in the botanical inventory through the
perspective of past land use practices to predict the effort that would be required to
restore portions of the PTLC.
Having identified those acres with maximum restoration potential of PTLC
through future management, I discovered obstacles to implementation. The third
goal of addressing obstacles to longleaf restoration evolved from my desire to
acquire a minor in Public Administration. In this context, it became apparent that
developing a management plan to restore longleaf pine to the HRT would be
meaningless if the public opposed the implementation of the plan. The management
plan requires the use of prescribed fire to restore the PTLC ecosystem, a practice
opposed by the neighboring communities. In an effort to further the goals of the
research project, the third paper confronts the public opposition to prescribed
burning. It is divided into two parts, (1) the rationale and background and (2) a
5
how perception of fire usage has changed over the years, resulting in the current
opposition, and examines the current applicable laws. The white paper is an open
letter to the neighboring communities. It is tailored to emphasize how prescribed fire
would benefit their communities and how blocking its usage would threaten their
quality of life.
In summary, the first paper comprises a botanical inventory which divides the
1222 acre HRT between the 776 acres that are not PTLC from the 546 acres that are
PTLC. The second paper, the historical integration, further reduces the 546 acres
of PTLC to approximately 450 acres with high potential for longleaf restoration.
Finally, the third paper addresses public opposition to the use of prescribed fire which
6
The Botanical Community Analysis of the Harris Tract
Introduction
A land use history written for the Harris Research Tract (HRT) (Bode, 1997),
located in southern Wake County, North Carolina, suggested that portions of the
HRT could be botanically interesting and merited special management consideration.
Such interest focused on the suggested existence of a remnant Piedmont Transitional Longleaf Pine Community (PTLC). The remnant forest was suggested by a combination of the abundance of longleaf pine and the HRT's location within the
historically cited range of the PTLC. Schafale and Weakley (1990) quote Ashe and
Pinchot (1897) as noting "a transitional forest of Pinus palustris with various dry oaks in Nash, Wake, Montgomery, Northhampton, and Halifax Counties." Ashe adds
that "the area on which long-leaf pine is the dominant tree, or where it yet exists side
by side with the loblolly pine, extends ... (within the transitional division) westward
to Cary (in Wake County)." Ashe and Pinchot also state that "these (transitional)
forests are best developed in the middle and southern parts of Nash county, the
eastern part of Wake, and the western part of Montgomery."
According to Bode, any management plan developed for the HRT should
include provisions for the possible existence of a remnant PTLC. However, the
botanical composition and areal extent of the forest communities on the HRT had not
7
and groundcover vegetation components were only generally known, and plant
species distributions could only be surmised. Hence, the existence of a remnant PTLC
could not be determined without more detailed information concerning the total
vegetation composition of the forest communities. To this end, the HRT was
systematically sampled using the North Carolina Vegetation Survey (NCVS).
The data associated with this inventory will be filed with the Natural Heritage
Program and incorporated in the Nature Conservancy's ongoing efforts to catalog the
vegetation of North Carolina. The data were analyzed and the interpretation of the
patterns resulting from these analyses revealed forest community types. This thesis
postulates that the data analysis ultimately manifests a remnant Piedmont Transitional Long Leaf Pine Forest as extant and distinct on the HRT.
Background
The species composition of the original PTLC found within North Carolina
is poorly understood (Shafale, 1994). But a species composition list for comparative
purposes can be acquired from a combination of historical references and neighboring
forests identified as longleaf variants. Frost (1993) comments on Sargent's 1884
observations: "the second major assemblage of communities was the transitional
forest between the coastal plain regions dominated by nearly pure stands of longleaf,
and the oak-hickory-shortleaf pine woodlands of the Piedmont. Sargent described the
8
intermixed with hardwoods and scattered long leaved pine.' " Frost (1990), quoting
Mohr and Harper, says they "pictured the transitional forest as open woodland with
a geographically varying mixture of dominant trees. Those trees were longleaf,
shortleaf, loblolly pine, post oak, white oak, southern red oak, hickories, and various
scrub oaks."
Within this transition zone, it is believed that longleaf either dominated in
nearly pure stands along ridgetops and south facing slopes surrounded by mixed pine
hardwood communities lacking longleaf, or in natural stands where longleaf occurred
mixed with other pine and hardwood canopy dominants (Frost, 1990). Wahlenberg
(1946) noted this distribution: "further inland, the longleaf pine forest followed
multiple ramifications of minor ridges, leaving the lower sites -- those too moist to
burn over often -- to hardwood trees. These hardwoods were usually mixed with
loblolly pine and sometimes shortleaf pine in the northern and western portions of the
longleaf belt."
Peet and Allard (1993) conducted a survey of the longleaf pine belt using the
same NCVS method employed in the inventory of HRT. In their survey the HRT
would be between the Piedmont/Upland Subxeric Longleaf Woodland, the Fall-line
Slope Mesic Longleaf Woodland, and the Atlantic Mesic Longleaf Woodland. Peet
and Allard (1993) listed the dominant species as follows:
9
Vaccinium arboreum, Vaccinium crassifolium, Andropogon spp., and
Schizachyrium spp. Other species included Diospyros virginiana, Pteridium aquilinum, Dichanthelium spp., Pityopsis graminifolia, Tephrosia virginiana, Solidago odora, Aronia arbutifolia, Asplenium platyneuron, Aristida stricta, and Gelsemium sempervirens.
Fall-Line Slope Mesic Longleaf Woodland: Pinus palustris, Quercus marilandica, Diospyros virginiana, Nyssa sylvatic, Kalmia latifolia, Gaylussicia dumosa, Gaylussacia frondosa, Lyonia mariana, Vaccinium tenellum, and Smilax rotundifolium. Other species included: Oxydendrum arboreum, Hypericum hypericoides, Myrica cerifera, and Pityopsis graminifolia.
Atlantic Mesic Longleaf Woodland: Pinus palustris, Quercus stellata, Quercus falcata, Quercus nigra, Liquidambar styraciflua,
various shrubs, Aristida stricta, Schizachyrium scoparium, and
Pteridium aquilinum. Others included Quercus marilandica, Carya alba, Ilex glabra, Gaylussacia frondosa, Gaylussacia dumosa, Lyonia mariana, Eupatorium rotundifolium, Euphorbia corollata,
and Solidago odora.
Schafale also surveyed a North Carolina longleaf forest variant using the
NCVS method. He lists southern Wake County as within the “Middle Inner Coastal
Plain." Schafale (1994) describes the Piedmont Longleaf forest as:
...all communities in the Piedmont Region with a significant natural component of longleaf pine. Most of the few examples remaining have fairly dense mixed canopies of longleaf, loblolly, and shortleaf pine and hardwoods, usually southern red oak, post oak, and hickories. The mixed pine composition may be natural, though loblolly pine has undoubtedly increased at the expense of longleaf due to past cutting and fire suppression
10
compositum
Given these characterizations for purposes of comparison, the research task
was to sample the range of plant communities extant on the HRT and evaluate their
composition. Due to the potential importance of finding another Piedmont Transitional Longleaf Pine Community site, use of the NCVS protocol to document the site's plant composition was justified.
Methods & Materials
During June through September of 1997, vegetation data were collected from
56 plots (each 20 X 50 meters) across the 1222 acre HRT [Figure #1]. The number
of plots was determined by resource limitations. Fifty of the plots were chosen by
stratified-random selection using dominant soil series and stand delineations. The six
remaining plots were placed either to fill coverage gaps (157, 158, 059) or highlight
specific areas (155, 156, 060). Soil series (Mayodan, Creedmoor, and Miscellaneous)
were identified from the 1970 Wake County Soil Survey (Cawthorn, 1970). The
stand delineations (pine plantation, pine, mixed pine-hardwood, mixed
hardwood-pine, hardwood) were determined by forestry students in the Spring 1997 course,
Forest Inventory, Analysis, and Planning, who delineated the stands based on abundances of tree species with commercial timber value. Pine plantations were
11
the 1970's to control erosion. Having been cleared totally and converted to cropland
at various historic points, these areas could tell us little about the natural communities
on the HRT.
Plots were placed to maximize plant community homogeneity, avoid effects
of disturbance, and maximize topographic homogeneity. Disturbance signs (plow
lines, fire scars, etc) were noted. Each 20 X 50 meter plot consisted of ten 10 X 10
meter modules. A block of four central modules was more intensively surveyed using
nested subplots (0.01, 0.1, 1.0, and 10m²) located in two corners of each module.
The corners for the nested subplots were chosen to avoid congruent sides with nested
subplots in adjacent modules. The plot centerline and the outside corners of the four
intensive modules were permanently staked using 15" sections of ½" metal electrical
conduit to ensure relocation for future forest management research. Plot locations
were recorded using Global Positioning System (GPS) technology.
Following the North Carolina Vegetation Survey (NCVS) methodology (Peet
et al., 1998), I conducted vegetation measurements of percentage cover (the vertical
projection of each species' above ground portion onto the module) and diameter stem
counts (each species of trees, shrubs, and woody vines reaching breast height of 1.37
m). In each intensive module, percentage cover values were estimated for all vascular
species in each nested subplot and the entire 100 m². Additional species found in the
remaining six non-intensive modules were assigned percentage cover values based on
12
Braun-Blanquet scale (employed by Peet et al., 1998). The classes are as follows:
trace=1; 0-1%=2; 1-2%=3; 2-5%=4; 5-10%=5; 10-25%=6; 25-50%=7; 50-75%=8;
75-95%=9; 95-100%=10. For each intensive module and collectively for the six
non-intensive modules, stems were tallied into the following diameter classes: 0-1cm;
1-2.5 cm; 2.5-5 cm; 5-10 cm; 10-15 cm; 15-20 cm; 20-25 cm; 25-30 cm; 30-35 cm;
35-40 cm; and larger than 40 cm to the nearest cm.
Terrain variables were generated from the USGS New Hill 7.5 minute
quadrangle digital elevation model. Data were unavailable for plot 060; thus it was
removed from all terrain variable analysis. Calculations were performed using
programs specially written by Dr. John Fels, NC State University School of Design.
The variables generated included the following: elevation in meters; slope steepness;
maximum slope steepness; slope direction (azimuth); Beers cosine transformation of
azimuthal aspect (at NE, ENE, & NNE); slope profile curvature; slope section
curvature; net slope curvature; terrain shape index (TSI); Landform Index (LFI);
aspect-weighted Landform Index; landscape position (at 6, 12, 18, 24, and 36
meters); and watershed (catchment) area.
Topographic position was recorded at the following seven levels: ridge top,
level upland, upper slope, middle slope, lower slope, higher terrace or floodplain
further from stream, and lowermost terrace or floodplain adjacent to stream. Relative
exposure was recorded at the following seven levels: extremely exposed, high (ridge
13
intermediate (mid slope facing adjacent slope), protected, and extremely protected.
Mineral soil samples were collected from the subsoil and a surface soil sample
taken from a composite from the centers of the four intensive modules. The soil
samples were analyzed by the NC Agricultural Soil Testing Laboratories. Each sample
was analyzed for weight by volume, pH, buffered acidity, cation exchange capacity,
percent base saturation, percent organic matter, elemental phosphorous, potassium,
calcium, magnesium, sodium, manganese, zinc, and copper.
Data Summary and Analysis
SAS procedures were used to summarize the vegetation data. Using cover
class midpoints for the intensive modules, I calculated a mean cover value for each
vascular species for the entire 0.1 ha plot. Field values were unaltered for species in
non-intensive modules. Midpoints of diameter classes were used to calculate stem
basal area on a hectare basis for each woody species. PC-ORD programming was
used to perform a cluster analysis using Ward's method with Euclidean distance. The
method, which distributes plots based on the difference in species composition,
produced a dendrogram which provided useful guidelines that assisted in grouping
plots. The basal area and mean cover value were averaged for the plots within the
groupings identified by the cluster analysis.
Detrended Correspondence Analysis (DCA) was used as an alternative means
14
within the data. By overlaying the groupings, identified by the cluster analysis, with
the data variables, I was better able to interpret the cluster analysis. The graphics
portrayed relative species abundance via size differences in plot DCA icons. The
DCA also provided r-values which indicate the correlation coefficients of species
abundance with DCA axis scores for the plots. When the DCA was performed,
outlier plots became apparent. These were removed by eliminating the plots' data
from the run. They were removed because marginal positioning of the outliers
tightened the other plots' groupings such that clarity was lost. Canonical
Correspondence Analysis and Non-Metric Multidimensional Scaling analysis routines
were also performed, but they added no new insights.
Classification of the forest communities was based on the average basal area
and mean cover values of the subgroups recognized in the dendrogram. For the
purposes of brevity, only the analysis of subgroups containing longleaf pine are
completely explained in this paper. For full descriptions of excluded groups, please
refer to Appendix A.
Two subgroupings, with different land use histories, were seen as potential
candidates for PTLC status. Because the differential land use practices would have
destroyed and/or preserved different aspects of the original forest type, a composite
archetype was chosen for comparison with the historical record. The plots with the
highest longleaf basal area were selected from the two subgroups to represent the
15
Results
Environment
The terrain of the tract is predominately ridge top and level upland with
streams flowing easterly and westerly from the north/south ridge spine. The elevation
variation of the plots was 35 meters (115 feet) with plot 52 the lowest at 75 meters
(246 feet) and plots 107 and 112 the highest at 110 meters (361 feet). All measures
are above mean sea level. Soil sample analysis portrayed the tract as being essentially
uniformly nutrient poor.
Cluster Analysis
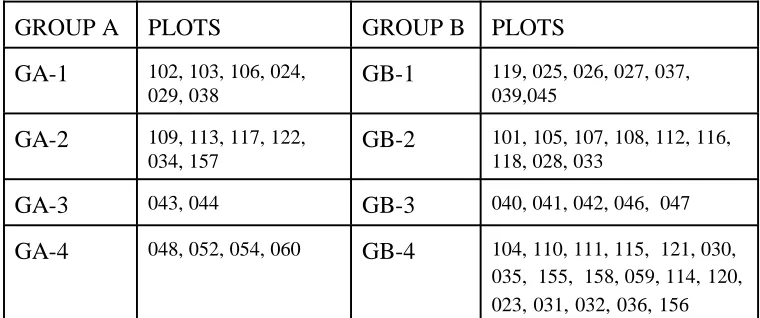
The cluster analysis dendrogram [Fig #2] shows an initial split of the plots into
two major groups -- GROUP A consisting of 18 plots and GROUP B consisting of
38 plots. Each Group was further divided into four subgroups (GA-1 through GA-4
and GB-1 through GB-4) based on high level splits within the dendrogram. Table 1
shows the plot groupings from the dendrogram.
The basal area and mean cover values for Group A are presented for
comparative purposes only and were consolidated as follows: GA-1 with GA-4 and
16
basal area for selected species and Table 3 presents the mean cover value for selected
species.
Detrended Correspondence Analysis (DCA)
The initial DCA overlay for all plots [Figure #3] shows Group A plots
consolidating on the right and Group B plots on the left. Juncus effusus [Figure #4] is seen to be more abundant in Group A plots while Pinus echinata [Figure #5] shows greater abundance in Group B plots. There was no Juncus effusus in Group B plots and only traces of P. echinata and P. palustris in Group A plots. The low abundance of longleaf pine in Group A plots excluded them from further consideration in the
paper.
The initial DCA of Group B identified plot 047 as an outlier. The second
DCA, following the elimination of plot 047 [Figure #6], maintained the subgroup's
distinction. GB-1 is in the upper right, GB-2 the lower right, GB-3 the central right,
and GB-4 to the lower left. Both Pinus echinata [Figure #7] and Pinus palustris
[Figure #8] show an increase in abundance towards GB-2 & GB-4. This is confirmed
by the basal areas for the subgroups [Table 2]. Basal area values for plots 104, 110,
111, 115, 121, 030, 035, 155, 158, and 059 of GB-4 are the highest for P. palustris
on the tract. Pinus taeda [Figure #9] shows an increasing abundance towards GB-1, GB-2, and GB-3. Basal area data show these three subgroups as having over twice
17
shows a sharp increase in abundance towards GB-4. Basal area data show GB-4 plots
as having 3 to 6 times the abundance of southern red oak as compared to 1,
GB-2, and GB-3. Quercus phellos [Figure #11] shows an increase in abundance towards GB-1, 2, &3. The basal area data show GB-4 to have no willow oak.
Conclusions
The compositional break between Group A plots and Group B plots appears
to be the result of relative landscape position. The distributions of Juncus effusus, an obligate wetland species, and Pinus echinata, an obligate upland species, support this supposition. Thus, Group A plots tend to occur in the stream corridors, floodplains,
and bottomlands. Group B plots occur on the upper slopes, ridge tops, and level
uplands. The nearly exclusive occurrence of longleaf pine within Group B plots
qualifies them for PTLC status.
Further examination of species composition within Group B shows P. echinata and P. palustris concentrating almost exclusively in GB-4 and GB-2 and P. taeda in GB-1, GB-2, and GB-3 [Figures #7, #8, and #9]. Loblolly pine is least concentrated in GB-4 but increases in concentration from GB-1, to GB-2 to become
most concentrated in GB-3. The initial split in the dendrogram [Figure #1] for Group
B appears to distinguish the high loblolly pine, low longleaf pine plots (GB-1, GB-2,
& GB-3) from low loblolly pine, high longleaf pine plots (GB-4). The next division
18
division splits the mixed longleaf pine, shortleaf pine, and loblolly pine plots (GB-2)
from the plots with more hardwoods (GB-3). Because of their high abundance of
longleaf pine, GB-2 and GB-4 are the prime candidates for Piedmont Transitional Longleaf Pine Communities designation.
Discussion
Both GB-2 and GB-4 appear to represent the PTLC on the HRT as separate
variants resulting from two different disturbance histories. Thus, the archetype PTLC
for the HRT was chosen from these two subgroups. The archetype's species
composition was then compared to the historical record and neighboring longleaf
forest. From this comparison, the HRT is seen to have compositional identity with
both Peet and Allard (1993) and Shafale's (1994) surveys and neighboring identified
tracts without precisely matching any one of them. The following list identifies the
species observed on the HRT as they relate to the historical documentation and the
surveys:
Common to all: (high abundance) Pinus palustris, Quercus falcata, Quercus stellata, Nyssa sylvatica, Oxydendrum arboreum, Diospyros virginiana, Smilax rotundifolium, (low abundance) Quercus marilandica, Pityopsis graminifolia, Pteridium aquilinum, Solidago odora, and Vaccinium arboreum.
Piedmont only: (high) Pinus echinata, Acer rubrum, Cornus florida, Gelsemium sempervirens, Toxicodendron toxicarium (low) Andropogon spp., Silphium compositum, Chasmanthium laxum, Dichanthelium species, Vaccinium arboreum, Vaccinium crassifolium, Vaccinium pallidum, Tephrosia virginiana, Aronia arbutifolia, and Asplenium platyneuron.
19
cerifera, Eupatorium rotundifolium, and Euphorbia corollata.
Historical record only: Quercus alba
Not present: Gaylusaicia dumosa, Pinus virginiana, Quercus prinus, Vaccinium tenellum, Kalmia latifolia, Schizachyrium spp., Vaccinium stamineum, Aristida stricta, Carya tomentosa, and Ilex glabra
Present in high quantities on the HRT but not mentioned in either survey:
Vaccinium corymbosum, Amelanchier arboreum, Chimaphila maculata, Euonymous americana, Fagus grandiflora, Ilex opaca, Juniperus virginiana, Liriodendron tulipifera, Prunus serotina, Quercus phellos, Quercus rubra, Sassafras albidum, Smilax glauca, Viburnum dentatum, and Vitis rotundifolia.
From the above list it can be seen that the archetype has species common to
both the Piedmont and Coastal plain. Evidence of a transitional nature emerges in
species that are found within either the xeric or mesic types but not both. In addition,
the archetype lacks species found in both and has a suite of species found within itself
but neither of the others. The archetype also retains the historically recorded white
oak not mentioned in either of the other surveys.
The current dominance of Acer rubrum and Pinus taeda and in some areas
Liquidambar styraciflua is probably not the natural state of the forest and is likely due to human activities influencing forest succession. But it does appear that Pinus echinata and the Quercus spp. are prominent in the archetype. The restoration of fire would be expected to remove Gaylussacia frondosa from its dominance of the herb layer. Quercus marilandica appears in several plots, suggesting it may have been more prevalent during the fire community regime.
Currently, there does not appear to be a herbaceous species that substitutes
20
fire. As Frost (1993) notes, "the original grass-forb herbaceous layer was probably
eliminated through a combination of increased shade and the deep accumulation of
pine needle litter and duff." Wiregrass would not likely be the herbaceous dominant
in this PTLC because the tract is on the northern border of wiregrass’ natural range.
However, this area would be within the range for Andropogon species to be the
herbaceous dominant to carry low intensity fires. (Peet et al., 1993). Suggestive of
this are traces of Andropogon species on the tract. Thus, burning will probably
restore Andropogon.
The comparison of the plots from GB-2 and GB-4 with the historical record
and neighboring related forest types shows a strong species compositional similarity.
From this, it is concluded that at least two variants of the Piedmont Transitional Long Leaf Pine Forest are extant and distinct on the HRT. The two variants are seen to contain the historically predicted associates of Pinus echinata and Gaylussacia frondosa and the high abundance of the predicted hardwood species, Quercus falcata, that occurs after years of fire suppression.
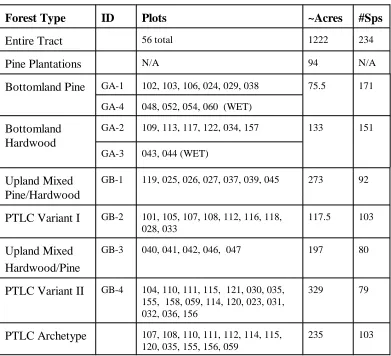
The relative distribution of the species among the subgroups allowed for the
identification of the forest communities. Group A forest communities are listed in
Table 4. Within Group B three major forest communities are recognized: (1)
pine/hardwood forest represented by GB-1; (2) hardwood/pine forest represented by
GB-3; and (3) two variants of the PTLC represented by GB-2 and GB-4 [Table 4].
21
history and is scattered around the edges of GB-4. GB-4 is the variant with the
highest longleaf concentrations and lower timbering history and runs along the main
ridge. Thus, efforts for longleaf restoration should be concentrated in the areas
defined by these plot groupings. Figure #12 shows the distribution of the forest types
across the HRT.
22 TABLE 1: PLOT GROUPINGS
GROUP A PLOTS GROUP B PLOTS
GA-1 102, 103, 106, 024, 029, 038
GB-1 119, 025, 026, 027, 037, 039,045
GA-2 109, 113, 117, 122, 034, 157
GB-2 101, 105, 107, 108, 112, 116, 118, 028, 033
GA-3 043, 044 GB-3 040, 041, 042, 046, 047
GA-4 048, 052, 054, 060 GB-4 104, 110, 111, 115, 121, 030, 035, 155, 158, 059, 114,120, 023,031,032,036,156
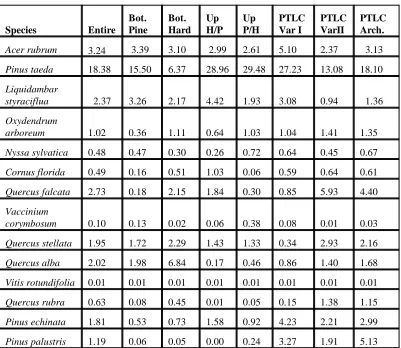
TABLE 2: BASAL AREA OF SELECTED SPECIES (m
2)
Species Entire GA-1 GA-4 GA-2 GA-3 GB-3
GB-1 GB-2 GB-4
Acer rubrum 3.24 3.39 3.10 2.99 2.61 5.10 2.37
Pinus taeda 18.38 15.50 6.37 28.96 29.48 27.23 13.08
Liquidambar
styraciflua 2.37 3.26 2.17 4.42 1.93 3.08 0.94
Oxydendrum
arboreum 1.02 0.36 1.11 0.64 1.03 1.04 1.41
Nyssa sylvatica 0.48 0.47 0.30 0.26 0.72 0.64 0.45
Cornus florida 0.49 0.16 0.51 1.03 0.06 0.59 0.64
Quercus falcata 2.73 0.18 2.15 1.84 0.30 0.85 5.93
Vaccinium
corymbosum 0.10 0.13 0.02 0.06 0.38 0.08 0.01
Quercus stellata 1.95 1.72 2.29 1.43 1.33 0.34 2.93
Quercus alba 2.02 1.98 6.84 0.17 0.46 0.86 1.40
Vitis rotundifolia 0.01 0.01 0.01 0.01 0.01 0.01 0.01
Quercus rubra 0.63 0.08 0.45 0.01 0.05 0.15 1.38
Pinus echinata 1.81 0.53 0.73 1.58 0.92 4.23 2.21
23
TABLE 3: COVER VALUE OF SELECTED SPECIES
Species Entire
GA-1 GA-3
GA-2
GA-3 GB-3 GB-1 GB-2 GB-4
Acer rubrum 5.8 6.1 6.1 5.8 6.0 6.3 5.0
Pinus taeda 5.4 5.5 3.0 6.8 6.7 6.2 5.3
Liquidambar
styraciflua 4.8 5.4 4.4 5.2 4.6 5.4 4.2
Oxydendrum
arboreum 4.4 2.8 4.9 3.2 5.0 4.0 5.4
Nyssa sylvatica 4.3 4.5 4.1 3.0 5.0 3.9 4.5
Cornus florida 3.8 2.5 4.5 5.6 2.0 4.2 4.1
Quercus falcata 3.7 3.3 4.1 2.0 2.6 2.8 5.1
Vaccinium
corymbosum 3.5 3.4 2.8 3.6 4.3 3.7 3.5
Quercus stellata 3.5 3.7 3.9 2.4 3.6 1.9 4.2
Quercus alba 3.3 2.8 5.9 1.8 2.1 2.4 3.6
Vitis
rotundifolia 3.1 2.8 3.5 2.8 2.3 4.2 3.0
Gaylussacia
frondosa 2.8 1.4 1.5 1.4 4.1 2.2 4.4
Quercus rubra 2.5 1.7 2.4 0.8 2.0 2.7 3.8
Pinus echinata 2.3 0.6 1.4 1.6 1.7 2.9 3.9
Pinus palustris 1.3 0.4 0.3 0 0.3 2.8 2.2
Euonymus
24
TABLE 4: Forest Types and Associated NCVS Plots
Forest Type ID Plots ~Acres #Sps
Entire Tract 56 total 1222 234
Pine Plantations N/A 94 N/A
Bottomland Pine GA-1 102, 103, 106, 024, 029, 038 75.5 171
GA-4 048, 052, 054, 060 (WET)
Bottomland Hardwood
GA-2 109, 113, 117, 122, 034, 157 133 151
GA-3 043, 044 (WET)
Upland Mixed Pine/Hardwood
GB-1 119, 025, 026, 027, 037, 039, 045 273 92
PTLC Variant I GB-2 101, 105, 107, 108, 112, 116, 118, 028, 033
117.5 103
Upland Mixed Hardwood/Pine
GB-3 040, 041, 042, 046, 047 197 80
PTLC Variant II GB-4 104, 110, 111, 115, 121, 030, 035, 155, 158, 059, 114, 120, 023, 031, 032, 036, 156
329 79
PTLC Archetype 107, 108, 110, 111, 112, 114, 115, 120, 035, 155, 156, 059
37
References Cited
Ahse, W.W. and G. Pinchot. 1897. Timber trees and forests of North Carolina. N.C. Geological Survey Bull. 6
Blank, G.B. 1995. Establishing a forest history baseline for ecosystem management and restoration: a project proposed fro NCSU's Harris Research Tract in Cooperation with Carolina Power and Light Company. Proposal funded January 1996-December 1997.
Bode, S.M. 1997. Land use and environmental history of the Shearon Harris Tract. M.S. Thesis. Department of Forestry, North Carolina State University, Raleigh, NC. 121 pp.
Cawthorn, J.W. 1970. Soil Survey of Wake County, North Carolina. USDA Soil Conservation Service, Raleigh, NC.
Frost, Cecil C. 1993. Four centuries of changing landscape patterns in the longleaf pine ecosystem. Proceedings 18th
: Tall Timbers Fire Ecology Conference: The longleaf pine ecosystem: Ecology, Restoration, and Management.
Frost, Cecil C. 1990. Natural Diversity and Status of Longleaf Pine Communities. In Forestry in the 1990s – A changing environment, eds. G. Youngblood and D.L. Fredrick. Bethesda MD: Society of American Foresters.
McCure, B. and M.J. Mefford. 1997. PC-ORD. Multivariate Analysis of Ecological Data, Version 3.0 MJM Software Design, Gleneden Beach, Oregon, USA.
Peet, Robert K., Thomas R. Wentworth and Peter S. White. 1998. A Flexible, Multipurpose Method for Recording Vegetation Composition and Structure. Castanea 63(3): 262-274.
Peet, Robert K. and Dorthy J. Allard. 1993. Longleaf pine vegetation of the southern Atlantic and Eastern Gulf coast regions: A preliminary classification. Proceedings 18th
: Tall Timbers Fire Ecology Conference: The longleaf pine ecosystem: Ecology, Restoration, and Management.
38
The Integration of Historical and Botanical Inventory Data on the
Harris Tract
Introduction
This is the second in a series of three papers dealing with the rare Piedmont Transitional Longleaf Pine Community (PTLC) found on the 496 ha Harris Research Tract (HRT) located in Southern Wake County, North Carolina. The
overall goal of these papers is to aid in the restoration of the PTLC to its historical
prominence and species composition on the HRT. The first paper examined the tract
vegetation to determine which areas contained significant enough concentrations of
longleaf pine to warrant further investigation. This second paper continues the
investigation by examining the area identified in paper one in the context of its
known history.
Frost (1993) sums up the need for historical observation: "the ability to
reconstruct the long-term changes that have occurred in the southern landscape
requires understanding what presettlement vegetation was like; how fire moves over
the land, and the effects of 400 years of intervention." Thus, it is important to
reconcile the present with the past in order to better guide any restoration effort.
This paper will examine how past human impacts have influenced the current HRT
vegetation. This examination will identify the portions of the HRT with highest
39
historical and current vegetation records to provide a species composition goal for
restoration of the PTLC on the HRT.
Methodology
The current vegetation community analysis of the HRT was documented fully
in previous paper (Parker, 1998) and is here summarized. Following the North
Carolina Vegetation Survey protocol:
Vegetation and environmental data were collected during the summer of 1997 from 56 -- 20 X 50 meter plots placed by a stratified random approach. Vegetation measurements of percentage cover (the vertical projection of the shadow of the species above ground portion onto the module) were conducted in each plot. The modified Braun-Blanquet scale cover classes were used and are as follows: trace=1; 0-1%=2; 1-2%=3; 2-5%=4; 5-10%=5; 10-25%=6; 25-50%=7; 50-75%=8; 75-95%=9; 95-100%=10. Cover class midpoint data was used to calculate a mean cover value for each vascular species over the entire 0.1 ha plot. Basal area data was collected.
The data were analyzed using PC-ORD software to conduct cluster analysis, detrended correspondence analysis (DCA), canonical correspondence analysis (CCA) and non metric multidimensional scaling (NMMDS). The DCA differentiated the topographic and species composition of the plots. The CCA emphasized the uniformity of the tracts environmental variables. The NMMDS mimicked the DCA and cluster analysis groupings.
Community classification recognized three major types, each with subtypes. The first was the Hardwood forest with three subtypes (xeric, mesic, and hydric). The second was the Loblolly Pine Forest with two subtypes (xeric and mesic). The third was the validation of the Piedmont Transitional Longleaf Pine Forest with two subtypes (Variant I, Variant II). The distinction of the Piedmont Transitional Longleaf Pine Forest type on the tract was evidenced by the continued clustering of its associated plots through all the data analysis routines.
The pine plantations were excluded from the study because they were planted
40
totally and converted to cropland at varying historic points, these areas could tell us
little about the natural community succession on the HRT. None contain any
structure of the historical PTLC. The HRT forest types, as identified in the previous
paper (Parker, 1998), are grouped as seen in Table 1.
Because the bottomlands do not contain the PTLC, the bottomland
hardwood types were combined and are included only for comparative reasons.
Twelve plots with the highest longleaf pine basal area were chosen from the PTLC
Variants as an archetype PTLC. The PTLC Archetype is an idealized representation
of the species composition which the original HRT PTLC may have contained. A
spreadsheet program was used to consolidate the data and calculate the average
basal area [Table 2] and cover value [Table 3] for each vascular species within the
forest types [Table 1]. Comparisons between forest types of basal area data were
used to highlight differences in canopy dominates, and cover value data were used
to highlight differences in understory dominates.
A secondary survey was conducted on September 29, 1997 along the broad
power line right of way bisecting the tract. A listing was made of as many
herbaceous vascular species as could be identified along a 1/4 mile length. The right
of way was surveyed along its center at approximately 20 meter intervals in
approximately 5 meter radius. In addition, sporadic collections were made
41
separate collections were done because such areas have been shown to contain
remnant species of original forest types.
The Current Status of the PTLC Forest
The PTLC as identified by the ordination techniques [Parker, 1998], runs
along the Northeast - Southwest ridge located on the HRT. In contrast to the highly
disturbed pinewoods and heavily used mixed hardwood forest, the majority of the
remnant PTLC forest type suffered only minor disturbance. There are two identified
variants of the PTLC on the HRT. Variant I is isolated around the margins of
Variant II.
Background
Webster's 1913 unabridged dictionary defines transitional as "denoting the
passage from one state to another." The HRT lies within a transitional zone because
it is located along the natural overlap of habitat ranges for both eastern -- western
and northern -- southern species. In addition, the formal and informal surveys reveal
many species that highlight the tract's transitional nature. For example, the HRT is
positioned on the overlap between the eastern longleaf pine forest and the western
Piedmont oak/hickory hardwood forest. It is on the eastern extreme of shortleaf pine
42
species. Also, the HRT is located on the southeastern edge of the Durham Triassic
Basin. Wahlenberg (1946) noted that “the original (longleaf pine) pine forest
coincided almost exactly with certain geological formations.”
This transitional nature sets the stage for the PTLC to exist, but past human
land use practices have influenced natural forest succession to decrease longleaf
pine's presence. Though spared the extreme agricultural practices that reshaped
much of the Piedmont (Trimble, 1974; Bode, 1997), the land use practices of
harvesting naval stores, woodland hog grazing, and fire suppression have negatively
impacted longleaf pine. Table 4 summarizes the chronology Scott Bode determines
for when these practices occurred. Natural forest succession, following these past
land practices, has today converted the entire HRT into a Piedmont upland mixed
pine/hardwood forest proceeding through secondary succession. This is suggested
in the basal area data for the entire HRT [Table 2]. The canopy dominants for the
entire HRT are Pinus taeda, followed by Quercus falcata and Liquidambar styraciflua. Sweetgum is superseded in the PTLC by Pinus echinata in Variant I and Quercus stellata in Variant II.
This arrangement of species dominance is explained by the species response
to various disturbance events. Studies on old field succession on the North Carolina
Piedmont show the early tree species to be loblolly pine, sweetgum, and shortleaf
43
of the higher light and dryer conditions in old fields (Jones et al, 1994). Loblolly
pine is generally the first tree species in early succession because of its drought
tolerance during seed germination, seed availability, and speed of maturation to seed
bearing age (9 years for loblolly pine vs. 20 years for longleaf pine) (Rankin et al,
1989; Bormannn, 1953). Thus portions of the HRT with high basal areas of these
three species suggest a disturbance history of significant canopy loss. In contrast,
Quercus falcata is considered an artifact species of fire suppression (Frost, 1998). In a frequent fire regime, its population is suppressed. After fire suppression, its
population dramatically increases. Thus portions of the HRT with high basal areas
of Q. falcata suggest a disturbance history of fire suppression as opposed to canopy loss.
Variant I
Canopy loss disturbance is seen in Variant I because a majority of it was
either within or along the boundaries of a cattle pasture seen in the 1938 aerial
photograph. Hence, Variant I has the third highest loblolly pine basal area and the
highest shortleaf pine basal area on the entire HRT [Table 2]. The abundance of
these two species recalls Wahlenberg's (1946) observation that “along the northern
44
restock former longleaf pine sites. Partly cut stands often have an understory of
these two more tolerant species.”
That portions of Variant I were not within the pasture is suggested by red
maple superseding sweetgum's basal area. Acer rubrum has a greater shade tolerance and is a prominent mid succession species -- usually invading 5 to 9 years
after early succession (Rankin et al, 1989; Peroni, 1994). Thus, if Variant I had
been entirely within the pasture then red maple's basal area would not be likely to
supersede early successional sweetgum's basal area.
In addition, Variant I did not appear to suffer the heavy naval stores activities
or the degradation of hog grazing (Bode, 1997) The absence of these activities, in
conjunction with proximity to the viable seed of mature longleaf pine within Variant
II, allowed longleaf pine to exploit the same openings as shortleaf pine and loblolly
pine. This exploitation resulted in Variant I having the highest longleaf pine basal
area on the tract. Openings are vital to longleaf pine regeneration, because longleaf
pine is more intolerant of competition with other trees than intolerant of canopy
shade. Wahlenberg (1946) observes "root competition, rather than shade, accounts
for the absence of seedlings under the open crowns of trees." Such exploitation is
ongoing as exhibited by natural regeneration found within Variant I's plots, gaps
45
Variant I is also where Tephrosia virginiana is making its last stand in the more open areas. Tephrosia virginiana is considered a remnant fire community species, usually the last to hold out after prolonged fire suppression (Frost, 1998).
Tephrosia virginiana occurs in 7 out of the 56 plots with a coverage value of 0.2 for the entire tract and PTLC.
Variant II
In contrast to Variant I, Variant II has nearly half the basal area of loblolly pine and shortleaf pine, a third that of sweetgum, and approximately six times that of southern red oak [Table 2]. This suggest a disturbance history of more fire suppression as opposed to canopy loss. Yet, Variant II has a dual history of usage that is reflected in a clear break along property lines in longleaf pine abundance. Variant II runs along the northeast/southwest ridgetop located on the HRT. The majority of Variant II is on the northeast end of the ridge which was owned by Edwards/Cary Lumber Company. The central zone is nearly completely denuded of longleaf pine and was under the ownership of Holleman. The southwestern tip was in multiple ownership and its history is not fully documented, but it has a lesser longleaf pine component and is of smaller size than the northeastern end of the ridge.
Northeast
The 1938 aerial photo shows the northeastern portion of the ridge to still be
46
age cores of longleaf pine in this area show mixed ages of up to 90+ years old.
Additionally, the HRT retains the tree distribution pattern associated with PTLC
where longleaf pine clusters on the ridgetops and shortleaf pine bands along the
mid-slope/bottomland margin (Frost and Shafale, 1998). This age span and tree
distribution supports the idea that this portion of the tract has never been completely
cut over or converted to open field. Therefore, the northeastern portion of Variant
II also shows some of the lowest levels of early successional tree species on the tract
(i.e., loblolly pine and sweetgum) [Table 2]. In addition, it has a low basal area of
red maple, a first mid successional species. In contrast with the rest of the tract, the
northeastern portion of the ridge did not suffer hog grazing. It did experience
woodland cattle grazing, some selective high-grading cutting, and fire suppression.
Cattle grazing has been shown to have no adverse effect on longleaf pine
(McKee et al, 1983). Cattle have been shown to prefer hardwood species (Grelen,
1978), so cattle grazing on this area on the tract may have benefitted longleaf pine
to some extent by reducing competition. In addition, it was a common practice in
the 1800's for the woodlands to be burned to green them up for grazing. The
burning practice may have also helped perpetuate longleaf pine (Frost, 1993; Grelen,
1978).
Variant II's northeastern portion also belonged to Edwards/Cary Lumber
47
would have been small, after the more valuable timber, and not totally denuding the
land because of the small operating capacity of his portable sawmill and his use of
mules to skid the logs (Bode, 1997). The natural longleaf pine forest, as it aged,
would have gradually thinned out from natural mortality, resulting in patchy stands
suitable for longleaf pine regeneration. Boyer (1979) states "Early logging
sometimes simulated this process when stands were high-graded one or more times."
Such released spaces would have given loblolly pine a greater foothold but also given
longleaf pine seedlings an opportunity to fill the gaps. And though the logging
operation would be removing mature seed trees, there were no hungry hogs
consuming the seedlings that did spring up in the resulting gaps. The increased shade
from the hardwoods would have decreased survival of both loblolly pine and longleaf
pine seedlings. Thus, this portion of the tract has some of the lowest loblolly pine
abundance on the tract and the lower longleaf pine basal area of the two variants.
In addition, fire suppression after the turn of the century allowed forest
succession to continue past the longleaf pine fire subclimax. Recent age cores show
this area of the tract to have a mixed longleaf pine age 90+ years ago. The age range
would suggest that some of the standing forest originated before fire suppression.
48
of fire. Their abbundance suggests that succession continued without any other
major human disturbance event except fire suppression. Longleaf pine has slowly
lost ground in the absence of fire, having the second highest basal area on the tract
but well below Variant I’s levels.
Central Ridge
The central ridge zone of Variant II is demarcated by three plots (30, 31, &
121) that do not contain longleaf pine and were in exclusive ownership by Holleman
during the 1800's. The high open ridgetop, well suited to longleaf pine natural
regeneration, would have been expected to maintain some longleaf pine, similar to
the Northeast, even in the absence of fire. We suspect the zone probably lacked
mature longleaf pine trees from which to regenerate because of a combination of
longleaf pine's natural dispersal range and Holleman's activities of naval stores
production and hog grazing. "The principal impact of civilization on longleaf pine
has come through destruction of the forest by men and range hogs" (Wahlenberg,
1946).
Unlike wind dispersed loblolly pine seeds, longleaf pine’s heavier seeds are
dispersed only as far as the height of its canopy (Boreman, 1953). This essentially
means that a viable seed source needs to be very near for natural regeneration to
49
owing presumably to insufficient seed trees" (Wahlenberg, 1946). Scott Bode
showed in the historical record [Table 4] how from 1825-1880 Holleman harvested
naval stores (tar, turpentine, and pitch) and grazed hogs between 1850 and 1880
(Bode, 1997).
The collection of naval stores does not directly destroy longleaf pine. But the
average longleaf pine would only produce such naval stores for 10-15 years. At the
end of its production, the tree was often cut down for timber purposes or for
destructive distillation (Bode, 1997). This cutting resulted in the removal of large
numbers of mature trees, thus removing seed sources. Another common naval store
practice to protect the open box-faces from fire was to maintain a vegetation free
zone around the longleaf pine (Crocker, 1979). This practice would have reduced
the numbers of naturally regenerating longleaf pine seedlings. Box-faced longleaf
pine were also more vulnerable to disease and blow downs from storm events (Bode,
1998). Naval store activities were damaging to mature longleaf pine and affected
regeneration by removing sources of viable seed.
Though naval stores production damaged the longleaf pine forest by
removing seed source, one would still expect that replacement seedlings would be
common. This next generation probably did not arise because Holleman woodland
grazed hogs which may well have consumed any seedlings that had survived. Hogs'
50
As a long-lived species, longleaf pine places a lot of early growth into developing its
root system as opposed to shorter-lived species (e.g. loblolly pine) that put initial
growth into vegetation. Hogs, as rooters, graze out the succulent tender, nutrient
root systems of grass stage longleaf pine. They do this with such efficiency and
preference that they effectively destroy natural regeneration of longleaf pine in the
area they inhabit.
Effectively, the mature longleaf pine was being removed through naval stores
production as the next generation was destroyed by hog grazing. On the central
ridge zone where longleaf pine should have maintained its prominence, human
activities removed the seed needed to regenerate the longleaf pine naturally in the
area. The hog grazing and naval stores activities on the Holleman land divided the
large longleaf pine population concentration on the north portion of the ridge from
the smaller population concentration on the southern portion of the ridge.
Restoration
Having examined the PTLC current species composition in light of the tract's
documented disturbance history, we can focus on where to concentrate longleaf pine
restoration. Both variants of the PTLC are better candidates because of their close
51
disturbance history, especially the northeast of Variant II. But within Variant II,
the southwestern tip is small and isolated from the main body of longleaf pine and
thus does not warrant an immediate expenditure of limited resources for restoration.
Furthermore, the central ridge zone, though within the PTLC, has lost its natural
longleaf pine component due to past abuses and would require extensive replanting.
Thus, the initial restoration effort should be concentrated in the northeast quadrant
of the HRT which includes portions of Variant I and the northeastern portion of
Variant II.
The moderate level of disturbance in the northeastern portion of Variant II
is important because of remnant individuals or, in other words, a viable genetic
resource. As Oosting (1940) says, "it is plausible that some seeds produced in the
original longleaf pine forest would be present in the soil when subsequent
communities occupied the site and would germinate in response to renewed
conditions (i.e. fire) of the original community type." The lack of a complete
leveling of trees experienced by many longleaf pine forests in the southeast and the
relatively low usage for naval stores and absences of hog grazing has allowed the
PTLC to maintain a hold in the northeast quadrant of the tract.
Thus, the plants in this area (especially the longleaf pine) have a genetic
history with the site that extends before colonial days. The dual nature (clearing and
52
species of the original community being still present -- allowing the potential
restored community to reflect more closely the original species composition of the
PTLC. The presence of Tephrosia virginiana is an example of this resilience. Furthermore, it is known that seeds naturally buried for a prolonged time may still
germinate and that forest seeds require forest conditions to maintain their viability
(Oosting, 1940). So, any suggestion of minimum disturbance increases the likelihood
of a rich seed bank of original forest species.
The northeast quadrant of the HRT has the best odds for successful restoration of the community type with modest management practices (i.e. re-introduction of fire and selective removal of loblolly pine) rather then extensive plant re-introduction that would be required elsewhere. Further reasons for suggesting this area are as follows:
1. located on uplands where longleaf pine naturally occur 2. underlying soil type is Mayodan, a known longleaf pine soil 3. strong population base of longleaf pine (i.e. viable seed) 4. location of greatest amount of extant natural regeneration
The regeneration potential on the Harris Tract is seen in two ways. The first
is the natural regeneration occurring in scattered canopy openings, road edges, and
old fire lines within the PTLC Variant I area. This shows that the trees on the tract
are mature and have viable seed. The second is seen in a small area just off the
northeast corner of the tract. Here, an area of approximately 1/4 of an acre was
cleared by the property owners (not us) with the exception of 4 mature longleaf