University of Windsor University of Windsor
Scholarship at UWindsor
Scholarship at UWindsor
Electronic Theses and Dissertations Theses, Dissertations, and Major Papers
9-3-2019
An Approach Of Automatic Reconstruction Of Building Models For
An Approach Of Automatic Reconstruction Of Building Models For
Virtual Cities From Open Resources
Virtual Cities From Open Resources
Sumit Khairnar University of Windsor
Follow this and additional works at: https://scholar.uwindsor.ca/etd
Recommended Citation Recommended Citation
Khairnar, Sumit, "An Approach Of Automatic Reconstruction Of Building Models For Virtual Cities From Open Resources" (2019). Electronic Theses and Dissertations. 7815.
https://scholar.uwindsor.ca/etd/7815
This online database contains the full-text of PhD dissertations and Masters’ theses of University of Windsor students from 1954 forward. These documents are made available for personal study and research purposes only, in accordance with the Canadian Copyright Act and the Creative Commons license—CC BY-NC-ND (Attribution, Non-Commercial, No Derivative Works). Under this license, works must always be attributed to the copyright holder (original author), cannot be used for any commercial purposes, and may not be altered. Any other use would require the permission of the copyright holder. Students may inquire about withdrawing their dissertation and/or thesis from this database. For additional inquiries, please contact the repository administrator via email
AN APPROACH OF AUTOMATIC RECONSTRUCTION OF BUILDING
MODELS FOR VIRTUAL CITIES FROM OPEN RESOURCES
By
Sumit Khairnar
A Thesis
Submitted to the Faculty of Graduate Studies through the School of Computer Science in Partial Fulfillment of the Requirements for
the Degree of Master of Science at the University of Windsor
Windsor, Ontario, Canada
2019
AN APPROACH OF AUTOMATIC RECONSTRUCTION OF BUILDING
MODELS FOR VIRTUAL CITIES FROM OPEN RESOURCES
by
Sumit Khairnar
APPROVED BY:
______________________________________________ M. Hlynka
Department of Mathematics and Statistics
______________________________________________ I. Ahmad
School of Computer Science
______________________________________________ X. Yuan, Advisor
School of Computer Science
iii
DECLARATION OF ORIGINALITY
I hereby certify that I am the sole author of this thesis and that no part of this thesis has been published or submitted for publication.
I certify that, to the best of my knowledge, my thesis does not infringe upon anyone’s copyright nor violate any proprietary rights. Any ideas, techniques, quotations, or any other material from the work of other people included in my thesis, published or otherwise, are fully acknowledged in accordance with the standard referencing practices. Furthermore, to the extent that I have included copyrighted material that surpasses the bounds of fair dealing within the meaning of the Canada Copyright Act, I certify that I have obtained a written permission from the copyright owner(s) to include such material(s) in my thesis and have included copies of such copyright clearances to my appendix.
iv
ABSTRACT
v
DEDICATION
vi
ACKNOWLEDGMENTS
I owe a debt of gratitude to Dr. Yuan, for the vision and foresight, which inspired me to conceive this thesis work. As my teacher and mentor, he has taught me more than I could ever give him credit for. I am also thankful to my thesis committee members, Dr. Ahmad, and Dr. Hlynka, for providing me extensive professional and personal guidance, which helped me learn a great deal about both scientific research and life in general.
vii
TABLE OF CONTENTS.
DECLARATION OF ORIGINALITY ... iii
ABSTRACT ... iv
DEDICATION ... v
ACKNOWLEDGMENTS ... vi
LIST OF TABLES ... x
LIST OF ABBREVIATIONS/SYMBOLS ... xi
LIST OF FIGURES ... xii
CHAPTER 1 INTRODUCTION ... 1
1.1 Overview ... 1
1.2 Working of a self-driving car ... 2
1.3 Virtual 3D city model ... 6
1.4 Texture mapping 3D city model ... 7
1.5 OpenStreetMap – VGI data ... 9
1.6 Thesis Contribution ... 10
1.7 Structure of the thesis ... 10
CHAPTER 2 LITERATURE REVIEW ... 11
2.1 Construction of 3D city model ... 11
2.1.1 Methods for 3D city modelling ... 11
2.1.2 Photogrammetry based 3D city models ... 12
2.1.2.1 Aerial photogrammetry based model ... 12
2.1.2.2 3D city model with aerial images and cadastral map ... 14
2.1.2.3 3D city model with computer vision techniques ... 15
2.1.2.4 3D city models with GIS ... 16
2.1.2.5 3D city modelling from satellite photogrammetry ... 18
2.1.2.6 3D city modelling from single satellite image ... 18
viii
2.1.2.8 3D city model from video ... 19
2.1.2.9 3D city model from TLS data ... 20
2.1.3 Laser scanning based 3D models ... 21
2.1.3.1 Terrestrial laser-based approach ... 21
2.1.3.2 Aerial laser-based approach ... 22
2.1.3.3 3D city model with mobile mapping system ... 23
2.1.4 VGI data based 3D city models ... 24
2.1.5 Hybrid data-based 3D modeling ... 26
2.1.5.1 3D modelling with aerial laser and terrestrial laser ... 26
2.1.5.2 3D modelling with laser and photogrammetry ... 26
2.1.5.3 3D modelling with laser and videogrammetry ... 28
2.2 Texture mapping 3D city model ... 28
2.2.1 Photorealistic method ... 29
2.2.2 Pictometry based approach ... 30
2.2.3 Laser scanning based approach ... 31
2.2.4 Dynamic pulse function based method ... 32
2.3 Related works... 36
2.4 Thesis statement ... 38
2.4.1 Problem statement ... 38
CHAPTER 3 PROPOSED METHODOLOGY ……….39
3.1 Motivation ... 39
3.2 Working of the overall system ... 39
3.2.1 Working of individual modules ... 41
3.3 Proposed methodology for construction of virtual environment ... 43
3.3.1 Construction of 3D building models ... 45
3.3.2 Geo-locating 3D environment... 47
3.3.3 Texture image construction ... 48
3.3.4 Texture image mapping ... 53
CHAPTER 4 IMPLEMENTATION AND EXPERIMENTS ... 55
4.1 Software information ... 55
ix
4.3 Visualizing data in vector format ... 56
4.4 Extruding footprints to 3D models... 58
4.5 Texture image extraction ... 59
4.6 Reconstruction of texture image ... 60
4.6.1 Perspective transform image ... 60
4.6.2 Model-to-image comparison ... 61
4.6.3 Occlusion removal ... 62
4.7 Image stitching ... 63
4.8 Texture mapping on the 3D model ... 64
4.9 Size of the constructed model ... 66
4.10 Use of 3D model in the overall system ... 67
4.11 Result comparisons and discussions ... 69
4.12 Drawbacks and limitations………..71
CHAPTER 5CONCLUSION AND FUTURE WORK ... 72
5.1 Conclusion ... 72
5.2 Future work ... 73
REFERENCES/BIBLIOGRAPHY... 74
x
LIST OF TABLES
xi
LIST OF ABBREVIATIONS/SYMBOLS
LiDAR Light Detection and Ranging RADAR Radio Detection and Ranging IMU Inertial Measurement Unit GPS Global Positioning System UAV Uncrewed Aerial Vehicle 3D 3-dimensional
2D 2-dimensional OSM OpenStreetMap
VGI Volunteered Geographic Information HD High Definition
XML Extensible Markup Language GIS Geographic Information System VNG Virtual Newcastle Gateshead CC Cyber City
TLS Three-Line-Scanner MMS Mobile Mapping System SOA Service Oriented Architecture CNN Convolutional Neural Network FCN Fully Convolutional Network DAE Digital Asset Exchange KML Keyhole Markup Language PID Proportional Integral Derivative MPC Model Predictive Control
xii
LIST OF FIGURES
Figure 1.1 Working of a self-driving car ……….……….2
Figure 1.2 Computer vision through camera sensor ……….3
Figure 1.3 Sensor fusion ………...3
Figure 1.4 Path planning ……….……….4
Figure 1.5 Control in a self-driving car ………5
Figure 1.6 Texture mapping importance ……….…….8
Figure 1.7 A UAV for texture extraction …………..………...8
Figure 1.8 Node, way, relation ……….9
Figure 1.9 Representation of OSM data ………...…9
Figure 2.1 3D objects and buildings ………...13
Figure 2.2 3D model with aerial images and cadastral map ………...14
Figure 2.3 3D model with stereo camera ………....15
Figure 2.4 3D model with GIS data ………...17
Figure 2.5 VNG model in Autodesk LandXplorer ……….…17
Figure 2.6 3D model from car images sequences ………...19
Figure 2.7 3D environment from video with depth map ………20
Figure 2.8 Data captured with TLS sensor ……….21
Figure 2.9 3D city model with TLS data and CC Modeler ………21
Figure 2.10 3D model based on laser scanning ………..22
Figure 2.11 3D model with LiDAR and image ………..22
Figure 2.12 3D model with point cloud and 3D city model with textures ……….23
Figure 2.13 Setup for MMS and simulation of captured data ………....23
Figure 2.14 Level of detail ……….24
Figure 2.15 OSM tags ………25
Figure 2.16 Extruded buildings from OSM ………25
xiii
Figure 2.18 3D environment with laser and aerial images ……….27
Figure 2.19 3D model of Berkley university ……….….27
Figure 2.20 Laser data and videogrammetry ………..28
Figure 2.21 Rectified image ………...30
Figure 2.22 Real-life object removal ………..30
Figure 2.23 Flight path for pictometry ………...30
Figure 2.24 Hidden angles in Pictomerty ………...31
Figure 2.25 Lase scanned data; texture image ………32
Figure 2.26 Dynamic pulse function ………...…...32
Figure 2.27 Final model of Karabuk university ……….…33
Figure 3.1 Overall system ………..40
Figure 3.2 Flowchart for proposed methodology ………...44
Figure 3.3 Region to extract ………...45
Figure 3.4 Flowchart for 3D building models ………46
Figure 3.5 Pseudocode for building extrusion ………47
Figure 3.6 Georeferencing virtual 3D model ……….48
Figure 3.7 Process of image extraction and reconstruction ………50
Figure 3.8 Texture mapping process ………..53
Figure 4.1 Bounding box query ………..56
Figure 4.2 Vector format of XML data ………..57
Figure 4.3 Footprints of OSM data ………57
Figure 4.4 Extruded building models ……….58
Figure 4.5 KML file for geo-locations ………...58
Figure 4.6 Façade texture image ………59
Figure 4.7 Perspective transform ………60
Figure 4.8 Rendered image of 3D model ………...61
Figure 4.9 Model-to-image comparison ……….61
Figure 4.10 Background subtracted image ……….62
xiv
Figure 4.12 Occlusion removed façade texture ………..………63
Figure 4.13 Three façade images to stitch ….………..………...63
Figure 4.14 Stitched image ……….64
Figure 4.15 Textured 3D model (view 1) …………...………65
Figure 4.16 Textured 3D model (view 2) ………...65
Figure 4.17 Textured 3D model (view 3) ………...66
Figure 4.18 3D model geometry comparison ……….66
Figure 4.19 Building detection ………...67
Figure 4.20 3D features of building ………...………68
Figure 4.21 3D features of building……….………...68
Figure 4.22 3D features of building ………...………68
Figure 4.23 Real-time image of 3D objects ………70
Figure 4.24 Virtual image of 3D objects ………...70
1
CHAPTER 1
INTRODUCTION
1.1Overview
We have come to an era where self-driving cars are practically feasible. In recent years self-driving cars have gone from “maybe possible” to “definitely possible” to “inevitable” to “how did anyone ever think this wasn’t inevitable?” to “now commercially available” [53]. Besides Google, Uber, and Tesla, there are many other companies who have invested large sums of money into the research of this system. With such a huge amount of investment and interest in the development of self-driving systems, we can understand that self-driving automobiles are an inevitable future. But at their current stage, they are far from being viable [51]. With the levels of sophistication involved, a high cadre of expertise is required to ensure the smooth functioning of the conventional self-driving car.
Awareness of the nearby environment is necessary to ensure the perfect functioning of a self-driving car. To help the car familiarize itself with its surroundings, a virtual environment can be constructed. It would comprise of static objects that the car may interact with while driving. Several companies are working towards the construction of a 3D or HD map for self-driving cars. The sole purpose of these maps is to familiarize the car with ever-existing objects on the road, which are classified as static objects. Darms et al. [49] and Hu et al. [50] have defined static objects as those that do not move when the car is on the road. These include buildings and roadside amenities such as benches, poles, etc. We shall use the same definition for the extent of this thesis.
2 1.2Working of a self-driving car
A self-driving car is a vehicle which can sense the surroundings and can navigate without human input [53]. Self-driving cars can detect the environment with the help of a variety of sensors, such as LiDAR, RADAR, Camera, GPS, and IMU.
1) Camera: It functions as the eyes of a self-driving car. It helps detect objects found on the road.
2) RADAR: RAdio Detection And Ranging uses radio waves to find the range, angle, and velocity of objects.
3) LiDAR: Light Detection And Ranging measures the distance to the target by penetrating a laser beam towards the object. LiDAR is used to generate a 3D map of the surroundings.
4) IMU-enabled GPS: IMU stands for Inertial Measurement Unit, which provides the angular rate and orientation of a body. IMU-enabled GPS is used when GPS is unavailable.
5) Others: Other sensors used are infrared cameras, 360-degree cameras
Figure 1.1. Working of self-driving car [53]
3 Computer Vision
Computer vision relates to how cameras are used to see the road and detect objects on the road. With the help of camera images, object identification is performed, and the pose of the detected object is estimated. Once identified, the objects are classified and tracked for better understating of the surroundings.
Figure 1.2. Computer vision through camera sensor
Sensor Fusion
Sensor fusion is the process of integrating the data received from different sensors to build a detailed understanding of the car’s nearby environment [55].
4
Sensor fusion is required because data received from a single sensor is of little use when compared to the combined data [53]. Data received from cameras are better for object detection, but to measure the distance between the objects and the car, radar sensor gives better results than a camera. Radar provides better results due to the waves penetrating through the Radar sensor. This function helps it outperform the camera even in bad weather conditions.
All data received from different sensors is fused. It is then used to help the car understand better. As seen in Figure 1.3, the sensors mentioned in the line of sight module consist of LiDAR, RADAR, camera, and ultrasonic sensors, which are all fused together in the sensor fusion module.
Localization
Localization is to know the position of the car in the real world. This information can be obtained once the environment is known. GPS sensor is used to acquire the real-world location of the car; also, mathematical algorithms such as Kalman Filter, Extended Kalman Filter, and Unscented Kalman Filter are used to make the GPS information more accurate.
Path Planning
Path planning enables a self-driving car to find the fastest, the safest, and the most convenient route from the start point to the endpoint [54]. The car needs to detect all the static and dynamic objects (maneuverable) to bypass them. This makes path finding complicated.
5
Major approaches for path planning are predictive control model, behavior-based model, and feasible model. Before crafting the trajectory plan, the path of the car, the path planning, the car maneuver, and the maneuver planning of the car is considered. Any dynamic object is referred to as a maneuver.
Control
Control is the final step in the working system of the self-driving car. Once the trajectory for the start point to the end point is defined, vehicle control such as turning the steering wheel, hitting the throttle or brakes, is controlled.
Figure 1.5. Control in self-driving car [56]
There are different types of controllers which are used in the system; some of them are, Proportional Integral Derivative (PID), Model Predictive Control (MPC), kinematic model, and dynamic model [56]. All these controllers take angle (yaw) and speed (v) into account while defining the trajectory.
6
This research mainly concentrates on the construction of a virtual 3D environment which can serve as prior information to the car, particularly, to use the VGI (Volunteered geographic information) data, which is open source. The construction and use of the 3D environment also reduce the overall cost of the self-driving car as it eliminates the use of the LiDAR sensor, which makes up half the cost of all the sensors combined.
1.3Virtual 3D city model
Virtual 3D city models are used in an increasing number of applications, including landscape planning, disaster management, location-based services, tourism industry, and urban planning. Virtual 3D city models are an important visualization of urban geospatial and georeferenced information. The 3D model enables the visual representation of past and existing cities. It also provides a decision on whether a redevelopment of existing cities is required. Virtual 3D city models are not only restricted with visualization purposes but also provide data basis for spatial querying of thematic data, for computational models in urban security, and for noise propagation models [60].
In general, the term virtual 3D city models refers to a digital representation of different entities of the city and their geometric and topologic structures. A virtual 3D city model comprises of:
• Buildings,
• Vegetation objects such as trees and hedges,
• City furniture such as benches, night lamps,
• Water bodies such as rivers or lakes,
• Terrain surface
The usage of the information provided by the 3D model depends on the application domain.
‘Every second producer has requests to provide other objects or information than he is presently producing, and three out of four users would like to have other city data than already available.’ [59]
7
or a restaurant. Hence, the question regarding the detailing of a 3D model remains not fully answered.
In general, a 3D city model is called ‘virtual environment’, ‘virtual 3D model’, ‘virtual 3D environment’, ‘3D model’, and ‘virtual city.’ All these names have been used in this thesis to refer to the 3D city model.
The construction of the 3D city model is carried out with the use of different types of data including sensory information, GIS data, CAD data, Building Information Model data, and VGI data. Sensors used in the construction of the 3D model are primarily LiDAR and cameras. LiDAR captures the 3D geometric information. Cameras capture the façade textures. The data captured with LiDAR sensor is visualized as 3D point cloud. Then, pre-processed to find the planar facades in point cloud. GIS data is a type of thematic data. It contains all the information in textual format. Building Information Model are pre-constructed models of existing buildings from the city. They are accurate with the complex construction. VGI data is crowdsourced data which is mapped by public. VGI data is mainly available in thematic format or visual format.
When integrated, there are two ways in which 3D models supports different applications. For some scenarios, 3D model provides the context for spatial information. For others, it works as a base model or prior information on which different applications perform.
1.4Texture mapping 3D city model
8
Figure 1.6. Texture mapping importance [58]
Mapping the texture is essential in the construction of the 3D city model that can be seen in Figure 1.6. The image on the left side contains actual textures, whereas the image on the right does not have any textures mapped.
Textures are constructed by either capturing from real sources or by digitally creating them. Textures captured from the real location are known as photorealistic textures. Photorealistic textures are captured with Airborne cameras and Airborne LiDAR sensors. Also, GPS sensor is combined with the whole setup, which helps geo-reference the captured images.
Figure 1.7: A UAV for texture extraction
9 1.5OpenStreetMap – VGI data
OpenStreetMap is a crowdsourced mapping technology started in 2004 as a university project. The structure of OSM data is XML based, also, it uses tag information for mapping real-world locations. The structure of XML data is based on three primitives [61].
1. Node: a point in real-world with latitude and longitude
2. Way: an ordered list of nodes, such as a line; it represents linear features such as a stream or a railway
3. Relations: refers to an ordered sequence of way or nodes
In Figure 1.8, nodes, ways, and relations are shown, from left to right respectively.
Figure 1.8. Node, Way, Relation (left to right order) [61]
Figure 1.9: Representation of OSM data [61]
In Figure 1.9, in the left-side is the visual representation of OSM data on openstreetmap.org, and the right-side image is an actual mapping of the data [61].
Some of the important tags in OSM structure
height Describes the Height of a feature
length Describes the Length of a feature
width Width of a feature, not used in ways
material Material of which the feature is made of
surface Surface material of the feature
building To mark the feature as a building; the value is set to yes or some specific type of building as hut or a garage
10
height To mention the height of the feature
building:levels To mention the number of floors in the building Table 1.1: Tags used in OSM data structure
In Table 1.1, tags used to map an entity are shown. Similarly, elevation, building:material, building:entrance, building:amenities, and sidewalk are also used in some specific cases.
1.6Thesis Contribution
Major contributions of this research work can be summarized as follows:
• 3D city model constructed with the proposed system helps reduce computation time of object detection by eliminating static objects (objects that do not move while the car is on the road)
• Self-driving car can be geo-localized in real environment by comparing real-time
images with rendered images of the virtual world
• Proposed research work does not include the use of any sensors (mentioned in Section 1.2) to extract 3D structural information or to construct the environment.
• Once detected, all the dynamic objects can be updated into the virtual environment
and can be used for better navigation of the self-driving car.
1.7 Structure of the thesis
The remainder of the thesis is structured as follows.
Chapter 2 provides technical details of construction of the 3D city model, texture extraction for the façade of the 3D model, and reconstruction of the texture image.
Chapter 3 discusses the proposed system for the construction of the 3D model, and texture extraction with mapping, details of the overall system and connection of this thesis work with the overall system.
Chapter 4 gives a detailed description of the implementation setup, experiments conducted, and the usage of the 3D model in the overall system.
11
CHAPTER 2
LITERATURE REVIEW
This chapter discusses the relevant background of recent works in the construction of the 3D city model and texture mapping. This section also covers the technical background of 3D city models and texture extraction and mapping using different data sources.
2.1Construction of 3D city model
Nowadays, 3D city modeling has become an important issue for researchers in the area of geomatics. Geomatical techniques play a key role in the construction of a 3D city model. For mapping technologies geomatics is an umbrella which consists of technologies like Photogrammetry, Geographical Information System, Remote sensing, Lasergrammetry, Global Positioning System, and Radargrammetry. Mainly in the construction of 3D environment, laser techniques and Photogrammetry are used. Singh S.P. et al. [1] conducted a review related to the usage of 3D city models in various applications. They presented the most representative geomatical technique for 3D city modeling and other related works of researchers.
2.1.1 Methods for 3D city modelling
Current methods are mainly categorized in the following approaches.
• Based on Automation
1. Automatic 2. Semi-automatic 3. Manual
• Based on Data Input
1. Photogrammetry based technique 2. Laser scanning based technique
12
A further categorization of the methods based on data input is as follows.
• Photogrammetry based technique
1. Aerial Photogrammetry based technique
2. Aerial image and cadastral map based technique 3. Computer vision based techniques
4. GIS data based techniques
5. Satellite Photogrammetry based technique 6. Single satellite images based technique 7. Panorama image based technique 8. Video based technique
9. TLS data based technique
• Laser scanning based technique
1. Terrestrial Laser-based technique 2. Aerial Laser-based technique
3. Mobile mapping system based technique
• VGI data-based technique
1. With the use of Government open data 2. With the use of OpenStreetMap data
• Hybrid data input-based method
1. Aerial Laser and Terrestrial Laser 2. Laser and Photogrammetry 3. Laser and Videogrammetry
2.1.2 Photogrammetry based 3D city models
2.1.2.1 Aerial photogrammetry-based model
(in-13
house developed software); researchers used digital aerial images of Netherlands in the scale of 1:2200.
Data acquisition, superimposition, processing, updating, and visualization are the main processes in this work. Figure 2.1 demonstrates the reconstructed 3D objects and buildings developed with the approach in [2].
The relation between Photogrammetry and 3D city modeling was provided by Kobayashi [3].
Figure 2.1. 3D objects and buildings [2]
The author also recommended a method to construct a 3D city model with the use of Photogrammetric processing. Along with Photogrammetry techniques, the author used aerial images for the construction of 3D city model and discussed the effectiveness and efficiency of the 3D model in terms of labor and reusability. The 3D construction model was based at Phoenix, USA.
14
Leberl et al. [5] compared the point cloud generated from an image and point cloud generated with a laser system. They discuss the advantages and disadvantages of both the methods and conclude that the accuracy of the 3D point cloud is better when generated with photogrammetric methods.
Amat et al. [6] discussed a methodology to construct a 3D city model with the help of aerial images and close-range photography. In this method, the authors suggest that small 3D buildings, doors, windows are not visible from aerial photography, so close-range images are used to extract façade of the buildings. Certainly, with the combination of close-range photography and aerial photogrammetric techniques, 3D city model can be constructed.
Hammoudi and Dornaika [7] also provided a method for the construction of a 3D city model with aerial images. For this approach, geometric and photometric properties are used in perspective projection. The main advantage of the method is its use of direct raw images (without any pre-processing) and featurelessness. As a part of pre-processing, feature extraction and feature matching are avoided. An objective function is used to combine the dissimilarity between the captured images.
2.1.2.2 3D city model with aerial images and cadastral map
Flamanc et al. [8] constructed a 3D city model by using the aerial images and cadastral maps. They also tested the approach with model-driven and test-driven systems. They used the cadastral map to extract information such as positions of existing structures of buildings, adjoining or adjacent streets, and dimensions.
15
Figure 2.2 presents the 3D model constructed with the help of aerial images and a cadastral map.
2.1.2.3 3D city model with computer vision techniques
Lang and Forstner [9] suggested a semi-automatic technique for the acquisition of the 3D shape of buildings. Stereo cameras are used for extraction. The acquired information of 3D shapes is topographical. Figure 2.3 describes a 3D model constructed with a stereo camera.
Figure 2.3. 3D model with a stereo camera [9]
Pollefeys et al. [10] provided an automated method to construct a textured 3D model from a sequence of images. Computer vision algorithms are used to construct the 3D city model. The accuracy of the model is not the best due to the use of computer vision algorithms. Hence, this approach is mainly used in archaeology and not in metrology. Authors tested this approach on the Roman site, Sagalassos, Turkey.
Jang and Jung [11] used ground images to construct a 3D city model. To capture ground images, they used a digital camera mounted with a compass and GPS sensor. All the captured images are referenced to the real-world coordinates with the help of Global Positioning System. To correct the pose of the images, they use Structure from Motion-based algorithm; they also register the 3D model with real coordinates with GPS.
16
Digital Terrain Model, and 3D Geodata is passed. At the end of the process, the virtual 3D city model is constructed.
Cornelis et al. [13] discussed a method for constructing a 3D city model in real-time. Two cameras are used to record the calibrated videos, which work as an input to the system. They used Structure from Motion algorithm concept. They also use object detection algorithms for video recordings. The main feature of this method is that it constructs a virtual 3D city model in real-time.
Snavely Noah et al. [14] created a new method for the construction of a 3D city model by using the images available on the internet and introduced a new concept of photo-tourism. Authors use unordered images of the real-world site and construct the 3D model from the downloaded images. This method also uses Structure from Motion algorithms along with image-based rendering. This approach was tested on Google images of Notre Dame, Mount Rushmore, South Dakota, Sphinx (Giza), Colosseum located in Rome, and Great Wall of China.
Jianxiong Xiao et al. [15] provided an approach for automatic reconstruction of 3D models from street-side photos. Street-side photos are captured with a ground-level digital camera. To regularize the noisy and missing data, inverse-patch based composition method is used. Due to ground-level image capturing, skyscraper buildings are not modeled in this approach.
2.1.2.4 3D city models with GIS
Gruen A. and Xinhua W. [16] developed a software named CyberCity Modeler, for automatic generation of a 3D point cloud. It has been developed in such a way that it generates structured data for city modeling from photogrammetrically measured points. This has been mainly designed to handle GIS data and to integrate raster images and vector data as hybrid GIS.
17
Nedal Al-Hanbali et al. [18] created a 3D model for Yarmouk University with the help of GIS Data and Photogrammetric techniques.
Figure 2.4. 3D model with GIS data [18]
Malumpong C. and Chen X. [19] used interoperable 3D GIS data with a 3D modeling software named Google Sketchup. The aim of the work was to integrate 3D GIS information with 3D modeling software to construct the virtual 3D city model and other objects of the city.
Razzak A. et al. [20] also proposed a technique for the construction of a 3D city model from 3D GIS data. Authors followed the GIS techniques for the virtual environment, and the final result contained all the objects visualized for users.
Thompson and Horne [21] worked on a VNG project, which focused on data exchange, CityGML, interoperability, and data accessibility issues in Autodesk LandXplorer software.
18
2.1.2.5 3D City modelling from satellite photogrammetry
Tao and Young Hu [22] evaluated the concept of RFM in 3D reconstruction, due to which the generation of Digital Elevation Model is possible without physical sensor model. In the evaluation, authors studied two methods: forward RFM, and inverse RFM. They concluded that reconstruction accuracy is better with forward RFM. The approach was tested with real IKONOS stereo pairs to construct the 3D model.
Fraser et al. [23] discussed the use of IKONOS imagery for the extraction of buildings and positioning. They assessed the model with qualitative and quantitative approaches to construct the 3D model of the campus of the University of Melbourne.
Kocaman et al. [24] tested an approach for 3D city modeling with the use of high-resolution satellite images in SAT-PP software and CyberCity Modeler [16]. They extracted buildings and DSMs to construct 3D city model with IKONOS and stereo images.
Tack et al. [25] introduced and tested an approach for semi-automatic construction of 3D city model with tri-stereoscopic high-resolution satellite images. They also studied IKONOS triplet data with photogrammetry software named SAT-PP for Istanbul.
2.1.2.6 3D city modelling from single satellite image
Huang et al. [26] developed a method for reconstruction of 3D objects from a single high-resolution satellite image. The geometry was constructed with the help of Rational Polynomial Coefficient method by using one high-resolution satellite image and Digital Elevation Model. The satellite ray determines the polynomials and shadows on the ground determines the azimuth of the object. Height of the objects is determined from the shadow size and its angle with the Sun. Authors tested the method on IKONOS image data and designed software for real-time reconstruction, extraction, and visualization.
19 2.1.2.7 3D city model from panorama images
Luhmann and Tecklenburg [28] suggested a method for 3D objects reconstruction by using multiple panorama images. In this work, they also discussed frame by frame panorama generation, image acquisition, calibration, and control point measurement. Each of the panorama images is oriented with the global coordinate system. By following an object reconstruction method such as space intersection and moving floating mark, the 3D model is constructed. Authors tested the approach by constructing the entrance hall of the University of Applied Sciences in Oldenburg.
Koseck and Micusik [29] designed an approach of 3D modeling by using street-view panoramic images with piecewise planar methodology. The images are captured with a camera calibrated in a car. The images are mapped one after one, and the 3D model is constructed.
Figure 2.6. 3D model form car image sequences [29]
2.1.2.8 3D city model from video
The concept of constructing a 3D city model with videos is known as Videogrammetry. Videos are captured with a still digital camera or a camera recorder.
20
consists of GPS and IMU to geo-reference the captured scenes. After capturing, computer vision techniques are used to construct the final 3D city model from the videos.
Zhang et al. [31] provided a concept for Depth Map Recovery from a sequence of videos. In the process, each frame is divided into images, and a Depth Map is constructed. To recover the camera parameters, bundle optimization, and disparity initialization Structure-from-motion is used; space-time fusion techniques are used to generate depth maps. Figure 2.7 shows the results of the approach in depth map format.
Figure 2.7. 3D Environment from video with depth map [31]
2.1.2.9 3D city model from TLS data
The TLS is an aerial multispectral digital sensor system by STARLABO, Tokyo. Three-Line-Scanner is a principle which is used to capture image triplets. It captures very high-resolution images of three points, forward, backward, and nadir.
21
Figure 2.8. Data captured with the TLS sensor [32]
Figure 2.9. 3D city model with TLS data and CC Modeler [32]
2.1.3 Laser scanning based 3D models
2.1.3.1 Terrestrial laser-based approach
Vosselman and Dijkman [33] proposed a method for construction of a 3D model with the use of 3d point cloud and ground plan. In this work, Hough transform method is used to extract planar surfaces from irregular point clouds. The algorithm has two faces; first, the intersection between lines and height jump edges is detected. In the second, models are refined by fitting the point cloud. Figure 2.10 shows the constructed model with this approach.
22
Figure 2.10. A 3D model based on laser scanning [33]
A 3D point cloud is generated with the help of LiDAR. Automatic plane detection is performed for the detection of a planar surface. Target recognition is performed for geo-referencing the model. This approach is used to construct the 3D city model with LiDAR data and digital imagery.
Figure 2.11. A 3D model with LiDAR and image [34]
2.1.3.2 Aerial laser-based approach
23
constructed with the point cloud, and image in the right shows the final construction with textures, extracted with an airborne camera.
Figure 2.12. 3D model with point cloud (left); 3D city model with textures (right) [35]
2.1.3.3 3D city model with mobile mapping system
Mobile Mapping System (MMS) is the setup of a camera, LiDAR, RADAR, and GPS mounted on a vehicle. Once calibrated, street recordings are captured from the POV of the vehicle. After capturing the data, it is visualized, and a 3D city model is obtained. Google Street View uses the same concept to capture the street and visualize them from ground level.
Blaer and Allen [36] developed a system for the automatic reconstruction of the 3D city model by using a robot mounted with a laser scanner to capture the data. By visualizing the captured data, they create a 3D model.
24
In their work, they also developed a simulator to test the designed algorithm. With this approach, they created Uris hall at Columbia University and Fort Jay on Governors Island, New York.
2.1.4 VGI data-based 3D city models
In the last decade, research in the area of Volunteered Geographic Information has been at its best, resulting in an increase in the amount of 3D city development. One of the most used and popular projects established in 2004 is OpenStreetMap. Until now, there are more than 2 million active users and contributors with OpenStreetMap [45]. Research by Over et al. [46] introduced the possibility of constructing the 3D city model with the help of OpenStreetMap data, with extension to the research Groger et al. [47] conducted, which concluded that OpenStreetMap has the potential of creating LoD1 CityGML model.
Figure 2.14. Level of Detail [48]
25
The earliest example of crowd generated 3D information is Google 3D Warehouse, started in 2006. The Warehouse contains geo-referenced real-world objects as well as non-referenced prototype models of different complex objects. In recent times, the development of Google SketchUp and ESRI Engine has increased the amount of production in 3D modeling. In 2007, Google and Microsoft included VGI data in their 3D modeling projects.
Goetz M. and Zipf A. [44] provided a method to construct a 3D city model by using OpenStreetMap data. OSM data is the tagged information of every place with geo-locations and height and area information. Authors developed a method to extrude the height parameter and convert the 2D mapped data into a 3D model.
Figure 2.15. OSM tags [44]
Figure 2.15 shows the information about how the data is mapped in OpenStreetMap architecture.
26
Result of the work is shown in Figure 2.16 with extrusion of 2D features.
2.1.5 Hybrid data-based 3D modeling
In this method, multiple types of sensors are used to capture data for the construction of a 3D city model. Sensor combination such as Aerial Laser and Terrestrial Laser, Laser and Camera Images or VGI data and Laser, are used in 3D reconstruction.
2.1.5.1 3D modelling with aerial laser and terrestrial laser
Bohm and Haala [37] designed a methodology for the construction of a 3Dcity model with a combination of Aerial Laser and Terrestrial Laser. The setup consisted of Leica HDS 3000 Terrestrial Laser and OPTECH ALTM 1225 Airborne Laser. Terrestrial Lasers collected façade information and geometry of the 3D model, and Aerial Laser collected information of roof shapes. A 3D point cloud is generated with a combination of both lasers. The combined data is visualized to construct a 3D environment.
Figure 2.17. Combination of both lasers (left); Virtual model (center); Virtual model after alignment (right) [37]
In Figure 2.17, different phases of the methodology are shown; the image on the left is a combination of both lasers and image on the right is the final output of the approach.
2.1.5.2 3D modelling with laser and photogrammetry
27
Figure 2.18. 3D environment with laser and aerial images [38]
The final output of the approach is shown in Figure 2.18, with textures mapped on 3D point cloud faces.
Frueh and Zakhor [39] developed a technique to construct a 3D textured model with the use of ground laser and camera. A truck was mounted with two lasers (one vertical and one horizontal) and one camera to capture recordings.
In this work, Markov Carlo Localization and correlation techniques are used for the final construction of the model. In 2003, the work was extended with the use of aerial laser and aerial imagery.
28
Data received from sensors is combined and visualized as a 3D model of Berkley University.
2.1.5.3 3D modelling with laser and videogrammetry
Zhao et al. [40] introduced a concept of alignment of continuous video on point cloud. LiDAR data and video data are captured for the same scene. A novel approach of registration is used to map the captured video on the 3D point cloud. Before the fusion of sensor data, the 3D point cloud is processed to find the planar surfaces.
Figure 2.20. Laser data and videogrammetry [40]
2.2Texture mapping 3D city model
29
Texture mapping the 3D model consists of following processes
• Texture Extraction
Texture extraction is the process of capturing a real-world image from the building or constructing a computer-based graphical image to map onto the 3D building model. To capture images real-world scenes, a setup with the combination of camera and GPS is used. The camera captures the images from the façade and the GPS sensor geo-locates the image with global coordinates.
• Texture Reconstruction
Texture reconstruction is the process of cleaning the objects which are in occlusion with the building façade. Objects which occlude with buildings are trees, vehicle, night lamps, benches, humans, and electricity wires.
• Texture Mapping
Texture mapping is the process of applying an image onto the relative building façade.
Texture extraction, texture reconstruction, and texture mapping will be discussed in detail in upcoming chapters.
Methods for texture mapping 3D city model
1. Photorealistic method 2. Pictometry based method 3. Laser scanning based method
4. Dynamic pulse function-based method
2.2.1 Photorealistic method
30
Figure 2.21. Rectified image [43]
Figure 2.22. Real-life object removal [43]
As shown in Figure 2.22, the objects in occlusion are removed from the final image.
2.2.2 Pictometry based approach
In Pictometry, front and side elevated images are acquired along with the location of the buildings by using an Uncrewed Aerial Vehicle (UAV). Wang Y. et al. [41] proposed this system of using Pictometry to capture images for façade and roof. In this approach, five cameras capture five geo-referenced images for each side (one top and four sides).
31
In the low flying airplane, the camera angle is set 40-degree, which gives oblique angle images. Once the images are captured, the mesh is unfolded, and each image is mapped with the respective side. As shown in Figure 2.23, the low flying airplane captures five images of different sides.
One of the problems with this approach is that image capturing being at an oblique angle; some parts of the buildings are not captured in the cameras.
Figure 2.24. Hidden angles in Pictometry [41]
In Figure 2.24, it can be seen that while capturing from one side, the other building part is not visible.
2.2.3 Laser scanning based approach
32
Figure 2.25. Laser scanned data (left); texture image (right) [39]
2.2.4 Dynamic pulse function-based method
Alizadehasharfi et al. [42] introduced a technique for texture construction named Dynamic pulse function. The system is a computer-based texture reconstruction. This method is applicable only to those facades which have repetitive objects such as air-conditioners, or windows. The output from this system is of high quality. As shown in Figure 2.26, the left side image contains all parts of the image. The image on the right is the final output constructed with the approach.
Figure 2.26. Dynamic pulse function [42]
33
Figure 2.27. Final model of Karabuk University [42]
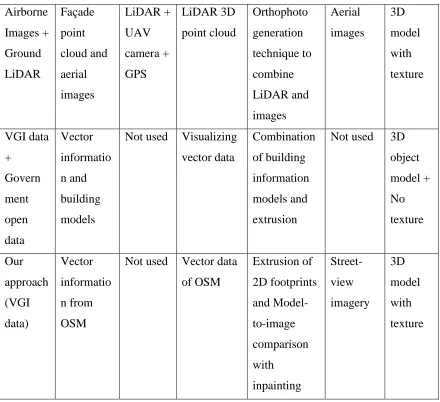
Summary of the methods discussed in Section 2.1 and 2.2 is provided in Table 2.1. Table consists information of method, input to the system, hardware sensors used, acquisition of building shapes, process involved in construction, texture extraction and output of the method.
Method Input Sensors Building
Shape
Process Texture Output
Aerial Images + Close Range Images Stereo paired Aerial Images Airborne Sensor Aerial images + CAD Package Image processing based method Close range images 3D object model Aerial Images + Cadastra l maps Aerial images Airborne Sensor Cadastral Information Image processing based method
34
GIS Raster images + Vector data
N/A N/A
Image processing, Point based method N/A 3D Point cloud GIS + Digital Image Raster images + Vector data + Digital image Digital camera Model constructed in Google SketchUp Image processing based method Close range digital images 3D model with texture Satellite Images IKONOS satellite images
Not used IKONOS images Rational Functional model method N/A 3D object model + No texture Single satellite image IKONOS satellite image
Not used Rational Polynomial coefficients and DEM model Monoplotting technique and shadow of building N/A 3D object model + No texture Panoram a Images Digital panorama image Camera + GPS Digital images Image calibration with space intersection Digital panorama images 3D object model with texture Video Video or
35 Three- line-scanner TLS data of forward, backward and nadir point TLS sensor + GPS Stereoscopi c measureme nt with point cloud data
TLS data and CC Modeler software
Not used 3D model with texture UAV based model Oblique angle aerial images and terrestrial images UAV with GPS + camera Different types of images Image based methods and camera calibration with software Close range terrestrial images 3D model with texture Laser based method Point cloud and ground plan
LiDAR From point cloud data
Segmentation of point cloud surfaces
Not used 3D object model + no texture Mobile mapping system Point cloud and camera images LiDAR + camera + GPS From point cloud data and images Mapping technique with point cloud and camera images Camera mounted on MMS system 3D model with texture Aerial + ground laser 3D point cloud of aerial and ground parts Airborne LiDAR + Terrestri al LiDAR By combining the 3D point cloud from both the lasers Segmentation of point cloud surfaces
36 Airborne Images + Ground LiDAR Façade point cloud and aerial images LiDAR + UAV camera + GPS LiDAR 3D point cloud Orthophoto generation technique to combine LiDAR and images Aerial images 3D model with texture VGI data + Govern ment open data Vector informatio n and building models
Not used Visualizing vector data Combination of building information models and extrusion
Not used 3D object model + No texture Our approach (VGI data) Vector informatio n from OSM
Not used Vector data of OSM Extrusion of 2D footprints and Model-to-image comparison with inpainting Street-view imagery 3D model with texture
Table 2.1: Summary of 3D reconstruction methods with texture information
2.3Related works
The table below gives the information about the work done so far by researchers in area closely related to this research work; also, mentioned are contributions and scope of improvements.
Research Paper Contributions Scope of Improvement
Generating 3D city models without elevation data. Biljecki, F., Ledoux, H., &
Stoter, J. 2017
Uses OpenStreetMap data for the construction of 3D city model; also, open government data used for extra information of buildings
37
information has not been used to from OSM
3D city
model construction based on a
consumer-grade UAV.
Zhongdi, Y. U., Hui, L.
I., Fang, B. A., &
Zhaoyang, W. A. N. G.
2018
3D city model is constructed with textures; same sensors are used to capture the geometry of buildings and texture facades
UAV is mounted with four different cameras so, use of UAV increases the cost of overall system; the textures are captured at oblique angles so need to be processed with rectification methods.
Improving accuracy of
automated 3-D building
models for smart cities.
Yang, B., & Lee, J. 2019
The construction is carried out with the use of hardware sensors; Airborne LiDAR and camera with GPS sensor is used Accuracy is better with the approach because of all the sensors; also, uses already existing building information
An airborne LiDAR is used in the approach which does not give high point density, so the geometry of the building is not much accurate
Automatic Texture
Reconstruction of 3D
City Model from
Oblique Images. Kang,
J., Deng, F., Li, X., &
Wan, F. 2016
Oblique images are used in the construction of 3D city model with the use of UAV; Texture information is also extracted with the same sensors
38
Integration of aerial
oblique imagery and
terrestrial imagery for
optimized 3D modeling
in urban areas. Wu, B.,
Xie, L., Hu, H., Zhu, Q.,
& Yau, E. 2018
A database has been used which consist aerial and terrestrial images of same objects; objects matching method has been used to combine the aerial and terrestrial images
The matching method uses point cloud data created from image but not LiDAR, that reduces the accuracy of the façade plane
Table 2.2: Review of 3D construction and texture mapping techniques
2.4Thesis statement
2.4.1 Problem statement
Literature survey suggests that there is a need for continued change in the methods with which the 3D city model is constructed. 3D city model is used in the self-driving car to know its surroundings; it cannot be used until it gives proper results. At the time of writing this thesis, most methods use the sensory information as input for the construction of 3D city model. The cost parameter is affected with the addition of sensors. Sensors used in the self-driving car are LiDAR, RADAR, camera, GPS enabled IMU, and infrared camera.
39
CHAPTER 3
PROPOSED METHODOLOGY
This chapter discusses about the proposed system to construct a virtual 3D city model and processes of texture mapping; including texture extraction, texture reconstruction, and texture mapping. This chapter contains the flowchart used for the construction of 3D model and detailed methods of texture mapping. Additionally, the chapter discusses about the working of the overall system and connection of virtual 3D city model with all other modules.
3.1 Motivation
In recent years, research in the area of self-driving cars has increased. Despite this, a perfectly functioning autonomous car is still not a reality. Also, semi-autonomous cars have been made available to the market in the last couple of years; and, they have been involved with some pedestrian fatalities [74]. Recently, two deaths involving Uber and Tesla self-driving systems have raised safety concerns. This has resulted in arriving at a conclusion that more computation time is required for dynamic object detection [71].
In our approach, a 3D environment of a real place is constructed, which helps in reducing the computation time for the self-driving system by eliminating static and variable objects (buildings, trees). Also, we are aware that the cost of 3D construction is a huge issue because of the usage of hardware sensors. Hence, this system proposes a method for the construction of a 3D environment with reduced cost and reduction in computation time for the self-driving system.
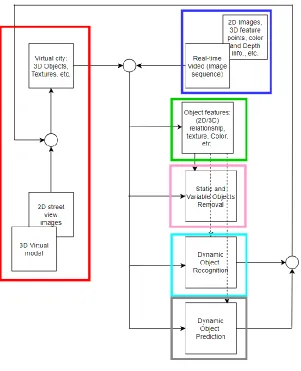
3.2 Working of the overall system
The overall system consists of six modules:
40
3. 3D feature and keypoint extraction 4. Removal of static and variable objects 5. Dynamic object recognition
6. Dynamic object detection
As shown in Figure 3.1, all these modules are interconnected which each other
Figure 3.1. Overall system
41
The description of the overall system is in reference to Figure 3.1. The overall system primarily deals with the construction of a virtual 3D environment with the use of OpenStreetMap data (VGI/crowdsourced) and the façade texture from Google street view images. The virtual 3D city model consists of static objects, such as buildings, and some of the variable objects, such as trees. Apart from this, there is a separate repository which contains 3D models of dynamic objects, such as cars. The module marked in the blue-colored box in Figure 3.1 shows the real-time video (image sequences) passed as input to the system. Real-time image is an image received by the self-driving system through the camera mounted on car. The virtual environment is rendered, and keypoint features and 3D features are stored in a repository; this work is performed in the module colored in green. The module marked in pink is the static and variable object elimination module. In this module, the keypoint features of the input image (blue module) and keypoint features of the virtual environment (pink module) are matched. Matching the keypoint features of the virtual environment and real-time image confirms the location of the car in the real-world; this solves the problem of geo-localization of the self-driving car. With the matching, location of the static objects is also confirmed, and they are eliminated from the object identification process; which provides more time for the identification and prediction of dynamic objects such as human beings or animals on the road, as those are the ones which have impact on the navigation of the self-driving system. The module marked in cyan deals with the object recognition and pose estimation of dynamic objects present in the real-time input image, such as cars. Additionally, this module tracks the recognized objects from multiple frames of the video and calculates the speed of the dynamic object. The recognized object with the pose information along with the object speed and location is used to update dynamic objects into the 3D virtual environment. The module marked in grey color updates the dynamic objects’ information into the virtual environment.
3.2.1 Working of individual modules
42 1. Keypoint extraction and dataset creation:
In the scope of this module, only cars and humans are considered as dynamic objects. In the case of cars, the 3D object models stored in the repository are rendered. KeypointNet [62] is used to extract the keypoint features from different rendered views of car models. The coordinate information of the identified keypoints in the rendered image, orientation details of the keypoint, and the direction of the car (left, right, towards, away), are stored in an annotation file. In case of humans, the DensePose [63] model is adopted and integrated into the overall system for human pose estimation. The DensePose model has its own manually collected ground truth dataset, which annotates dense correspondence between the image and a 3D surface model by asking the annotators to segment the image into semantic regions and to then localize the corresponding surface point for each of the sampled points on any of the rendered part images [64]. The surface coordinates of the rendered views localize the collected 2D points on the 3D model. The dynamic object recognition module uses this repository for matching the keypoint features of the dynamic objects in the input image with the keypoint feature information of the 3D object models stored in the repository and a suitable 3D model corresponding to the object in the input image is retrieved.
2. Static and variable object removal:
In this module, static and variable objects in the real-time image are detected with the Fast R-CNN approach. Once detected, the keypoint features of a virtual image are matched with the keypoint features of a real-time image to verify static and variable objects. Once verified, a heat map is generated for the verified images, and with the help of the heat map and the contour detection, verified objects are eliminated from the image. In this way, static and variable objects are eliminated. This helps reduce the object detection time while the car is running.
3. Dynamic object recognition:
43
input image. A voting algorithm is used for the matching purpose, which also estimates a confidence score that signifies the confidence of object identification. This process improves the confidence of recognition and pose estimation of dynamic objects in the input image. This module is marked in cyan color in Figure 3.1.
4. Dynamic object prediction:
This module uses the information from the dynamic object recognition module to update the virtual city with dynamic objects on the road in real-time. The recognized object, with its pose information, speed and location, is used to update the virtual city with the identified dynamic objects in real-time. Prior knowledge about the dynamic, static and variable objects from the virtual city and IoT is then used to determine the appropriate navigation decision of the self-driving car. This module is marked in grey color in Figure 3.1. The output of different modules is visualized in this module with the use of AirSim Simulator. Also, future prediction about the navigation of dynamic objects is calculated in this module. Moreover, this module predicts the distance from dynamic objects and visualizes them with different indicators.
3.3 Proposed methodology for construction of virtual environment
The proposed methodology consists of four processes followed by the sub-processes,
1) Construction of 3D building models
I. Extracting 3D structural data
II. Converting the 2D footprints into 3D models
2) Geo-locating the 3D environment
I. Setting the offset between local coordinates and world coordinates
3) Texture image construction
I. Extracting Textures from street-level imagery II. Reconstructing the texture images
4) Mapping texture onto building models
44
45
Figure 3.2. Flowchart proposed methodology
3.3.1 Construction of 3D building models
As discussed, OpenStreetMap data is used as 3D structural information. This works as a base for the building models. Overpass API is used to extract OpenStreetMap data from its server; extracted data is a read-only copy of the main OpenStreetMap database, which delivers an arbitrary amount of data. To extract data with Overpass API, coordinates of four real-world points are supplied; with the use of four locations, it creates a bounding box of the region, and that region is extracted in XML data format.
Figure 3.3. Region to extract
46
Figure 3.4 Flowchart for 3D building models
Once the 2D footprints are visualized, the height information is used to extrude the 2D footprints into 3D building models. The most commonly used method for converting 2D footprints to 3D buildings is extrusion. Starting with the basic planar surface, each edge and vertex is selected. They are extended up to their attached height. Pseudocode for the extrusion process is described in Figure 3.5. The extrusion process for the OpenStreetMap data starts by looking for the tags that are relevant to the extrusion process. Some of these tags are building: height, building:levels, building:levels:aboveground, building:color,
building:colour, building:façade:color, building:façade:colour, building:roof,
47
one 3D model. This thesis does not include the roof portion in the process. This is due to the limited availability of databases containing roof information. The pseudocode for the extraction of OSM:tags and combining the building parts is described in Figure 3.5.
Figure 3.5. Pseudo code for building extrusion [44]
In this way, 3D building models are constructed from the OSM data with the GIS extrusion process. The constructed 3D building model is without textures and geo-locations.
3.3.2 Geo-locating 3D environment
48
Figure 3.6. Georeferencing virtual 3D model
3.3.3 Texture image construction
To make the virtual 3D environment look realistic, texture mapping is important. In Chapter 2, most of the current methods use photorealistic texture mapping, which is to capture texture from real locations. Usually, photorealistic texture mapping uses the combination of a camera and a GPS. The camera captures the façade texture information and the GPS references the image to geocoordinates. In our research work, a photorealistic approach is used for texture mapping; the texture is extracted from the Google street view imagery. The texture image construction is a two-part process: first, the extraction of texture images and second, the reconstruction of texture images.
1) Texture image extraction
49
database. The geo-locations file used for geolocating the virtual 3D model, is reused as an input. Here, instead of a keyhole Markup Language file, a comma separated value (csv) file is used. While querying with the street view static API, these parameters are used to fetch the texture image [72].
• Location: takes either a string value (such as Niagara Falls, ON) or latitude and
longitude value. When the address string or coordinates are provided, the API sometimes uses different camera location to provide a better picture
• Pano: is a specific panorama ID
• Size: specifies the output image size in pixels; specified as {width x height} – for
example, 400 x 600 provides an image of 400 pixels wide, and 600 pixels high
Some of the optional parameters are
• Heading: indicates the compass heading of the camera; input values are from 0 to 360 (90 indicates East, and 180 indicates South). If the heading is not provided, then a value is calculated which directs at the location
• Fov: stands for Field of View of an image. This represents the zoom level for an
image, with the default being 90 and maximum 120.
• Pitch: specifies the up or down angle of the camera relative to the street view
vehicle. Positive value angles the camera upwards, and negative value angles the camera downwards.
• Radius: sets a radius to search an image, centered on given latitude and longitude,
input values in meters
With the combination of default and optional parameters, a query is generated and supplied with street view static API to extract an image of a specific location. With the extraction of every image, one annotated file gets generated with the pano id and the geolocation of that image, which helps to match every image with relative façade plane.
2) Reconstruction of texture image
50
and not lose the clarity of the image, an inpainting based method is used. Inpainting is a technique used to restore missing parts of an image or fill patches in an image.
Figure 3.7 Process of image extraction and reconstruction
In this approach, a mask-based inpainting approach is used to remove occlusion in the image. Figure 3.7 describes the process of image extraction and reconstruction.
51
edge-match is performed the remaining part of the texture image is masked and removed to construct the façade texture image of model size. This texture image still contains the occluded objects. To remove them, a mask based inpainting approach is used; which works based on two images, the original image and an image with the mask on objects to be removed. The masked images are obtained with the help of semantic segmentation. A pre-trained model of FCN with ResNet 101 is used to detect and mask the real-life objects from the image. The pre-trained model is trained to detect 16 different classes, such as vegetation, humans, animals, cars, etc. With the help of the masked image and the original image, the occluded objects are removed with inpainting method. Therein, the removed region is filled with the help of neighboring pixels.
![Figure 1.1. Working of self-driving car [53]](https://thumb-us.123doks.com/thumbv2/123dok_us/1340630.1167004/17.612.171.475.429.586/figure-working-of-self-driving-car.webp)
![Figure 1.4. Path planning [54]](https://thumb-us.123doks.com/thumbv2/123dok_us/1340630.1167004/19.612.257.386.549.667/figure-path-planning.webp)
![Figure 1.5. Control in self-driving car [56]](https://thumb-us.123doks.com/thumbv2/123dok_us/1340630.1167004/20.612.239.409.267.460/figure-control-in-self-driving-car.webp)
![Figure 2.3. 3D model with a stereo camera [9]](https://thumb-us.123doks.com/thumbv2/123dok_us/1340630.1167004/30.612.242.413.223.350/figure-d-model-stereo-camera.webp)
![Figure 2.4. 3D model with GIS data [18]](https://thumb-us.123doks.com/thumbv2/123dok_us/1340630.1167004/32.612.229.420.557.685/figure-d-model-with-gis-data.webp)
![Figure 2.6. 3D model form car image sequences [29]](https://thumb-us.123doks.com/thumbv2/123dok_us/1340630.1167004/34.612.132.519.337.543/figure-d-model-form-car-image-sequences.webp)
![Figure 2.19. 3D model of Berkley University [39]](https://thumb-us.123doks.com/thumbv2/123dok_us/1340630.1167004/42.612.212.437.70.292/figure-d-model-of-berkley-university.webp)
![Figure 2.23. Flight path for Pictometry [41]](https://thumb-us.123doks.com/thumbv2/123dok_us/1340630.1167004/45.612.242.406.551.686/figure-flight-path-for-pictometry.webp)