The purpose of the research project was to see if using computer software in classroom instruction would help students learn geometric and probability concepts better. Geometer’s Sketchpad and Probability Explorer software were used1 as treatment instructional tools during a two-week summer Geometry and Probability course. Two groups of students were taught using computer software to determine if the software had an effect on student
learning. The research method used a pre-test/post-test growth measurement indicator. Both groups of students were given pre-tests about geometry and probability to determine their prior understanding of the subjects. The first group was given a computer software treatment for learning geometry while the second group was taught geometry using traditional classroom methods. After one week, the groups were switched and taught probability. The first group was now taught using traditional classroom methods and the second group used computer software to learn probability. When checking to see if a treatment effect exists, considerations are given for students’ prior knowledge of the subject matter and computer skills. After the completion of two weeks of instruction, students were given a post-test to determine negative or positive changes in their achievement. An
by
Peter Madison Eley
A thesis submitted to the Graduate Faculty of North Carolina State University
In partial fulfillment of the Requirements for the degree of
Master of Science Mathematics Education
Raleigh, North Carolina Fall 2008
APPROVED BY:
____________________ ______________________ Ernie L. Stitzinger Karen F. Hollebrands
______________________________ Lee V. Stiff
DEDICATION
I dedicate this Master’s thesis to my late grandmother, Mrs. Geneva Evans Alston. My grandmother was a constant source of inspiration for me throughout my academic career. She never missed any of my graduation ceremonies or recognitions of my academic accomplishments. I miss her smile and her home remedies, but most of all, I miss her encouragement.
I love you Grandma, and I hope to see you again after awhile. With love, from your eldest grandson,
BIOGRAPHY
Peter Eley currently serves as the North Carolina Mathematics and Science Network Pre-College Program Coordinator in the Center for Mathematics, Science, and Technology Education at Winston-Salem State University and also holds an adjunct instructor position at the university. Mr. Eley earned a Bachelor of Science degree in Pure Mathematics from Elizabeth City State University in the year 2000. Two years later, he completed the Master of Science degree program from North Carolina State University in Applied Mathematics. Peter has taught middle school mathematics in Vance County and high school in Granville County in North Carolina.
ACKNOWLEDGMENTS
First, I would like to thank my savior Jesus Christ for giving me the wisdom and determination to tackle the rigors of a graduate level degree. With Jesus, all things are possible. Without Him, I lack direction. Thank You Jesus!
I would like to give my utmost thanks to my lovely and devoted wife Felicia. I know it has not been easy, but we are almost at the end of this long road of academic achievement. We have one more degree to go honey, and then I can give you the time and attention you certainly deserve.
I would also like to acknowledge my chair advisor, Dr. Lee Stiff. Thank you for the support and backing to complete this accomplishment. Your assistance has helped propel me forward to my goal of earning a doctorate degree.
I would like to thank Dr. Ernie Stitzinger, who served as my advisor in the Department of Mathematics when my long journey in academia first began at North Carolina State University. He has been a constant friend and help to me.
To Dr. Karen Hollebrands, you inspired me to pursue a career in math education. I cherish your advice and your warm, ever present smile. Thank you so very much. You will never know how encouraging you are.
have become my second family, thank you all (Amanda, Gemma, Holt, John, Melinda, Val, and Ali). I would like to thank the NC-MSEN Program and all the staff, you have been wonderful. Finally, yet importantly, to my boss, administrative assistant, and office
TABLE OF CONTENTS
LIST OF TABLES... viii
CHAPTER I ... 1
THE PROBLEM... 1
CHAPTER II... 4
REVIEW OF THE LITERATURE ... 4
Dynamic Geometry... 4
Dynamic Probability... 9
CHAPTER III ... 13
THE METHOD... 13
Participants ... 13
Treatment ... 14
Statistics ... 16
Materials... 16
Instruction ... 17
Geometry Treatment ... 18
Probability Treatment... 19
CHAPTER IV ... 22
RESULTS AND DISCUSSION ... 22
Pre-Interviews ... 22
Post-Interviews... 22
Data Analysis... 24
Discussion ... 27
Conclusions... 30
APPENDIX A... 36
APPENDIX B ... 38
APPENDIX C... 39
APPENDIX D... 54
APPENDIX E ... 59
LIST OF TABLES
Table 3.1 Research Design ...15
Table 4.1 Pre/Post-Test Scores ...25
Table 4.2 Descriptive Statistics for Geometry...26
Table 4.3 Descriptive Statistics for Probability...27
CHAPTER I
THE PROBLEM
No Child Left Behind (NCLB, 2001) legislation made educators accountable for students’ proficiency in mathematics based on each state’s individual standards of
performance. As a result of this, innovative ways have been devised to help students learn mathematics and probability concepts better. In many cases, instructional approaches have turned to technology to help in this enormous task. The National Council of Teachers of Mathematics (NCTM, 2000) has endorsed the use of technology for teaching a variety of mathematical content, especially in teaching the concepts of geometry and probability by use of calculators and computers. Using these types of technologies offers the students visual images of mathematical ideas and they facilitate organizing and analyzing data.
Technology in mathematics education aids students in the learning process (NCTM, 2000). NCTM has recognized technology as an important aspect of the teaching/learning process and has identified technology as one of its principles for school mathematics. NCTM says that “Technology is essential in teaching and learning mathematics; it
influences the mathematics that is taught and enhances students’ learning” (NCTM, 2000, p.25). Special technology tools exist to benefit much of what is taught in schools. This is especially true for geometry and probability. Examples of technology that exhibit this are computer software such as Geometer’s Sketchpad, Cabri, Fathom, and Probability
Geometry learning is important because it is a fundamental component of
mathematical learning. It “offers ways to interpret and reflect on our physical environment and can serve as tools for the study of other topics in mathematics and science” (NCTM, 2000, p. 41). Geometry gives students the opportunity to develop their natural sense of reasoning and justification that are used to build skills across the grades (NCTM, 2000). In its Principles and Standards for School Mathematics, NCTM (2000) calls for geometry to be learned using dynamic software as an instructional tool. It is important that a new approach to learning these concepts be found, because the United States (US) performed poorly in geometry and measurement in comparison to other countries according to the Trend in International Mathematics and Science Study (TIMSS) conducted in 2005 by the American Institute for Research.
Learning probability is also important because it allows students to be an informed citizen, employee, and consumer (NCTM, 2002). NCTM endorses the learning of
probability will help students in other realms of study, especially in areas of observation and experimental studies. Data from TIMSS (2005) suggest that the US performed relatively well in statistics and data analysis. Nevertheless, much more work is needed to maintain students’ understanding of probability and data analysis.
Many software programs exist that are designed to help students’ learning in a variety of subjects such as: Cabri (Laborde and Bellemain, 2005), The Geometer’s
Sketchpad (Jackiw, 2001), Fathom (Key Press 2001), and Probability Explorer (Lee, 2001). The purpose of this study was to determine the effectiveness of dynamic computer software on the learning of geometry and probability concepts. Moreover, the study
CHAPTER II
REVIEW OF THE LITERATURE DYNAMIC GEOMETRY
Learning geometry can be very difficult for students, because of the abstractness of the concepts. An example of this would be students’ understanding of transformations. Students often try to understand transformations by doing them in their heads or with static representations given by pencil and paper. In many cases students fail to make accurate constructions of the figures on which they are trying to perform transformations
(Hollebrands 2003). Although students use protractors, rulers, and compasses to create transformations, over time students become weary of the tasks because of the amount of time and steps involved to make accurate figures. Typically, students mimic their instructors and go through exercises without learning and developing needed skills and understandings (Chazan, 1993).
The use of geometry technologies can be incorporated into instruction as a tool for both students and teachers. There have been many studies that incorporate dynamic geometry software into classroom instruction (Chazan, 1993; Edwards, 1997; Hollebrands, 2007; Hoyes & Noss, 1994; Laborde, 1993; Mariotti, 2000; Sanchez, Ernesto, & Sacristan, 2003). Dynamic geometry software gives users the ability to create constructions using equivalent techniques of those associated with a straightedge and compass as well as
enhances the opportunity for students to learn geometric properties associated with constructions they perform because such constructions may be easily repeated using
different figures. The added function of being able to drag computer generated objects also benefits the learning process. Previous research in dynamic geometry software use has produced insight in two areas of importance: “(a) the affects on students’ understandings of geometrical figures and properties, and (b) its influences on students’ deductive reasoning” (Hollebrands & Smith, 2009, in press). In this study, we are concentrating on the affects on students’ understanding of geometrical figures and properties in contrast to using traditional classroom methods to teach these concepts.
Dynamic geometry software empowers students to perform a variety of tasks and encourages them to develop geometric conjectures about observed relationships. This instructional tool is very helpful to students because it strengths their prior knowledge of a protractor, ruler, compass, and enables them to create and recreate figures quickly.
Students are able to do more examples of similar problems with less frustration and more accuracy. Using this tool, students are more likely to understand why deductive proofs are needed, in contrast to empirical proofs, and understand the meaning of geometric
geometric properties. Students are able to investigate empirically and understand the deductive proof without being able to create the proof from the beginning (Chazan, 1993).
Students learn the difference between constructing figures versus drawing them when using dynamic software. Students who construct figures instead of drawing them can easily test conjectures in this dynamic environment. This allows students to develop their own learning at their own pace through exploring different ways to create a construction where all of the properties of that geometric figure are present.
Verbalizing their thoughts can be quite a challenge for students. But while students are being challenged they develop problem solving, critical thinking, and analytical skills. Engaging students in activities and games involving geometry is a powerful way to help students develop important understandings and skills. When so engaged, students often do not realize that they are learning and putting together geometric properties that they have been studying (Edwards, 1997).
Dynamic geometry software is especially useful when you are working with very abstract ideas such as transformations. Many times students try to learn transformation concepts by a pencil-paper method. It is sometimes difficult for student to see the changes that figures are undergoing and students are often unable to make the connection to what is actually happening. Take for example a reflection transformation. Students in a pencil-paper environment have to construct the: given figure, line of reflection, and reflected figure. If students want to move a figure by stretching it, they may not see how the figure would change. They would have to imagine the figure changing in their heads.
transformations visible to students in a dynamic environment in such a way that students develop deeper understandings of transformations.
In a study by Edwards (1997) students learned how to use the TGEO microworld to perform geometric transformations. The microworld allowed students to superimpose one shape on another. The activity became a game to the students who could only use
geometric transformations to succeed at the task. The “game” helped students develop a working understanding of transformations and provided an environment in which to explore transformations through guided discovery. Although upon completion of the study students were not able to develop their own proofs, they were able to follow and understand proofs provided by the investigator.
Using dynamic geometry software helps empower students in developing concepts about rotations about a given point. The software would allow them to select a point of rotation and the angle amount of rotation they would like to use. They could then observe the rotation and analyze the resulting movement. If the concept of rotation is taught from a more traditional point of view, students would have to either imagine a figure rotating about a given point or use a cut-out of the given figure and model the require rotation as
Geometry software played an important role in the studies of Chazan and Edwards. The studies were able to establish that computers could be used by students to learn key geometric concepts and properties. In both studies students were able to test and explore conjectures made in a more manageable environment. Students were then able to transfer their understanding to traditional situations in their study of geometry.
DYNAMIC PROBABILITY
Learning and teaching probability concepts in middle grades can be a difficult task for many teachers. They may find that when they first begin to teach probability concepts that they are not sure where to start in the development of the basic constructs. Researchers (Borovcnik, Bentz, & Kapadia, 1991; Fischbein, 1975; Hawkins & Kapadia, 1984;
There exist many different arguments for how probability should be taught (Borovcnik & Bentz, 1991; Streinbring, 1991; and Shaughnessy, 1992). They vary from traditional rule-driven theoretical approaches to skilled-oriented instruction. Neither of which has been categorized as being effective in teaching students how to effectively use probabilistic reasoning in new situations (Stohl, 2001). Although experimental approaches are often used in school curricula to teach probability concepts, very few employ
technological tools.
Dynamic software exists for the sole purpose of helping students understand probability concepts. They include: Tabletop Jr., Graphers, Probability Toolkit,
Probability Constructor, and Probability Explorer. Although these software programs are commercially available, limited studies (Stohl, 2001) have been conducted to see how effective they are for helping students develop probabilistic reasoning. Konold (1991) developed and used ProbSim software with his students and found that students were able to use the simulations that it created to analyze data more effectively. Like Konold, others developed simulation software to meet the need for analyzing empirical data.
The Probability Explorer software was developed and used by Stohl (2001) for her dissertation work on probabilistic reasoning in children using microworlds. “The design of the microworld is based on a constructivist theory of learning, design of mathematical computer microworlds, and research on students’ understanding of probability and rational number concepts”( Drier, 2000). Implications from Stohl’s work suggest that carefully designed microworld tools can facilitate probabilistic reasoning. From her work she was also able to conclude that reflecting on changes in multiple representations during a simulation encouraged students to develop theories-in-action about the Law of Large Numbers (Stohl, 2001).
The probability software programs cited above have a common
CHAPTER III THE METHOD
The purpose of the study was to determine if using dynamic computer software in classroom instruction would help students learn geometric and probability concepts. The instructional variables in the study were traditional classroom instructional methods and instruction involving dynamic computer software. The students were interviewed to obtain background and demographic information. Student learning was measured by their
performance on the pre- and post-tests that were given at the beginning and end of the investigation period.
PARTICIPANTS
Nine (9) middle grades students from a public school system in central North Carolina participated in this research study. The students ranged in age from eleven to thirteen years old. Seven (7) male students and two (2) female students took part. The two female students were both African American. Six male students were African American, and one was Asian American. All of the participants were average or above average
their formal schooling to date. The socio-economic status of all of the students was determined to be middle class. None of the students had any documented disabilities— physical, emotional, or mental.
The two instructors (Instructors A and B) who taught the geometry and probability classes of the study had very strong backgrounds in mathematics. Both were experienced middle school teachers with a combined 7 years of public school classroom teaching at the middle school level.
TREATMENT
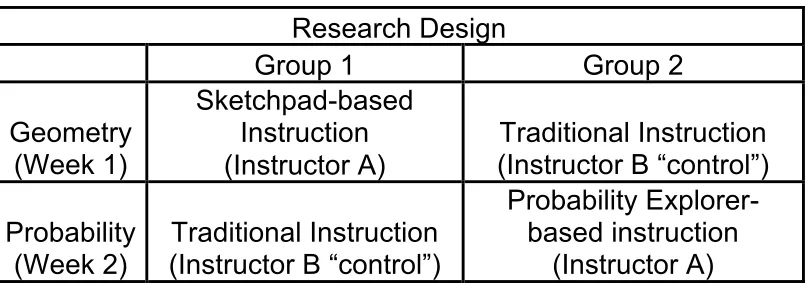
Students in the study were divided into two groups: Group 1 and Group 2. Instructor A taught both geometry and probability using the appropriate dynamic software programs (Geometer’s Sketchpad and Probability Explorer). Instructor B taught both geometry and probability in a traditional manner without using any dynamic software programs.
Table 3.1 Research Design
Research Design
Group 1
Group 2
Geometry
(Week 1)
Sketchpad-based
Instruction
(Instructor A)
Traditional Instruction
(Instructor B “control”)
Probability
(Week 2)
Traditional Instruction
(Instructor B “control”)
Probability
Explorer-based instruction
(Instructor A)
A group of nine (9) sixth-grade students were randomly divided into two smaller groups. The first group (Group 1) had five students and the second group (Group 2) had four students. Each participant was interviewed by the researcher who asked seven
questions about their experiences with technology and their likes and dislikes regarding the use of technology to learn mathematics. The interviews helped to gain more information about students’ feelings toward the math content. (See Appendix B.) These data were recorded and saved for analysis and comparison to post-interview data.
the beginning of the study, the two groups of students were given two pre-tests to measure their understanding of geometry and probability. At the conclusion of the first week, a post-test in geometry was administered to Groups 1 and 2. At the conclusion of the second week, a post-test in probability was administered to Groups 1 and 2.
STATISTICS
A two-sample t-test was used to detect differences between the groups’ performance on the pre- and post-tests. The t-test allows us to observe differences between two samples with the results depending on the spread of the observations as well as on the two means (Moore, 2004). It was assumed that the variances were unequal in all of the cases.
MATERIALS
The classroom in which the traditional instructional approach was implemented was a typical mathematics classroom. The classroom in which the instructional treatment was implemented was equipped with a presentation device and a projection screen on which the teacher could project software-driven instruction. Students receiving the instructional treatments used handouts provided by the instructor. (See Appendices C and D.) Each student in the treatment groups had access to a Dell Latitude laptop computer with wireless internet capability and a Texas Instruments 83-Plus calculator. The computers were
INSTRUCTION
Instruction for the Geometer’s Sketchpad treatment was taught using supplemental handouts developed by Karen Hollebrands. (See Appendix C.) Hollebrands created these materials, which were modified in the study for middle school students, to teach high school students geometry by incorporating dynamic geometry software instruction into their geometry curriculum. The handouts are very detailed and give step-by-step instruction on transformations. (See Appendix C.) The materials consist of activities that allow students to explore properties of transformations in a dynamic environment. Instructor A was a facilitator for his students, providing help and support as needed. Each day’s lesson included a discussion about the lesson objectives designed to help students better
understand the content. Geometry: Applying, Reasoning, Measuring (Larson, Boswell, & Stiff, 2000), pages 394-412, was used as a reference for definitions and study problems. The traditional geometry class used the same textbook as its source of instruction. Standard tools such as protractors, pattern blocks, wax paper, and the chalkboard were used in the traditional classroom to help student to learn lesson objectives.
concepts, including pre-loaded computer files. (See Appendix D.) No textbook was used in this class, students were taught probability using the handouts provide. (See Appendix D.) The traditional probability class used number cubes, spinners, playing cards, and the chalkboard to help student to learn lesson objectives.
On the first days of geometry and probability instruction, both Groups 1 and 2 were given a pre-test to determine their existing knowledge and skills for the subject matter. The participants were taught geometry during the first week. Group 1 was randomly determined to receive the treatment instruction using the Geometer’s Sketchpad software. During the first week, Group 2 received traditional geometry instruction. Consequently, Group 2 would receive the Probability Explorer treatment for the probability instruction given the second week. Accordingly, Group 1 would be taught probability using traditional teaching methods.
GEOMETRY TREATMENT
During Week 1 of the geometry lessons, both groups studied transformations: reflections, rotations, and translations. On Day 1, the students took a pre-test on
Group 2, used traditional teaching methods to meet the same lesson objectives. On Day 2, a review of the previous day’s lesson was provided to both Groups 1 and 2. Then, the new lesson objectives were introduced. The treatment group, Group 1 was taught translations using Geometer’s Sketchpad. The students were given handouts to complete the tasks in translations (See Appendix C.). The control, Group 2, was taught using materials such as protractors to demonstrate translations. This pattern of instruction for the treatment and control group follows throughout the rest of this research project. On Day 3 of the project a review of translations was given to both groups. Then, appropriate lessons on rotations were introduced to each group. On Day 4 a review of rotations was provided and new lessons on reflections were taught. On Day 5, a review of all of the transformations was provided followed by a post-test.
PROBABILITY TREATMENT
Probability Explorer did not compute the probabilities for students but became a visual aid in helping them see what was going on and keeping track of data. Group 1, now the control group, learned simple probability from using manipulatives, number cubes, and handouts. This pattern of instruction for the treatment and control groups was followed throughout the rest of the week. That is, prepared activities that were used to teach the probability
Pre- and post-test scores were analyzed. The research hypotheses were as follows: H1: No significant differences exist between the pre- and post-test geometry scores of Group 1 & Group 2. (P-value ≤ 0.05)
CHAPTER IV
RESULTS AND DISCUSSION PRE-INTERVIEWS
The students who participated in the study were interviewed prior to their instruction to acquire information about their backgrounds and academic status. On the pre-interview, 5 out of 9 students said they enjoyed learning mathematics. All of the
students said they enjoyed using technology. Each child said they had a computer available to them at home. Although the students in the study indicated that they had been exposed to using technology in an educational setting, only 2 out of 9 of them had used computer software to do either geometric or probability assignments. All of the students did indicate that they felt that using computer software would help them to learn geometric and
probability concepts in a meaningful way. POST-INTERVIEWS
DATA ANALYSIS
Geometry
Group (1 or 2)
Treatment Type & Instructor
(A or B) Pre-test Post-test Difference
1 Sketchpad(A) 35 35 0
1 Sketchpad(A) 35 65 30
1 Sketchpad(A) 25 60 35
1 Sketchpad(A) 10 5 -5
*1 Sketchpad(A) 50 45 -5
average 31 42 11
2 Traditional(B) 25 40 15
2 Traditional(B) 55 85 30
2 Traditional(B) 30 85 55
2 Traditional(B) 65 55 -10
average 43.75 66.25 22.5
Probability
Group (1 or 2)
Treatment Type & Instructor
(A or B) Pre-test Post-test Difference
1 Traditional(B) 29 33 4
1 Traditional(B) 14 29 15
1 Traditional(B) 14 33 19
1 Traditional(B) 29 29 0
average 21.5 31 9.5 2 Probability
Explorer(A) 38 33 -5
2 Probability
Explorer(A) 29 38 9
2 Probability
Explorer(A) 24 29 5
2 Probability
Explorer(A) 24 33 9
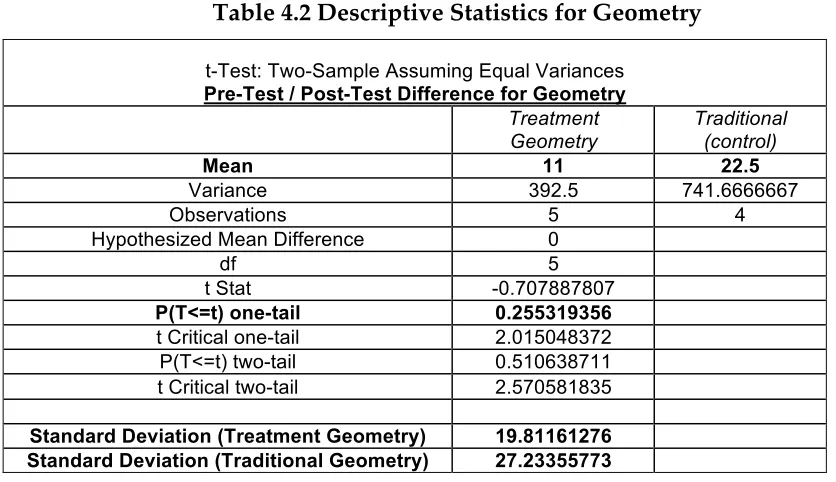
Tables 4.2 and 4.3 show mean difference scores and standard deviations for the pre-test/post-test differences for geometry and probability, respectively. It was found that the control group (Group 2) in geometry had a higher mean difference score than the treatment group (Group 1). Difference scores were analyzed using Student’s t-test for
α
=.05. The results of this analysis are found in Table 4.2. As seen in the table, there was no significant difference between the mean difference scores in geometry for Groups 1 and 2.
Table 4.2 Descriptive Statistics for Geometry
t-Test: Two-Sample Assuming Equal Variances
Pre-Test / Post-Test Difference for Geometry
Treatment Geometry
Traditional (control)
Mean 11 22.5
Variance 392.5 741.6666667
Observations 5 4
Hypothesized Mean Difference 0
df 5
t Stat -0.707887807
P(T<=t) one-tail 0.255319356
t Critical one-tail 2.015048372 P(T<=t) two-tail 0.510638711 t Critical two-tail 2.570581835
Standard Deviation (Treatment Geometry) 19.81161276 Standard Deviation (Traditional Geometry) 27.23355773
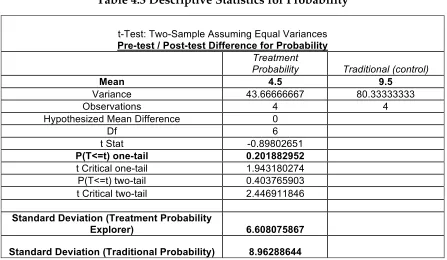
analyzed using Student’s t-test for
α
=.05. The results of this analysis are found in Table 4.3. As seen in the table, there was no significant difference between the mean difference scores in probability for Groups 1 and 2.Table 4.3 Descriptive Statistics for Probability
DISCUSSION
According to Table 4.2, students did not benefit from using Geometer’s Sketchpad to learn concepts about geometric transformations. There is an 11.5 point difference in the averages suggesting that traditional classroom methods used to teach transformations work
t-Test: Two-Sample Assuming Equal Variances
Pre-test / Post-test Difference for Probability
Treatment
Probability Traditional (control)
Mean 4.5 9.5
Variance 43.66666667 80.33333333
Observations 4 4
Hypothesized Mean Difference 0
Df 6
t Stat -0.89802651
P(T<=t) one-tail 0.201882952
t Critical one-tail 1.943180274 P(T<=t) two-tail 0.403765903 t Critical two-tail 2.446911846
Standard Deviation (Treatment Probability
In geometry, the post-test scores of students who had Instructor B were, on average, 24 points higher than Instructor A. In probability, the post-test scores of students who had Instructor A were approximately, 2 points higher than Instruction B. (See Table 4.1.) From the data we can say that Instructor B was better at teaching the probability and geometry lesson objectives as evident by the mean difference scores in Tables 4.2 and 4.3.
Topics covered
Instructor A Instructor B
Learn software basics Teach specific concepts Teach specific concepts Ensure students are using
traditional manipulates correctly Teach software basics for that
specific concept (repeated for each new concept)
Guided Practice Time for Students with Instructor Ensure students using software
correctly
Guided Practice Time for
Students with Instructor
The t-test was used to analyze the data for the geometry pre-test/post-test difference scores. The hypothesis was that the geometry software treatment scores would be the same as traditional treatment scores with value equal to .05. The t-test yielded a one-tailed p-value of 0.25. Therefore, we conclude that no significant difference exist between the geometry software treatment scores and traditional treatment scores.
CONCLUSION
The purpose of this study was to find evidence that suggest that using computer software would make a difference in students learning geometry and probability concepts. The research study was conducted by having students separated into two groups with one group as the traditional (control) and the other as the treatment group. The students took pre and post-tests on the content of the study. The scores from these tests were analyzed using quantitative methods.
The statistics from the geometry part of the study suggested that students in the traditional classroom environment outperformed those in the computer software oriented classroom. Although the use of software did not result in students performing better than their counterparts, it is believed, based on post-interviews that the computer-oriented classrooms did have an impact on how the students felt about the subject matter. The students were more motivated to complete task because they were interested in using the computer to do so. Still, it can be noted that there was no significant difference between the software treatment group and the traditional group.
probability using the software as a whole did better than students who did not. Students who used the software did not do better we feel because they had to learn how to use the software in a small window of time. The software allowed the students to build tables of compiled data, which seemed to enhance student understanding of related probability concepts but the data did not reflect that. By constructing examples the students were able to explore learning probability in different ways that could be more meaningful to them. It was also noted that a teacher effect may exist, however it was beyond the scope of this study.
The data from this study suggest that a teacher effect may be present. Instructor B had better overall results than Instructor A. Any future study must account for instructional differences pursuant to the teachers participating.
Lastly, it appears that using computer software to help students learn geometric and probability concepts is effective as a motivational tool as conclude from the
REFERENCES
American institute for research (2005). Reassessing U.S. international mathematics performance: new findings from the 2003 timss and pisa. Washington, DC Borovcnik, M. G. and Bentz, H. J. (1991) ‘Empirical research in understanding
probability’: in R. Kapadia and M. Borovcnik (eds.), Chance Encounters: Probability in Education, pp. 73–105.
Borovcnik, M. & Bentz, H.-J. (1991). Empirical research in understanding
probability. In R. Kapadia & M. Borovcnik (Eds.), Chance encounters: Probability in education (pp. 27-71). Boston: Kluwer Academic Publishers.371
Chazan, D. (1993). High school geometry students’ justification for their views of empirical evidence and mathematical proof. Educational Studies in Mathematics, 24, 359-387.
Drier, H. S. (2000). Children's probabilistic reasoning with a Computer microworld. Unpublished doctoral dissertation, University of Virginia.
Edwards, L. D. (1997) Exploring the territory before proof: Students’ generalizations in a computer microworld for transformation geometry. International Journal of Computers for Mathematical Learning, 2, 187-215.
Hawkins, A. S., & Kapadia, R. (1984). Children’s conception of probability – A
psychological and pedagogical review. Educational Studies in Mathematics, 15, 349-377.
Heidi, M.K. & Zbiek, R.M. (2004). Technology-intensive secondary school mathematics curriculum.
Hollebrands, K. F. (2003). High school students’ understanding of geometric transformations in the context of a technological environment. Journal of Mathematical Behavior 22, 55-72.
Hollebrands, K. F. (2006). Exploration I - V :Transformation activities using geometer's sketchpad. In P. Eley (Ed.) (pp. 27). Raleigh, NC.
Hollebrands, K. F. (2007). The role of a dynamic software program geometry in the strategies high school mathematics students employ. Journal for Research in Mathematics Education 38,2,164-192.
Hollebrands, K.F. & Smith, R.C. (2009, Accepted). Using dynamic geometry software to teach secondary school geometry: Implications from research. In T. Craine (Ed.) Understanding Geometry for a Changing World: 2009 Yearbook of the NCTM. (pp. TBD). Reston: VA: National Council of Teachers of Mathematics.
Jackiw, N. (2001) The Geometer’s Sketchpad Ver. 4.0. Emeryville, CA: Key Curriculum Press, 2001. Software.
Jiang, Z. & Potter, W. D. (1994). A computer microworld to introduce students to probability. Journal of Computers in Mathematics and Science Teaching 13, 197-222.
Konold, C. (1991). Understanding students’ beliefs about probability. In E. von Glaserfeld (Ed.), Radical Constructivism in Mathematics Education (pp. 139- 156). Holland: Kluwer.
Laborde, C. (1993). The computer as part of the learning environment: The case of geometry. In Learning from Computers: Mathematics Education and Technology edited by Christine Keitel & Kenneth Ruthven, 48-67. Berlin: Springer-Verlag
Laborde, J. and Bellemain, F. (2005) Cabri II. Temple, TX: Texas Instruments. Larson, R., Boswell, L., & Stiff, L. (2000). Transformations. In Geometry:
Applying, reasoning, measuring (10 ed., pp. 394-412): Houghton Mifflin Company.(Larson, Boswell, & Stiff, 2000)
Lee, H. S. (2006). Probability explorer activities. In P. Eley (Ed.) (pp. 1-4). Raleigh, NC. Lee, H.S. (2008). Probability Explorer: Retrieved November 12, 2008 from
Mariotti, M. A. (2000) Introduction to proof: The mediation of a dynamic software environment.” Educational Studies in Mathematics, 44,1–3, pp.25–53.
Moore, D. S. (2004). The basic practice of statistics. (3rd ed.). New York: W.H. Freeman and Company
National Council of Teachers of Mathematics. (2000). Principles and Standards of School Mathematics: Retrieved February 28, 2008 from
http://my.nctm.org/standards/
No Child Left Behind Act of 2001, Public Law 107-110 C.F.R. (2001).
Sanchez, E. and Sacristan, A. I. (2003) Influential aspects of dynamic geometry activities in the construction of proofs. In Proceedings of the Joint meeting of International
Group for the Psychology of Mathematics Education and North American
Chapter edited by Neil A. Pateman, Barbara J. Dougherty, and Joseph. T. Zilliox , v. 4, 111-118. Honolulu, Hawaii: CRDG, College of Education, University of
Hawaii
APPENDIX A Research Plan
Week 1 (June 19- June 23) (Classroom Instruction)
Day 1: Pre-test and Introduction to the basic tools, menus, and commands for using the software program The Geometer’s Sketchpad. Constructing basic geometrical figures (squares, rectangles, parallelograms, triangles (isosceles, right).
Introduction to vectors and translations
Solve problems such as: Find the image or pre-image of a figure under a translation. Given the pre-image and image determine the translation vector that was used.
Day 2: Investigating the compositions of two or translations. Introduction to tessellations. Introduction to rotations - Center and angle of rotation and properties that are preserved by rotations. Solve problems such as:
Day 3: Investigating the composition of two or more rotations. Introduction to reflections
Solve problems such as: Find the image or pre-image of a figure under a particular reflection. Determine the location of the mirror line given a pre-image and image.
Day 4: Investigating compositions of reflections. Use of reflections to solve “real world” problems (e.g., miniature golf GSP game)
Identifying unknown transformations using the GSP matching task (translations, reflections, rotations). Creating a Kaleidoscope
Day 5: Review Post test
Translations, rotations, reflections
Week 2 (June 26-29) (Classroom Instruction)
Day 2: Probability: Guess My Marbles I, II & III with replacement activity Day 3: Probability: The Fish activity with replacement activity
APPENDIX B
Interview Questions for Does technology make a difference project. Pre-Interview
1. Do you like mathematics? 2. Do you like technology?
3. Do you have a computer at home?
4. Have you ever used a technology do school work?
5. Have you ever used technology to geometry of statistics? 6. Did at least one of your parents graduate from college? 7. Do you feel that the computer will help you to learn math? Post-Interview
1. Did you feel that the technology helped you to learn math? 2. Do you feel like you learn the math material?
3. Did you enjoy the activities that were given?
APPENDIX C
EXPLORATION I: Translations
A translation is a function that maps objects a specified distance in a specified direction. A way that
mathematicians communicate a specified distance and a specified direction is through a vector. In drawings, a vector looks like an arrow in the intended direction and whose distance indicates the specified distance.
1. Open the GSP sketch, “Translate.” Create three points, and label them A, B,
and C. Now, click the tool button , use the pull down menu to select
vector and then click and drag to create a vector. Label it . Your finished
sketch might look something like this.
2. Select points D and E. Choose “Mark Vector” from the Transform menu. Select points A, B, and C and choose Translate from the Transform menu. The result should be a set of three new points configured just like the original ones, but in a new location.
Each new point is called the image of the
Vector JK:
“Vector JK” is
written
One convention is to give the label A′
to the image of A,
B′ to the image of
corresponding original point. Each original point is called the pre-image of the
corresponding new point.
If your image points are not already labeled, use the Label tool to label them.
3a. Predict what you think will happen if you move the “head” (in some dynamic geometry tools, the “head” will appear as an arrow endpoint) of the vector and record your prediction below:
b. Try it out. What happens? Explain why.
4a. Predict what you think will happen if you move the “tail” of the vector and record your prediction below.
b. Try it out. What happens? Explain why.
5. Using the selector tool, move the entire vector without changing its length or direction.
a. What happens? Explain why.
c. If the tail is at point A or point B, predict where the head of the vector will
be in each of these cases.
6. Connect points A and B with a segment, and connect points A’ and B’ with a segment. Your sketch should look something like the one to the right. Now, move the entire vector so its tail, D, sits at a point
somewhere along . No matter which point along you choose, its head
then sits at a point on . Why?
7. Drag point A and describe what happens. Why?
1
b. What happens to , , and as you move the head of the vector?
Explain why.
11. Using the same vector of translation, translate the new points (A’, B’, and C’). Label their images A’’, B’’, and C’’. Now move the head of the vector.
a. Explain what happens to these newest points.
b. How far is A'' from A'?
12. This following picture shows the segment and its image after a
translation by . Point G was marked afterwards. If you were to translate G
Translations1
Name
Date
1. Open a new sketch. Construct . Using this segment and translations,
construct a parallelogram. Use properties of translations to explain why your construction works.
2. Consider each of the following questions. Explain your answer.
a. Does a translation preserve lengths of segments?
b. Does a translation preserve areas of polygons?
c. Does a translation preserve measures of angles?
d. Under any single translation, are any points mapped to themselves
(that is, are there any fixed points)?
e. Does a translation map parallel lines to parallel lines?
1
3. How is a vector similar to and different from a ray?
4. Sketch the pre-image of polygon ABCD where polygon ABCD is the image under translation by the vector GH.
Rotations Name
Day 2 Date
1. Open a new sketch. Construct . Using this segment and rotations,
construct an equilateral triangle. Describe your construction method in the space below and use properties of rotations to explain why it works.
2. Consider each of the following questions. Explain your answer.
a. Does a rotation preserve lengths of segments?
b. Does a rotation preserve areas of polygons?
c. Does a rotation preserve measures of angles?
d. Under any single rotation, are any points mapped to themselves
(That is, are there any fixed points)?
f. Does a rotation map perpendicular lines to perpendicular lines?
g. Does a rotation map collinear points to collinear points?
4. Sketch the pre-image of polygon B’C’D’ where polygon B’C’D’ is the image
Rotations
2. ___________________________________________________________ S
ketch the image of polygon ABCD when it is rotated 130° about point T.
3. Sketch the pre-image of polygon ABCD where polygon ABCD is the image
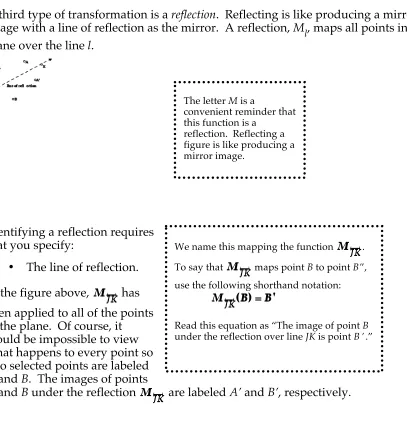
EXPLORATION V: Reflections
2A third type of transformation is a reflection. Reflecting is like producing a mirror image with a line of reflection as the mirror. A reflection, Ml, maps all points in the plane over the line l.
Identifying a reflection requires that you specify:
• The line of reflection.
In the figure above, has
been applied to all of the points in the plane. Of course, it would be impossible to view what happens to every point so two selected points are labeled A and B. The images of points
A and B under the reflection are labeled A’ and B’, respectively.
2
These activities are adapted from, Technology-Intensive Secondary School Mathematics
The letter M is a
convenient reminder that this function is a
reflection. Reflecting a figure is like producing a mirror image.
We name this mapping the function .
To say that maps point B to point B’’,
use the following shorthand notation:
Read this equation as “The image of point B
1._Open a new GSP sketch. Click on the line tool and draw . Click on the
point tool and create three points, L, M, and N, not on the line. Your sketch
should look similar to the picture that follows.
a. Choose the selector arrow. Click on line JK and choose “Mark Mirror” from the Transform menu. Choose the selector arrow and click on points L, M, and N. Choose “Reflect” from the Transform menu. Observe what
happens when you drag and when you drag points L, M, and N.
Describe how a point and its image under reflection are related.
b. Choose the segment tool. Connect L and L’ with a line segment. Do the
label the points where the segments intersect . Measure the distances
from L to the intersection of segment LL’ and line JK. Then measure the
distance from L’ to the intersection. Repeat these two steps for points M
and M’, and for points N and N’. What do you notice about the distances?
2. Can the pre-image point and image point ever be on the same side of the line of reflection? Explain.
3. Each line segment joining a (pre-image, image) pair intersects the line of reflection. What can you say about the angles formed as these segments intersect the line of reflection? Why does this make sense?
4. Describe the relationship between and .
5. Move a pre-image point so that it coincides with its image point. Where does this occur? At how many different locations does this occur? Explain.
6. Delete segments LL’, MM’, and NN’ without deleting their endpoints. Create segments LM and L’M’. What do you notice about these two segments?
GUESS MY MARBLES I
There is a Bag containing 10 Marbles. The marbles could be any of six colors: white, black, red, green, blue, and yellow.
We are able to take a sample from this bag by choosing one marble at a time with
replacement—meaning each time we pull a marble out and record it’s color, we put it back in the bag.
You should open the file called 10marbles.pbe in Probability Explorer. Use the run button to simulate choosing a marble from the bag.
Goal: Predict how many marbles of each color are in the bag based on results from sampling.
What strategy did you use? Why?
GUESS MY MARBLES II
There is a Bag containing 100 Marbles. The marbles could be any of six colors: white, black, red, green, blue, and yellow.
We are able to take a sample from this bag by choosing one marble at a time with
replacement—meaning each time we pull a marble out and record it’s color, we put it back in the bag.
You should open the file called 100marbles.pbe in Probability Explorer. Use the run button to simulate choosing a marble from the bag.
Goal: Predict how many marbles of each color are in the bag based on results from sampling.
What strategy did you use? Why?
Guess My Marbles III
DIRECTIONS:
Design a bag of marbles with 12 marbles, with either 2, 3, or 4 colors of your choice. Do not show your bag of marbles to any other student. HIDE the Weight Tool and the Bag of Marbles (under the OPTIONS menu).
SWITCH COMPUTERS with a partner. Now you must use the tools in Probability Explorer to try to predict what is in your partner’s bag of marbles.
2. Based on data collected what is your BEST prediction for what is in the bag?
The Fish Study
Scientists are studying how fish population in particular lakes change over time. To conduct their study, they populated each of the four lakes with the same number and types of fish. They are interested in knowing about the growth of fish in the lakes. Specifically, they asked us to investigate whether there is evidence that the distribution of fish in the four lakes is still the same now that some time has passed.
Your job is to study and describe the distribution of fish in the four lakes and provide a convincing argument for your claim.
Then we need to determine how the lakes are alike or different and support our claim. The Lake files needed for your study are:
LakeAlta.pbe LakeBeta.pbe LakeDiamond.pbe LakeGamma.pbe
APPENDIX E Pre- Test
Transformation Concepts
Name:________________________ Teacher:_______________________
1. Which of the following are true about a transformation that has isometry? a. it preserves length b. it preserves angle measurements c. it preserves parallel lines d. it preserves distance between points e. all of the above
Answer questions 3-5 using the figure below.
3. Name the preimage of GH ___________________ 4. Name the image of DC _______________________
Name:________________________ Teacher:_______________________ 6. Circle the line of reflection?
Name:________________________ Teacher:_______________________
Using he graph paper provided, graph the reflection of each 8. A(5,4) in the x-axis
9. B(-2,3) in the line y= 3
10.D(0,0), E(2,2), F(4,0) in the x-axis
11. Rays drawn from the center of rotation to a point and its image form an angle called? a. rotation b. angle of rotation c. center of rotation d. none of these
12. Which figure does not has rotational symmetry?
Name:________________________ Teacher:_______________________
USE THE FIGURE TO ANSWER QUESTIONS 13-15
Name:________________________ Teacher:_______________________
USE FIGURE TO ANSWER QUESTIONS 17-18
Name:________________________ Teacher:_______________________
USE THE GRAPH TO ANSWER QUESTIONS 19-20
Match the vector components (Approximate) 18. Find vector < -11 , 0 > a. b. c.
Appendix F
Probability Pre/Post Test
Use the narrative for problems 1-4
You have a jar that has 18 marbles in it. Five of the marbles are blue, four are orange, and nine are purple. Find the probabilities of picking each color if you assume that each marble has an equal chance of being picked from the jar.
1. P (purple) a. 2/9 b. ½ c. 0 d. 5/18
2. P (orange) a. 0 b. 2/9 c. 5/18 d. 1/2
3. P (blue) a. 5/18 b. 0 c. ½ d. 2/9
4. P (red) a. ½ b. 5/18 c. 2/9 d. 0
Use the narrative for problems 4-14
Suppose that you toss a coin and roll a six-sided die for the following problems. 5. What is the probability of obtaining tails and a five? a. 1/12 b. 7/12 c. ½
6. What is the probability of obtaining tails or five? a. 1/12 b. 7/12 c. ½
7. What is the probability of obtaining heads and a two? a. 1/12 b. 7/12 c. ½
8. What is the probability of obtaining tails? a. 2/3 b. ½ c. 7/12
9. What is the probability of obtaining one, two, three, or four? a. 2/3 b. ½ c. 7/12
10.What is the probability of obtaining heads or a two? a. 2/3 b. ½ c. 7/12
12. What is the probability of obtaining heads or an odd number? a. ½ b. ¼ c. ¾
13.What are the probability of obtaining heads and a five? a. 7/12 b. ¼ c. 1/12
14.What is the probability of obtaining heads or a five? a. 7/12 b. ¼ c. 1/12
Use the narrative for problems 14-20
A single card is selected from an ordinary deck of cards. Find the probabilities for the following.
15.P (five of hearts) a. 1/13 b. 5/13 c. 1/52 d. ¼
16.P (Five) a. 1/13 b. 5/13 c. 1/52 d. ¼
17.P (even number) a. 1/13 b. 5/13 c. 1/52 d. ¼
18.P (heart and a jack) a. 4/13 b. 5/13 c. 1/52 d. ¼
19. P (diamond) a. 4/13 b. 5/13 c. 1/52 d. ¼