A Unified Framework For Supervised And
Unsupervised Feature Selection In Data Mining
K.sutha, dr.j.jebamalar tamilselvi
Abstract—data analysts use data mining tools to find out useful information from high dimensional data. Massive data needs to be preprocessed to avoid inaccurate mining results. Feature selection is a preprocessing step in data mining, as well as in other fields like machine learning. It involves in selecting a best feature subset for providing accurate mining results. Depending upon the availability of class information, feature selection algorithms are categorized as supervised and unsupervised feature selection. As a result of researches in this field for more than a decade, there are a large number of feature selection algorithms in both the categories. This paper introduces a new unified framework using laplacian score and distance correlation, for supervised and unsupervised feature selection, which can handle both labeled and unlabeled dataset. Experimental results reveal that the proposed framework works well for both supervised and unsupervised feature selection process.
Index terms: classification, clustering, dimensionality reduction, feature selection, supervised, unsupervised, labeled data, unlabeled data.
—————————— ——————————
1.
INTRODUCTION
Analyzing large amount of data, results in most beneficial and intelligent outcomes. Data Mining (DM) uses mathematical algorithms to analyze such larger data sets and comes out with most useful information. Data Analysts utilizes DM tools and techniques to understand and predict knowledge from the huge amount of data. Using DM techniques: Enterprises can improve customer relationships, increase turnover, predict the future trends in business, take crucial decisions and reduce risk. Financial Institutions can safeguard themselves from fraudulent customers. Health
care providers can improve their quality of service. As the dimensionality increases, the performance of mining
algorithm degrades due to the problem of ―Curse of Dimensionality‖ [1]. Another problem with larger dataset is that it possesses noisy, redundant and irrelevant data, which affects the accuracy of mining results [2]. High dimensional data should undergo preprocessing steps before applying mining algorithms. Feature Selection (FS) is one of such preprocessing steps, involves in selecting an optimal subset of features. Mining the optimal feature subset provides better accuracy than with the massive dataset. The main goal of FS algorithm is to select an optimal feature subset as small as possible to achieve better mining performance.
FS offers the following advantages (i) reduces the computational time (ii) improves the mining performance and accuracy (iii) improves result comprehensibility (iv) and reduces the dimensionality and storage requirements [3]. A number of FS algorithms have been proposed by various researchers in the past decade, are classified into [4] (i) Filter (ii) Wrapper (iii) Embedded (iv) Hybrid. Filter type FS algorithms uses the general characteristics of the data, does not involve any mining algorithm in the FS process. This type of FS is the best choice when there is large number of features [4]. It is computationally efficient but it does not provide better accuracy [5]. Wrapper type FS algorithms use a classifier in the FS process and use its performance for finding the best feature subset. It requires more computational time and gives more accurate results compared with filter methods. Embedded FS methods like
Artificial Neural Networks (ANN) integrate FS as part of the training process. Hybrid methods combine both filter and wrapper methods. Initially filter method is applied to reduce the number of features and wrapper method is then applied in the reduced dataset to obtain the optimal feature subset. Thus it utilizes the advantages of both filter and wrapper methods. Depending upon the existence of label information in the dataset, FS algorithms are classified into (i) Supervised (ii) Unsupervised (iii) Semi-Supervised [6][7][8]. FS algorithm which works with labeled data is termed as Supervised Feature Selection. Supervised FS algorithms use the label information during the feature selection process for classification task. Numerous Supervised FS algorithms are available. Some of the supervised FS algorithms are Minimum Redundancy Maximum Relevance (mRmR) [9], Fast Correlation-based Filter (FCBF) [10] and ReliefF [11]. Unsupervised FS algorithm does not depend on class information for FS process, during clustering tasks. Unsupervised Feature Selection using Feature Similarity measure (FSFS) [12], Laplacian Score for Feature Selection (LSFS) [13], Spectral analysis based feature selection [14], Multi-Cluster Feature Selection (MCFS) [15], Variance Score [16] are the examples of Unsupervised FS algorithms. Unsupervised FS is a challenging task when compared with supervised. With the help of label information , supervised algorithms perform better than unsupervised algorithms [17]. Z.Zhao and H.Liu proposed a framework which unifies both supervised (ReliefF) and unsupervised (Laplacian Score) feature selection algorithms [17] for supervised and unsupervised learning. Many researches have been done on both supervised and unsupervised feature selection separately. As a result, there are a numerous supervised and unsupervised FS algorithms. In this work, we develop a new unified framework which works for labeled as well as unlabelled datasets. Supervised algorithms find the relevant features by assessing the correlation between features and the target classes, whereas unsupervised algorithms finds out the important features on the basis of innate structures of the data[17]. It will be a challenging task to find a common framework for both supervised and unsupervised feature selection processThe remaining part of the paper is organized as follows. The Laplacian score algorithm and Distance Correlation are discussed in detail in Section 2. In Section 3, the proposed algorithm is discussed in detail. In Section 4, the experimental results are reported. Section 5 concludes this paper.
————————————————
K.Sutha ,Research Scholar, Bharathiar University, Coimbatore, India E-mail: [email protected]
Dr.J.Jebamalar Tamilselvi, Professor, Department of MCA, Jaya Engineering College, Chennai, TamilNadu, India,
1469
2.
BACKGROUND STUDY
2.1 Laplacian Score
Laplacian Score (LS) [13] is a filter method. LS is calculated for all the features in the dataset, LS of each feature reveals its locality preserving power. LS algorithm constructs a nearest neighbor graph to model the local geometric structure. X. He. et al state that a feature is good if and only if its two data points are connected with an edge and nearer to each other. It should minimize the below mentioned object function,
Lr =
Laplacian Score for rth feature is computed as ,
Where fr = [fr1, fr2, · · · , f r m]T , = fr - 1
D is the diagonal matrix Dii = ,
put Wgtij = , otherwise put Wgtji=0, where t is a constant, L = D – Wgt,
The feature with smaller Laplacian Score is a good feature. Feature with Lr value equal to 0 indicates that the feature is not useful and it does not contain expected information.
2.2 Distance Correlation
Szekely et al. introduced Distance Correlation (DC) [18] to measure the linear and non –linear relationship (dependency) between two random variables. DC is zero if and only if two random variables are independent. is the squared distance covariance[18][19] , defined as the weighted L2 distance between ,
w(t, s) = , are constants
where x , y , and are marginal characteristic or characteristics functions of x and y, fx,y is the joint characteristic function, and w(t, s) is a weight function. The squared distance correlation [18][19] is defined as
Where is equal to 0 if and only if both the variables are independent and satisfies the relation 0 ≤ ≤1. Szekely et al. [18] mentioned that the following are the equivalent statements.
(i) for any t ,s
(ii)
(iii)
(iv)
In this paper, we used Distance correlation to test the dependency between the variables rather than Pearson’s Correlation. Pearson’s Correlation can measure only linear dependency between random variables [20]. Distance Correlation [18] can measure both the linear and non –linear relationship dependency between two random variables.
3.
PROPOSED ALGORITHM
The literature survey motivated to develop a unified framework for supervised and unsupervised feature selection. The proposed framework combines Laplacian Score and Distance Correlation as shown in Fig. 1. In supervised feature Selection, all the features in the original dataset are ranked using Laplacian Score (LS). Features are sorted in ascending order of LS value. The feature subset with N number of features, which gives best clustering accuracy are selected as the important features, . The selected feature subset is then passed to
the second step. For all features in the , Distance Correlation is calculated between features and class. Sort the features in descending order of Dcor value. KNN classifier is used to measure the goodness of the feature subset. The feature subset which gives better classification accuracy is selected as the optimal feature subset.
Algorithm:
Input: Dataset (DS : {F1, F2,F3,……….,FN })with N number of features with or without label information.
λ – a predefined threshold value. Output: An optimal feature subset (Op List)
// Step 1: Calculate Lapalcian Score for all the features 1.begin
3. calculate LS for all features //Laplacian Score for all features in DS
4. end
// Feature with smallest LS is the important feature 5. Sort all the features Fi in ascending order of LS value 6. Select M features as
// Step 2 : Calculate Distance Correlation for all the features in .
// Distance correlation between features and target class DCora,c for supervised FS
// Distance correlation between features DCor a,b for unsupervised FS
7. for j= 1 to M do
8. calculate for all features in
9. if (DCor < = λ) 10. Add to
11. end
12. Sort in descending order of
value
13. Select best F no. of features as OPList 14. end
In unsupervised feature Selection, all the features in the original dataset are ranked using Laplacian Score (LS). Features are sorted in ascending order of LS value. The feature subset with N number of features, which gives best clustering accuracy are selected as the important features, . The selected feature subset is then passed to the second step. For all features in the , Distance Correlation is calculated between features. Sort the features in descending order of Dcor value. Kmeans clustering is used to measure the goodness of the feature subset. The feature subset which gives better classification accuracy is selected as the optimal feature subset.
4.
EMPIRICAL STUDY
4.1 Study on Supervised Feature Selection
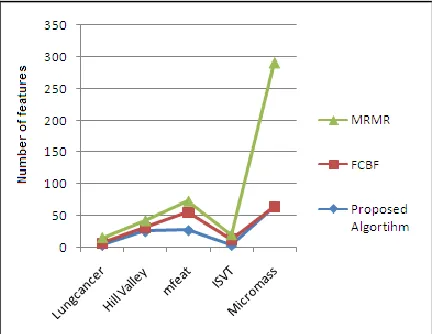
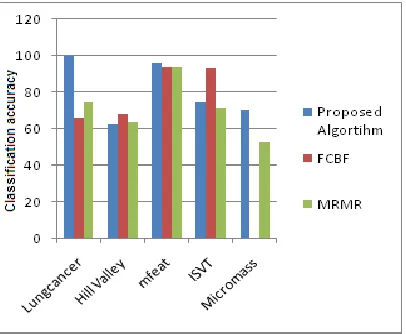
Experiment conducted on 5 UCI datasets with No. of features ranging from 56 to 1301, No. of instances ranging from 32 to2000 and No. of classes ranging from 2 to 20. It is listed in table 1. KNN classifier is used for evaluating the effectiveness of proposed algorithm. The performance of the proposed algorithm is compared with FCBF and MRMR algorithms. The proposed algorithm is evaluated in terms of classification accuracy and selected number of features. The number of features selected by proposed, FCBF and MRMR are listed in Table 2 and compared in Fig 2. Table 3 shows the classification accuracy of feature subset selected by proposed and other algorithms. Comparison of classification accuracy is shown in Fig 3. The experimental results listed in Table 2 shows that the proposed algorithm selects least number of features for most of the datasets comparing with other methods. From the results listed in Table 3, we came to know that the proposed algorithm outperforms FCBF in providing better classification accuracy for 3 datasets and FCBF outperforms 2 times but failed to handle larger datasets. All the experimental results show that the proposed algorithm is most effective than MRMR both in selecting
minimum number of features and in providing better classification accuracy.
Table 1: Summary of Datasets
Dataset No of Features
No of Instances
No of Classes
Lungcancer 56 32 3
Hill Valley 101 1212 2
Mfeat 217 2000 10
ISVT 311 126 2
Micromass 1301 571 20
Table 2: Number of features selected by proposed, FCBF and MRMR
DATASETS
Proposed
Algorithm FCBF MRMR
Lungcancer 3 4 8
Hill Valley 25 6 11
Mfeat 27 29 17
ISVT 3 10 7
Micromass 64 --- 227
Table 3: Classification accuracy given by proposed, FCBF and MRMR
DATASETS
Proposed
Algortihm FCBF MRMR
Lungcancer 100 66 75
Hill Valley 62.8 68.1 63.9
Mfeat 96.5 94 94
ISVT 75 92.9 71.42
Micromass 70.68 --- 53
Figure 2: Comparison of no. of features selected by proposed ,FCBF and MRMR
1471 4.2 Study on Unsupervised Feature Selection
For Unsupervised feature selection, experiment is conducted on 7 UCI datasets, listed in table 4, having No. of features ranging from 36 to 4703, No. of instances ranging from 32 to 2600 and No. of classes ranging from 2 to 100. Kmeans Clustering is used. The efficiency and effectiveness of the proposed algorithm is compared with Laplacian Score algorithm. Table 5 shows the number of features selected by proposed and LS algorithm and compared in Fig. 4. Results listed in Table 5 shows that the proposed algorithm selects minimum number of features than Laplacian Score algorithm. Table 6 and Fig 5 shows that the proposed algorithm provides better accuracy compared with Laplacian Score.
Table 4: Summary of Datasets
Datasets Features Instances Class One Hundred Plant
Shape 65 1600 100
Dbworld Bodies 4703 64 2
Lungcancer 56 32 3
Madelon 501 2600 2
Hillvalley 101 1212 2
Cardiotocography 36 2126 10
Mfeat 217 2000 10
Table 5: Number of features selected by proposed and Laplacian Score algorithm
Datasets
No. of features in
original
dataset Pro
p
o
s
e
d
A
lgo
rit
h
m
L
a
p
lac
ian
S
c
o
re
One Hundred Plant
Shape 65 50 58
Dbworld Bodies 4703 275 579
Lungcancer 56 21 33
Madelon 501 48 81
Hillvalley 101 6 99
Cardiotocography 36 17 18
Mfeat 217 51 59
Table 6: Accuracy given by proposed and Laplacian Score algorithm
Datasets Proposed Laplacian
One Hundred Plant
Shape 40.44 40.37
Dbworld Bodies 90.46 90.31 Lungcancer 69.2 56.71 Madelon 61.97 61.85 Hillvalley 50.96 50.66 Cardiotocography 41.09 36.07
Mfeat 70.01 66.28
Figure 4: Comparison of Number of features selected by proposed and Laplacian Score algorithm
Figure 5:Comparison of accuracy given by proposed and Laplacian Score algorithm
The above experimental results shows that the proposed unified framework works well for both supervised and unsupervised feature selection process.
5. CONCLUSION
both labeled and unlabeled dataset. Experimental results reveal that the combination of Laplacian Score and Distance Correlation has given better results in most of the cases. This paper shows that the other existing popular feature selection algorithms can be combined to form a new effective common framework for supervised and unsupervised feature selection.
REFERENCES
[1] T.Hastie, R. Tibshirani and J.Friedman, ―The Elements of Statistical Learning‖, Springer, 2001.
[2] H.Liu, L.Yu, ―Towards Integrating Feature Selection Algorithms for Classification and Clustering‖, IEEE, Vol 17, No.4, 2005
[3] L.C. Molina, L.Belanche, and A.Nebot, ―Feature Selection Algorithms: A Survey and Experimental Evaluation‖, proc. IEEE Int’l Conf. Data Mining, pp 306-313,2002 [4] Q.Song, J.Ni and G.Wong, ―A Fast Clustering – Based
Feature Subset Selection Algorithm for High- Dimensional Data‖, IEEE, Vol 25, No.1, 2013 [5] M Dash and H.Liu, ―Feature Selection for Classification‖,
Intell. Data Analysis, vol 1, pp 131 -156, 1997. [6] J. Weston, A. Elisseff, B. Schoelkopf, and M. Tipping,
―Use of the zero norm with linear models and kernel methods‖, J. Mach. Learning Research, 3:1439–1461, 2003.
[7] J.G. Dy and C.E. Brodley. ―Feature selection for unsupervised learning‖. J. Mach. Learning Research, 5:845–889, 2004.
[8] Z. Zhao and H. Liu, ―Semi-supervised feature selection via spectral analysis‖, In Proc. of SIAM Int’l Conf. on Data Mining, 2007
[9] C. H. Q. Ding and H. Peng, ―Minimum redundancy feature selection from microarray gene expression data‖, In CSB, pages 523-529. IEEE, 2003.
[10] L Yu, H Liu, ―Feature Selection for High-Dimensional Data:A Fast Correlation-Based Filter Solution‖, Dept of Comp. Sci.& Eng. AZ 85287-5406, USA.
[11] I.Kononenko, ―Estimating attributes: Analysis and extension of RELIEF‖, Proc.of the European Conf. on Machine Learning, pages 171-182,1994. [12] .Mitra, P., C. A. Murthy, S. K. Pal. ―Unsupervised Feature Selection Using Feature Similarity‖, IEEE, Vol. 24, March 2002, No 3, pp. 301-312. [13] X He, D Cai, P Niyogi, ―Laplacian score for feature
selection‖, Adv. in Neural Information Processing Sys., vol. 17, 2005.
[14] Zhao Z., H. Liu. ―Spectral Feature Selection for Supervised and Unsupervised Learning‖, (ICML’07), 2007, pp. 1151-1157.
[15] Cai, D., C. Zhang, X. He, ―Unsupervised Feature Selection for Multi-Cluster Data‖. In: Proc. of 16th
Int’l
Conf. on KDD’10, 2010, p. 333. [16] Bishop, C. M. ―Neural Networks for Pattern Recognition‖.
Clarendon Press, 1995.
[17] Z.Zhao, H.Liu, ―Spectral Feature Selection for Supervised and Unsupervised Learning‖, Proc. Int’l Conf. on Machine Learning, 2007
[18] G. J. Szekely, M. L. Rizzo, N. K. Bakirov, ―Measuring and testing independence by correlation of distances‖, Annals of Statistics,2007, 35 (6):Pg. No: 2769–2794.
[19] A Chaudhuri, W Hu,‖ A fast algorithm for computing Distance Correlation‖,IoT,2018