Comparison of Normal and Pre-Eclamptic
Placental Gene Expression: A Systematic
Review with Meta-Analysis
O. Brew
1☯*
, M. H. F. Sullivan
2☯, A. Woodman
3☯1University of West London, Brentford, Middlesex, United Kingdom,2Institute of Reproductive & Developmental Biology, Imperial College London, Hammersmith Hospital Campus, London, United Kingdom,3University of West London, Ealing, London, United Kingdom
☯These authors contributed equally to this work.
Abstract
Pre-eclampsia (PE) is a serious multi-factorial disorder of human pregnancy. It is associated
with changes in the expression of placental genes. Recent transcription profiling of placental
genes with microarray analyses have offered better opportunities to define the molecular
pathology of this disorder. However, the extent to which placental gene expression changes
in PE is not fully understood. We conducted a systematic review of published PE and normal
pregnancy (NP) control placental RNA microarrays to describe the similarities and differences
between NP and PE placental gene expression, and examined how these differences could
contribute to the molecular pathology of the disease. A total of 167 microarray samples were
available for meta-analysis. We found the expression pattern of one group of genes was the
same in PE and NP. The review also identified a set of genes (PE unique genes) including a
subset, that were significantly (p
<
0.05) down-regulated in pre-eclamptic placentae only.
Using class prediction analysis, we further identified the expression of 88 genes that were
highly associated with PE (p
<
0.05), 10 of which (LEP, HTRA4, SPAG4, LHB, TREM1,
FSTL3, CGB, INHA, PROCR, and LTF) were significant at p
<
0.001. Our review also
sug-gested that about 30% of genes currently being investigated as possibly of importance in PE
placenta were not consistently and significantly affected in the PE placentae. We recommend
further work to confirm the roles of the PE unique and associated genes, currently not being
investigated in the molecular pathology of the disease.
Introduction
Pre-eclampsia (PE), a major cause of perinatal mortality complicates up to 8% of all
pregnan-cies in Western countries [
1
–
3
]. It is one of the top 4 causes of maternal mortality and
morbid-ity worldwide, causing 10 to 15% of maternal deaths [
2
–
4
]. PE is characterised by new
hypertension (blood pressure of
140/90 mmHg) on two separate readings at least 6 hours
apart presenting after 20 weeks' gestation in conjunction with clinically relevant proteinuria
(300mg) per 24 hours [
5
].
a11111
OPEN ACCESS
Citation:Brew O, Sullivan MHF, Woodman A (2016) Comparison of Normal and Pre-Eclamptic Placental Gene Expression: A Systematic Review with Meta-Analysis. PLoS ONE 11(8): e0161504. doi:10.1371/ journal.pone.0161504
Editor:Irina Polejaeva, Utah State University, UNITED STATES
Received:March 9, 2016
Accepted:August 5, 2016
Published:August 25, 2016
Copyright:© 2016 Brew et al. This is an open access article distributed under the terms of the
Creative Commons Attribution License, which permits unrestricted use, distribution, and reproduction in any medium, provided the original author and source are credited.
Data Availability Statement:All relevant data including GEO accession numbers for the expression microarrays used in the meta-analysis are within the paper and its Supporting Information files.
Funding:The authors have no support or funding to report.
PE is a multifactorial disease, and while there is a cautious acceptance of links between
familial concordance and maternal polymorphism in the pathogenesis of the disease [
6
–
13
],
the placenta is suggested as the primary cause of PE [
14
,
15
], Nonetheless, there is a degree of
uncertainty, especially about the roles of gene regulation and expression in the molecular
path-ogenesis of the disease. Expectedly, knowledge on placental gene expression is advancing [
16
–
18
]. And while recent meta-analysis of Relative Gene Expression (RGE) in NP and PE
placen-tae have linked the changes in specific genes in the placenta to PE [
13
,
19
], these studies have
often focused on identifying genes that are either highly up-regulated or down-regulated
between the case and control matched samples. Traditionally, this approach is suggested as
highly suitable for candidate gene discovery or class prediction studies [
20
–
22
]. However, this
methodology is lately suggested as less sensitive for microarray studies that seek to account for
variability in gene expression across sample within same class or to map the molecular
pathol-ogy of a disease from 'noisy' data sets [
23
–
26
]. We therefore examined whether RGE analysis
would identify same PE genes as Absolute Gene Expression (AGE) analysis, and also to
deter-mine the functional roles of gene sets or families that are equally expressed at high or low levels
in both NP and PE placentae.
Therefore, in this study we provide evidence that AGE analyses identify gene sets whose
combined expression patterns could uniquely characterise biological and functional phenotype
for PE placentae. We further provide evidence for putative inter-relationships and contributory
roles of equally low or high level expressed genes in the molecular pathology of PE.
Materials and Methods
Study selection
Public data repositories Gene Expression Omnibus (GEO) and ArrayExpress Archive were
sys-tematically searched in accordance with PRISMA and MIAME in December 2014, and
repeated in June 2015. No time limit for data publication was set. Search terms used were NP
placenta, PE and Term placenta explant. Study series with no report on placental tissue but
other tissues such as Chorionic villous tissue, Decidua, Trophoblast cell lines and Basement
membrane were excluded. Similarly, study series with no matched control group; control
group composed of pregnancies complicated by small for gestational age fetuses; gestational
diabetes, Non-homo sapiens control; and Non-term placentae were excluded. Also, duplicate
samples; Methylation profiling array; Protein profiling array; Long non-coding RNAs (long
ncRNAs, lncRNA); and all complications of human pregnancy other than PE were excluded.
Array Processing and Quality Control
Data for each sample included were downloaded from GEO (or from ArrayExpress if not
avail-able in GEO). The series data were prepared according to INMEX [
27
] requirement for
meta-analysis, and exported into INMEX. Probe IDs from the different platforms were re-annotated
in INMEX using the November, 2012 annotation information obtained from the NCBI
Gen-Bank and Bioconductor into Entrez gene IDs. Multiple probes mapping to the same gene were
presented as an average for combined probes and thence referred to as genes.
Finding Significantly Expressed Genes in Pre-eclampsia
Significantly expressed gene was defined as a gene that shows consistent stronger aggregated
dif-ferential expression (DE) profile across the multiple datasets [
24
,
27
]. Therefore the DE genes
were identified by combining P-values from the multiple studies using Fisher's method (-2
∑Log
(p)) (p
<
0.05) for Relative expressions or RankProduct analysis for Absolute expressions.
RankProduct analysis, a non-parametric statistic [
24
], was used to identify genes that were
consistently up-regulated or down-regulated in PE or NP placentae. The RankProduct analysis
combined the gene rank from the different arrays together instead of using actual expression
data to select genes that were consistently ranked high or low [
24
,
26
]. The product ranks from
all samples were then calculated as the test statistic in100X permutations with False Discovery
Rate (FDR) Confidence at 1
–
alpha = 95.0%. Genes with consistently high ranks (smaller rank
product) across the different microarrays were classified as up-regulated. Genes with
consis-tently low ranks (larger rank products) across the different arrays at the stated FDR were
classi-fied as down-regulated, whereas genes with inconsistent rank product across the different
studies were classified as non-significant [
28
].
Gene-Disease Association Analysis
Gene-Disease Association analysis was performed to identify genes whose expression could be
associated with PE placentae [
29
]. Using BRBArray Tools five prediction methods were
per-formed: Compound covariate predictor, Diagonal linear discriminant analysis, K-nearest
neighbours (for K = 1 and 3), Nearest Centroid, and Support vector machines. With a fixed
internal random seed, genes were selected using a combination of univariate F-test (p
<
0.05),
and Leave-one-out cross-validation at 100 permutations, and further evaluated with ROC
curve analysis.
Functional Role Assignment
Biological relevance of the differentially expressed genes was determined using gene
enrich-ment analysis programmes in WebGestalt [
30
]. Briefly, Kyoto Encyclopedia of Genes and
Genomes (KEGG) Homo sapiens genome pathways database [
31
] was probed with the
differ-entially expressed genes to identify statistically enriched pathways. The Benjamini & Hochberg
(BH) hypergeometric test [
32
] was used for all enrichment evaluation analyses, with adjusted p
values based on R function p.adjust.
Results
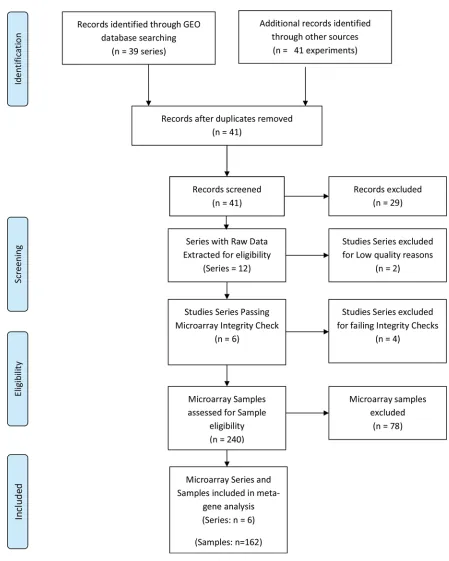
Following the systematic search, a total of 41 microarray study series were identified (
Fig 1
).
Twelve of the study series met the inclusion criteria, and 29 series (
S1 Table
) were excluded
based on the eligibility criteria. Of the 12 series that met the eligibility criteria, 6 series (GSE
30186, GSE25906, GSE35574, GSE43942, GSE4707, GSE47187) (
Table 1
) passed the quality
and integrity checks. The remaining six failed the INMEX microarray quality and integrity
assessments and were further excluded (
S2 Table
). Altogether 167 samples, consisting of 68 PE
and 99 NP met the sample inclusion criteria for the meta-analysis. A total of 16701 genes
passed filtering criteria.
Patterns of Gene Expression in NP and PE Placentae
AGE analysis for NP and PE placental genes.
RankProd meta-analysis was used to
iden-tify AGE in NP or PE (
Table 2
). Significant AGE was defined as genes whose product of
expres-sion were persistently ranked as positively (up) or negatively (down)-regulated across all PE
Fig 1. PRISMA flow chart of NP and PE Gene Expression Systematic Review.
only or NP only placentae, at a given false discovery rate (FDR
<
0.05). Data output was
expressed as rank product of mean expression levels. For NP, a total of 1922 genes were
identi-fied as consistently significant (FDR
<
0.05). Of these, 846 genes were negatively regulated and
1076 were positively regulated (
Table 2
). The expression levels of 14779 genes in NP placentae
were inconsistent and were classified as non-significant. In contrast, the expression of 9540
genes in PE placentae was consistent and significant (FDR
<
0.05) (
Table 2
). Of these, 5146
(54%) genes were significantly down-regulated and 4394 (46%) genes were up-regulated in the
PE placentae. The expression levels of 7161 genes in PE placentae were inconsistent and thus
were classified as non-significant (
Table 2
).
RGE analysis for PE placental genes.
RGE was defined as the relative quantitation of the
differences in the expression level of a gene between the PE and NP placental samples [
27
]. The
data output was expressed as a fold-change of expression levels in PE relative to NP. Using
fish-er
’
s method to combine p values, the expressions of 4349 genes were identified as significant in
PE (p
<
0.05), relative to NP (
Table 2
). Of these, 2197 (13%) genes were negatively regulated,
and 2152 (13%) were positively regulated (
Table 2
).
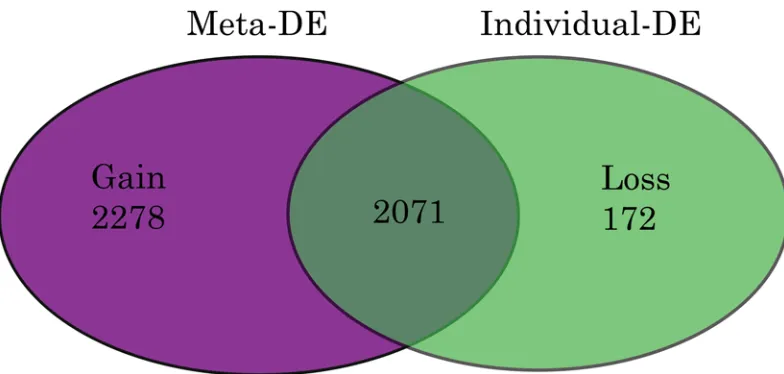
Fig 2
shows that 2071 of these genes were
differentially expressed across the study series before meta-analysis, and a further 2278 genes
were significant (p
<
0.05) only after meta-analysis. The expression of 172 other genes lost
sig-nificance after meta-analysis.
Trends in placental gene expression and PE unique genes.
Trends in the changes to PE
placental gene expression were determined by examining the relationships between PE and NP
Absolute and Relative gene sets. First, we compared the gene counts in the respective gene sets
from the Absolute PE and NP analyses.
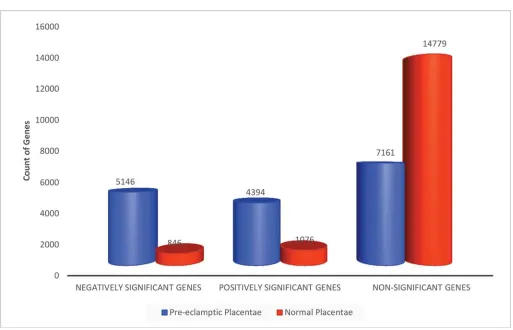
Fig 3
shows a 6 fold increase in the number of negative
significant genes in PE than in NP. Similarly, there was a 4 fold increase in positive significant
genes in PE than in NP (
Fig 3
). The proportion of non-significant genes in NP following AGE
was twice the concentration found in PE non-significant gene set.
Table 1. Profile of Microarray Series included in Pre-eclampsia Meta-gene Analysis.
GEO Accession Type Organism Assays included Platform Release Date
GSE47187 transcription profiling by array Homo sapiens 10 GPL14550 01/10/2013
GSE43942 transcription profiling by array Homo sapiens 12 GPL10191 01/02/2013
GSE30186 transcription profiling by array Homo sapiens 12 GPL10558 24/06/2011
GSE25906 transcription profiling by array Homo sapiens 60 GPL6102 10/12/2010
GSE4707 transcription profiling by array Homo sapiens 14 GPL1708 07/05/2008
GSE35574 transcription profiling by array Homo sapiens 59 (IUGR samples excluded) GPL6102 07/02/2012
doi:10.1371/journal.pone.0161504.t001
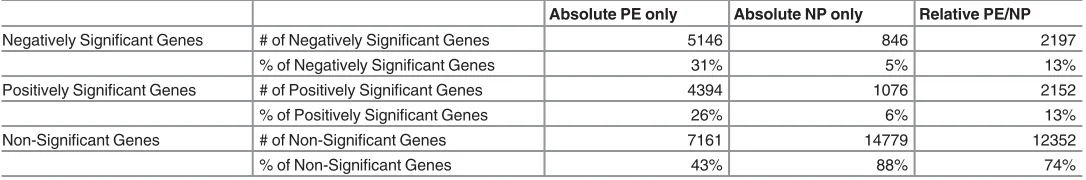
Table 2. Differentially Expressed Genes in NP and PE Placentae.
Absolute PE only Absolute NP only Relative PE/NP
Negatively Significant Genes #of Negatively Significant Genes 5146 846 2197
% of Negatively Significant Genes 31% 5% 13%
Positively Significant Genes #of Positively Significant Genes 4394 1076 2152
% of Positively Significant Genes 26% 6% 13%
Non-Significant Genes #of Non-Significant Genes 7161 14779 12352
% of Non-Significant Genes 43% 88% 74%
A total of 167 microarray samples (PE = 68; NP = 99) were meta-analysed as case-to-control matched samples with Fisher’s method or as case (PE) only and control (NP) only with RankProd analysis. About 31% more genes were identified as differentially expressed (DE) in PE only than in case matched baseline (NP) subtraction PE. RankProd analysis Confidence at (1—alpha): 95.0%; False Significant Proportion: 0.05 or less; p value threshold forfisher’s metaP = 0.05. PE = Pre-eclampsia Placentae; NP = Normal Placentae.
Interestingly, while the proportions of genes identified as positive or negative significant
from RGE were twice less than those identified from AGE (
Table 2
), the number of the Relative
PE non-significant genes was similar to the Absolute NP non-significant genes. We therefore
examined further, whether there was any relationship between the Absolute NP
non-signifi-cant genes, Absolute PE signifinon-signifi-cant and Relative PE signifinon-signifi-cant genes.
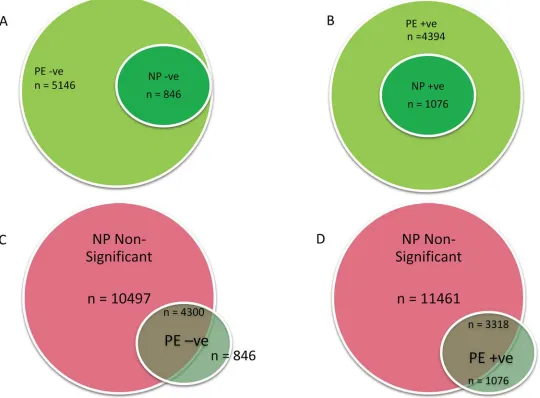
Using BioVenn [
33
] we identified four sets of genes. First, the comparison of the PE and NP
Absolute genes (
Fig 4A & 4B
) showed 2 sets of down-regulated gene: (1) a set of genes that
were significantly (p
<
0.05) down-regulated in both NP and PE (n = 846;
Fig 4A
;
S4 Table
);
(2) a second set of genes that were significantly (p
<
0.05) down-regulated only in PE placentae
(n = 4300; p
<
0.05;
S5 Table
). The third set of genes consisted of a group of 1076 genes
signifi-cantly (p
<
0.05) up-regulated in both NP and PE (
S6 Table
). The fourth set was a group of
3318 genes, that were significantly (p
<
0.05) up-regulated only in PE (
S7 Table
).
Further comparison of the PE negative and positive significant gene sets with NP
non-sig-nificant gene sub-group showed that all the PE unique genes were not signon-sig-nificantly regulated in
NP placenta (
Fig 4C & 4D
). Altogether, there were 7618 more significantly regulated genes in
PE than were in NP at the FDR Confidence of 1
–alpha = 95.0%.
Links between Relative and Absolute PE Significant Genes
We further examined the relationship between the PE significant Relative and Absolute genes.
All 4394 PE Absolute positive (up-regulated) significant genes were compared with the 2152
PE Relative positive significant genes. We expected all Relative PE genes to be identified amidst
the Absolute PE gene sets. However, only 79% (n = 1688) of the Relative positive significant
genes were identified in the PE Absolute positive genes. A much smaller number (24%,
n = 524) of the total PE Relative negative (down-regulated) significant genes (n = 2197) were
identified in the Absolute PE negative significant genes. Overall, only 51% of the Relative
sig-nificant genes were identified in the Absolute gene sets, with majority localised within the
posi-tive significant gene set. Further examination showed that the expression signals of the
Fig 2. Venn Diagram of Differentially Expressed Genes in Pre-eclampsia.Fig shows differentially expressed (DE) genes in PE. Meta-analysis of‘p’values was performed using Fishers method. MetaDE = differentially expressed genes following metaP-analysis. Gain = DE gene only found in meta-analysis result but not in any individual analysis. Loss = DE genes identified in any individual analysis, but not in the meta-analysis. Gain and Loss genes were calculated by comparing DE genes identified by meta-analysis to those from analysing individual datasets.
significant Relative genes unmatched to Absolute genes were previously classified as
inconsis-tent and non-significant by the AGE analysis. In contrast, the Absolute genes not matched to
Relative genes typically showed low level expression profile or were similarly expressed in both
NP and PE placentae.
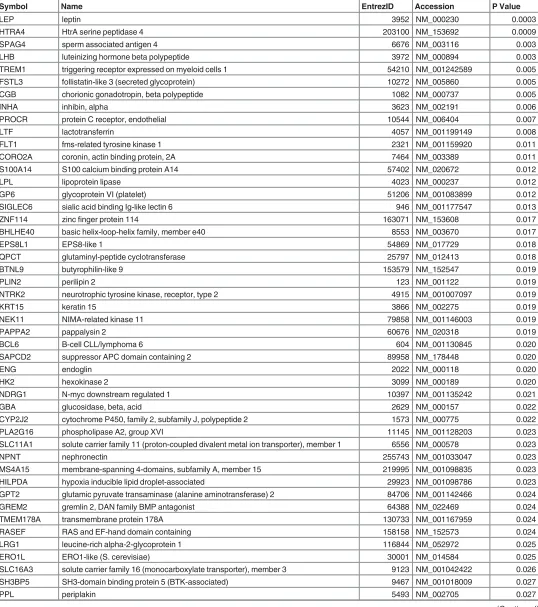
PE Placental Associated (PPA) Genes and Current Research
We tested the hypothesis that NP and PE placental gene expression profiles do not differ, and
that a prediction analysis would not discriminate between the NP and PE genes but only pick
up the random noise in the data set. To examine this, all 16701 genes from 99 NP placentae
and 68 PE placental microarrays samples were tested and the expression of 88 genes (
Table 3
)
was significantly (p
<
0.05) associated with PE placentae (Pre-eclamptic Placenta Associated,
PPA).
A ROC evaluation of the prediction accuracy was performed by plotting the sensitivity
against 1–
specificity for each result value of the test with tools available in BRBArray Tools.
Three prediction algorithms were used to generate the ROC, including compound covariate
predictor (CCP), diagonal linear discriminant analysis (DLDA), and Bayesian compound
covariate predictor (BCCP). The analysis yielded a very modest but comparable ROC (Fig not
shown) for all three algorithms with AUC of (0.226 (CCP), 0.246 (DLDA), 0.227 (BCCP)).
Fig 3. Absolute Gene Expression in Normal and Pre-eclamptic Placentae.Counts of genes significantly regulated in PE and NP placentae. Gene ratios for PE:NP are 6:1, 4:1 and 1:2 respectively for negatively significant, positively significant and non-significant genes. Genes identified with Rankprod statistics in100X permutations (FDR Confidence at 1–alpha = 95.0%).
Nonetheless, the association of 10 genes (LEP, HTRA4, SPAG4, LHB, TREM1, FSTL3, CGB,
INHA, PROCR, and LTF) with PE placentae was highly consistent and significant at p
<
0.001
(
Table 3
).
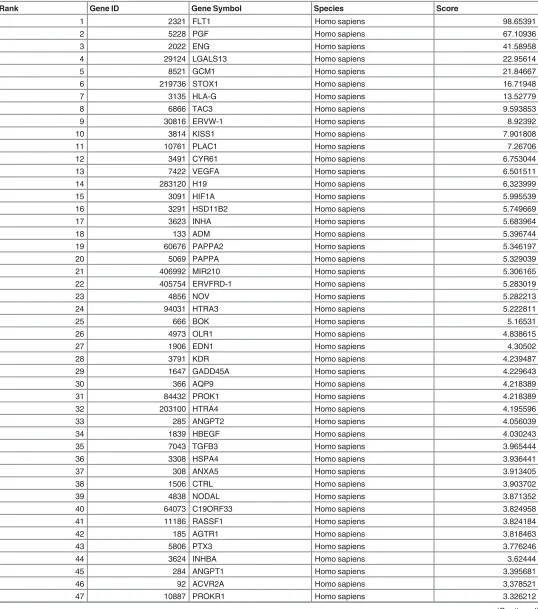
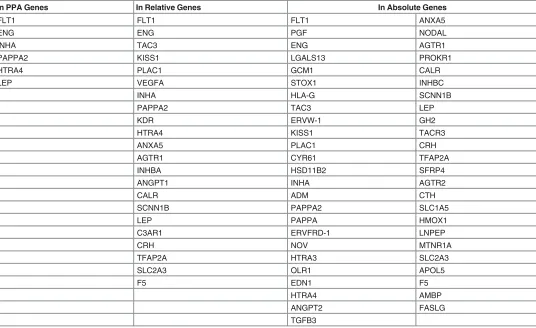
We further evaluated the currency of gene-to-publication ranks of these PPA genes by
prob-ing the scientific literature with GLAD4U (Gene List Automatically Derived For You, [
34
]).
The search retrieved 6,288 publications, of which 642 contained information on 493 genes
related to PE placenta. After ranking, 76 genes were significant (p
<
0.01) and prioritised as
highly relevant to PE placenta (
Table 4
). The overlap between GLAD4U genes and PPA genes
showed that only 6 of the latter genes (FLT1, ENG, INHA, LEP, PAPPA2, and HTRA4) were
scored as significant and highly relevant from GLAD4U. Interestingly, 3 of these genes (LEP,
HTRA4, INHA) also appeared in the top 10 of the PPA genes (
Table 3
). Similarly, fewer than
expected GLAD4U genes (
Table 5
) were respectively identified in the PE Relative genes (22
Fig 4. Relation between NP and PE Placental Gene Expression.Significantly down-regulated (a) or up-regulated (b) genes in PE were compared with down (n = 864) or up-regulated (n = 1076) genes in NP respectively. All genes significantly up or down regulated in NP were respectively regulated in PE. In c & d, non-significantly differentiated genes in NP were compared with PE up or down-regulated. PE = pre-eclamptic placenta; NP = normal placenta; -ve = down-regulated; +ve = up-regulated
Table 3. Pre-eclamptic Placental Associated Genes.
Symbol Name EntrezID Accession P Value
LEP leptin 3952 NM_000230 0.0003
HTRA4 HtrA serine peptidase 4 203100 NM_153692 0.0009
SPAG4 sperm associated antigen 4 6676 NM_003116 0.003
LHB luteinizing hormone beta polypeptide 3972 NM_000894 0.003
TREM1 triggering receptor expressed on myeloid cells 1 54210 NM_001242589 0.005
FSTL3 follistatin-like 3 (secreted glycoprotein) 10272 NM_005860 0.005
CGB chorionic gonadotropin, beta polypeptide 1082 NM_000737 0.005
INHA inhibin, alpha 3623 NM_002191 0.006
PROCR protein C receptor, endothelial 10544 NM_006404 0.007
LTF lactotransferrin 4057 NM_001199149 0.008
FLT1 fms-related tyrosine kinase 1 2321 NM_001159920 0.011
CORO2A coronin, actin binding protein, 2A 7464 NM_003389 0.011
S100A14 S100 calcium binding protein A14 57402 NM_020672 0.012
LPL lipoprotein lipase 4023 NM_000237 0.012
GP6 glycoprotein VI (platelet) 51206 NM_001083899 0.012
SIGLEC6 sialic acid binding Ig-like lectin 6 946 NM_001177547 0.013
ZNF114 zincfinger protein 114 163071 NM_153608 0.017
BHLHE40 basic helix-loop-helix family, member e40 8553 NM_003670 0.017
EPS8L1 EPS8-like 1 54869 NM_017729 0.018
QPCT glutaminyl-peptide cyclotransferase 25797 NM_012413 0.018
BTNL9 butyrophilin-like 9 153579 NM_152547 0.019
PLIN2 perilipin 2 123 NM_001122 0.019
NTRK2 neurotrophic tyrosine kinase, receptor, type 2 4915 NM_001007097 0.019
KRT15 keratin 15 3866 NM_002275 0.019
NEK11 NIMA-related kinase 11 79858 NM_001146003 0.019
PAPPA2 pappalysin 2 60676 NM_020318 0.019
BCL6 B-cell CLL/lymphoma 6 604 NM_001130845 0.020
SAPCD2 suppressor APC domain containing 2 89958 NM_178448 0.020
ENG endoglin 2022 NM_000118 0.020
HK2 hexokinase 2 3099 NM_000189 0.020
NDRG1 N-myc downstream regulated 1 10397 NM_001135242 0.021
GBA glucosidase, beta, acid 2629 NM_000157 0.022
CYP2J2 cytochrome P450, family 2, subfamily J, polypeptide 2 1573 NM_000775 0.022
PLA2G16 phospholipase A2, group XVI 11145 NM_001128203 0.023
SLC11A1 solute carrier family 11 (proton-coupled divalent metal ion transporter), member 1 6556 NM_000578 0.023
NPNT nephronectin 255743 NM_001033047 0.023
MS4A15 membrane-spanning 4-domains, subfamily A, member 15 219995 NM_001098835 0.023
HILPDA hypoxia inducible lipid droplet-associated 29923 NM_001098786 0.023
GPT2 glutamic pyruvate transaminase (alanine aminotransferase) 2 84706 NM_001142466 0.024
GREM2 gremlin 2, DAN family BMP antagonist 64388 NM_022469 0.024
TMEM178A transmembrane protein 178A 130733 NM_001167959 0.024
RASEF RAS and EF-hand domain containing 158158 NM_152573 0.024
LRG1 leucine-rich alpha-2-glycoprotein 1 116844 NM_052972 0.025
ERO1L ERO1-like (S. cerevisiae) 30001 NM_014584 0.025
SLC16A3 solute carrier family 16 (monocarboxylate transporter), member 3 9123 NM_001042422 0.026
SH3BP5 SH3-domain binding protein 5 (BTK-associated) 9467 NM_001018009 0.027
PPL periplakin 5493 NM_002705 0.027
genes), and PE Absolute genes (49 genes). Collectively, about 36% of genes identified from
lit-erature as highly relevant for PE placenta could not be confirmed as significant or consistently
expressed in PE placentae following a large scale microarray meta-analysis.
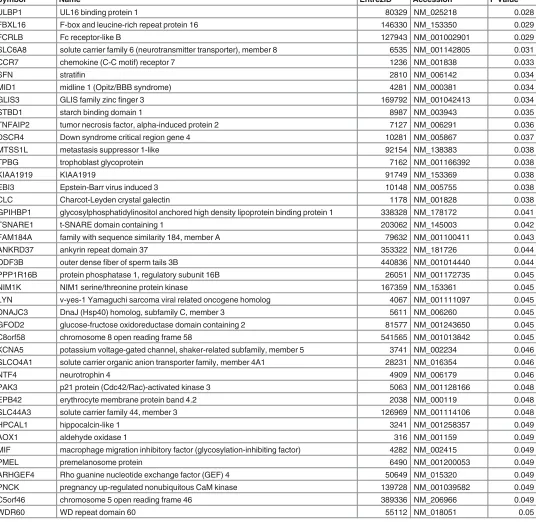
Table 3.(Continued)
Symbol Name EntrezID Accession P Value
ULBP1 UL16 binding protein 1 80329 NM_025218 0.028
FBXL16 F-box and leucine-rich repeat protein 16 146330 NM_153350 0.029
FCRLB Fc receptor-like B 127943 NM_001002901 0.029
SLC6A8 solute carrier family 6 (neurotransmitter transporter), member 8 6535 NM_001142805 0.031
CCR7 chemokine (C-C motif) receptor 7 1236 NM_001838 0.033
SFN stratifin 2810 NM_006142 0.034
MID1 midline 1 (Opitz/BBB syndrome) 4281 NM_000381 0.034
GLIS3 GLIS family zincfinger 3 169792 NM_001042413 0.034
STBD1 starch binding domain 1 8987 NM_003943 0.035
TNFAIP2 tumor necrosis factor, alpha-induced protein 2 7127 NM_006291 0.036
DSCR4 Down syndrome critical region gene 4 10281 NM_005867 0.037
MTSS1L metastasis suppressor 1-like 92154 NM_138383 0.038
TPBG trophoblast glycoprotein 7162 NM_001166392 0.038
KIAA1919 KIAA1919 91749 NM_153369 0.038
EBI3 Epstein-Barr virus induced 3 10148 NM_005755 0.038
CLC Charcot-Leyden crystal galectin 1178 NM_001828 0.038
GPIHBP1 glycosylphosphatidylinositol anchored high density lipoprotein binding protein 1 338328 NM_178172 0.041
TSNARE1 t-SNARE domain containing 1 203062 NM_145003 0.042
FAM184A family with sequence similarity 184, member A 79632 NM_001100411 0.043
ANKRD37 ankyrin repeat domain 37 353322 NM_181726 0.044
ODF3B outer densefiber of sperm tails 3B 440836 NM_001014440 0.044
PPP1R16B protein phosphatase 1, regulatory subunit 16B 26051 NM_001172735 0.045
NIM1K NIM1 serine/threonine protein kinase 167359 NM_153361 0.045
LYN v-yes-1 Yamaguchi sarcoma viral related oncogene homolog 4067 NM_001111097 0.045
DNAJC3 DnaJ (Hsp40) homolog, subfamily C, member 3 5611 NM_006260 0.045
GFOD2 glucose-fructose oxidoreductase domain containing 2 81577 NM_001243650 0.045
C8orf58 chromosome 8 open reading frame 58 541565 NM_001013842 0.045
KCNA5 potassium voltage-gated channel, shaker-related subfamily, member 5 3741 NM_002234 0.046
SLCO4A1 solute carrier organic anion transporter family, member 4A1 28231 NM_016354 0.046
NTF4 neurotrophin 4 4909 NM_006179 0.046
PAK3 p21 protein (Cdc42/Rac)-activated kinase 3 5063 NM_001128166 0.048
EPB42 erythrocyte membrane protein band 4.2 2038 NM_000119 0.048
SLC44A3 solute carrier family 44, member 3 126969 NM_001114106 0.048
HPCAL1 hippocalcin-like 1 3241 NM_001258357 0.049
AOX1 aldehyde oxidase 1 316 NM_001159 0.049
MIF macrophage migration inhibitory factor (glycosylation-inhibiting factor) 4282 NM_002415 0.049
PMEL premelanosome protein 6490 NM_001200053 0.049
ARHGEF4 Rho guanine nucleotide exchange factor (GEF) 4 50649 NM_015320 0.049
PNCK pregnancy up-regulated nonubiquitous CaM kinase 139728 NM_001039582 0.049
C5orf46 chromosome 5 open reading frame 46 389336 NM_206966 0.049
WDR60 WD repeat domain 60 55112 NM_018051 0.05
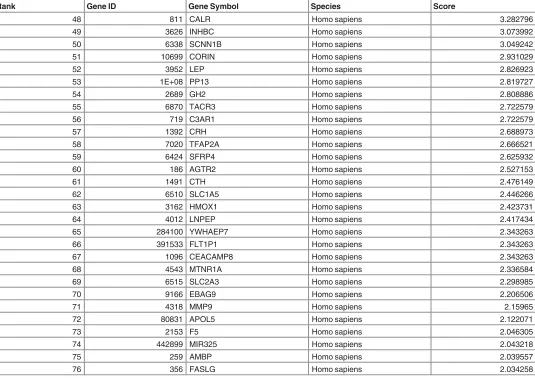
Table 4. Highly Relevant Pre-eclamptic Placentae Genes from GLAD4U.
Rank Gene ID Gene Symbol Species Score
1 2321 FLT1 Homo sapiens 98.65391
2 5228 PGF Homo sapiens 67.10936
3 2022 ENG Homo sapiens 41.58958
4 29124 LGALS13 Homo sapiens 22.95614
5 8521 GCM1 Homo sapiens 21.84667
6 219736 STOX1 Homo sapiens 16.71948
7 3135 HLA-G Homo sapiens 13.52779
8 6866 TAC3 Homo sapiens 9.593853
9 30816 ERVW-1 Homo sapiens 8.92392
10 3814 KISS1 Homo sapiens 7.901808
11 10761 PLAC1 Homo sapiens 7.26706
12 3491 CYR61 Homo sapiens 6.753044
13 7422 VEGFA Homo sapiens 6.501511
14 283120 H19 Homo sapiens 6.323999
15 3091 HIF1A Homo sapiens 5.995539
16 3291 HSD11B2 Homo sapiens 5.749669
17 3623 INHA Homo sapiens 5.683964
18 133 ADM Homo sapiens 5.396744
19 60676 PAPPA2 Homo sapiens 5.346197
20 5069 PAPPA Homo sapiens 5.329039
21 406992 MIR210 Homo sapiens 5.306165
22 405754 ERVFRD-1 Homo sapiens 5.283019
23 4856 NOV Homo sapiens 5.282213
24 94031 HTRA3 Homo sapiens 5.222811
25 666 BOK Homo sapiens 5.16531
26 4973 OLR1 Homo sapiens 4.838615
27 1906 EDN1 Homo sapiens 4.30502
28 3791 KDR Homo sapiens 4.239487
29 1647 GADD45A Homo sapiens 4.229643
30 366 AQP9 Homo sapiens 4.218389
31 84432 PROK1 Homo sapiens 4.218389
32 203100 HTRA4 Homo sapiens 4.195596
33 285 ANGPT2 Homo sapiens 4.056039
34 1839 HBEGF Homo sapiens 4.030243
35 7043 TGFB3 Homo sapiens 3.965444
36 3308 HSPA4 Homo sapiens 3.936441
37 308 ANXA5 Homo sapiens 3.913405
38 1506 CTRL Homo sapiens 3.903702
39 4838 NODAL Homo sapiens 3.871352
40 64073 C19ORF33 Homo sapiens 3.824958
41 11186 RASSF1 Homo sapiens 3.824184
42 185 AGTR1 Homo sapiens 3.818463
43 5806 PTX3 Homo sapiens 3.776246
44 3624 INHBA Homo sapiens 3.62444
45 284 ANGPT1 Homo sapiens 3.395681
46 92 ACVR2A Homo sapiens 3.378521
47 10887 PROKR1 Homo sapiens 3.326212
Biological Relevance of the Significant Genes
Using the AGE results, we examined the biological relevance, the similarities and differences
between the NP and PE placental gene sets. KEGG pathway maps were probed with
WebGes-talt (WEB-based GEne SeT AnaLysis Toolkit). Altogether, 207 and 126 KEGG pathways (
S8
&
S9
Tables) were significantly enriched respectively by PE and NP placental Absolutes genes
(p
<
0.05, with Hypergeometric tests: multiple testing correction (MTC) and BH; and a
mini-mum gene threshold of 2). All 126 pathways enriched by the NP placental genes were also
affected significantly in PE, but with higher enrichment ratios. We observed additional 81
pathways that were significantly affected only in PE placentae. The most highly affected
path-ways in PE include: Wnt signaling pathway; Long-term potentiation; Melanoma; TGF-beta
sig-naling pathway; T cell receptor sigsig-naling pathway; ErbB sigsig-naling pathway; mRNA
surveillance pathway; PPAR signaling pathway; Ubiquitin mediated proteolysis; and Hedgehog
signaling pathway (
Table 6
).
We repeated the analysis with the Relative significant genes, and 176 pathways were
signifi-cantly affected in PE placentae. Of these, 164 were correctly mapped to Absolute genes affected
pathways, but with variations in enrichment ratios. Examination of the 12 pathways affected
Table 4.(Continued)
Rank Gene ID Gene Symbol Species Score
48 811 CALR Homo sapiens 3.282796
49 3626 INHBC Homo sapiens 3.073992
50 6338 SCNN1B Homo sapiens 3.049242
51 10699 CORIN Homo sapiens 2.931029
52 3952 LEP Homo sapiens 2.826923
53 1E+08 PP13 Homo sapiens 2.819727
54 2689 GH2 Homo sapiens 2.808886
55 6870 TACR3 Homo sapiens 2.722579
56 719 C3AR1 Homo sapiens 2.722579
57 1392 CRH Homo sapiens 2.688973
58 7020 TFAP2A Homo sapiens 2.666521
59 6424 SFRP4 Homo sapiens 2.625932
60 186 AGTR2 Homo sapiens 2.527153
61 1491 CTH Homo sapiens 2.476149
62 6510 SLC1A5 Homo sapiens 2.446266
63 3162 HMOX1 Homo sapiens 2.423731
64 4012 LNPEP Homo sapiens 2.417434
65 284100 YWHAEP7 Homo sapiens 2.343263
66 391533 FLT1P1 Homo sapiens 2.343263
67 1096 CEACAMP8 Homo sapiens 2.343263
68 4543 MTNR1A Homo sapiens 2.336584
69 6515 SLC2A3 Homo sapiens 2.298985
70 9166 EBAG9 Homo sapiens 2.206506
71 4318 MMP9 Homo sapiens 2.15965
72 80831 APOL5 Homo sapiens 2.122071
73 2153 F5 Homo sapiens 2.046305
74 442899 MIR325 Homo sapiens 2.043218
75 259 AMBP Homo sapiens 2.039557
76 356 FASLG Homo sapiens 2.034258
only by the Relative Genes showed closer links with metabolism: (ID: Mismatch repair;
Homol-ogous recombination; Selenocompound metabolism; Sulfur relay system; Steroid biosynthesis;
Terpenoid backbone biosynthesis; Biotin metabolism; Vitamin B6 metabolism; Fatty acid
bio-synthesis; Riboflavin metabolism; Ubiquinone and other terpenoid-quinone biobio-synthesis;
Caf-feine metabolism).
Discussion
PE is a serious complication of human pregnancy. While previous studies have led to clear
descriptions of symptoms and diagnosis, our understanding of the genes altered in PE is still
limited. In an attempt to identify a common set of dysregulated genes in PE placentae, we
sub-jected a thoroughly screened subset of existing datasets to a robust set of analyses. Interestingly,
the data revealed that over a third of the genes identified in the literature as being implicated in
PE, were not identified as associated with or consistently expressed in PE placentae. This raises
the question of whether current trends in PE genomic investigations are accurately reflecting
the true nature of the molecular pathology of the condition.
In cognisance of this, we identified specific gene sets that have not been previously reported
for PE. Of these, there was an expectation that all the significant RGE genes would be mapped
to the AGE PE genes. Rather, only 51% of the RGE genes were identified from the AGE PE
genes. The remaining RGE significant genes showed varied levels of expression between PE
and NP placentae but were classified as inconsistent with RankProd analysis. In contrast, 77%
Table 5. Distribution of GLAD4U Genes in PE Gene Sets.
In PPA Genes In Relative Genes In Absolute Genes
FLT1 FLT1 FLT1 ANXA5
ENG ENG PGF NODAL
INHA TAC3 ENG AGTR1
PAPPA2 KISS1 LGALS13 PROKR1
HTRA4 PLAC1 GCM1 CALR
LEP VEGFA STOX1 INHBC
INHA HLA-G SCNN1B
PAPPA2 TAC3 LEP
KDR ERVW-1 GH2
HTRA4 KISS1 TACR3
ANXA5 PLAC1 CRH
AGTR1 CYR61 TFAP2A
INHBA HSD11B2 SFRP4
ANGPT1 INHA AGTR2
CALR ADM CTH
SCNN1B PAPPA2 SLC1A5
LEP PAPPA HMOX1
C3AR1 ERVFRD-1 LNPEP
CRH NOV MTNR1A
TFAP2A HTRA3 SLC2A3
SLC2A3 OLR1 APOL5
F5 EDN1 F5
HTRA4 AMBP
ANGPT2 FASLG
TGFB3
of the AGE genes did not match with the RGE genes. Of these, about 80% were genes that
showed low or similar levels of expression in both PE and NP but were consistently expressed
in PE placentae only.
Table 6. List of KEGG Pathways identified exclusively in PE Placenta.
Pathway Name
Wnt signaling pathway Intestinal immune network for IgA production
Long-term potentiation Valine, leucine and isoleucine biosynthesis
Melanoma One carbon pool by folate
TGF-beta signaling pathway Renin-angiotensin system
T cell receptor signaling pathway Alanine, aspartate and glutamate metabolism
ErbB signaling pathway African trypanosomiasis
mRNA surveillance pathway Fructose and mannose metabolism
PPAR signaling pathway Dorso-ventral axis formation
Ubiquitin mediated proteolysis Thyroid cancer
Hedgehog signaling pathway NOD-like receptor signaling pathway
Asthma Glycosaminoglycan biosynthesis—heparan sulfate
Valine, leucine and isoleucine degradation Nicotinate and nicotinamide metabolism
Pyrimidine metabolism Inositol phosphate metabolism
Type II diabetes mellitus Mucin type O-Glycan biosynthesis
Butanoate metabolism Other glycan degradation
RNA degradation Bladder cancer
Ribosome biogenesis in eukaryotes Nitrogen metabolism
Primary immunodeficiency Glycerophospholipid metabolism
Progesterone-mediated oocyte maturation Synthesis and degradation of ketone bodies Amyotrophic lateral sclerosis (ALS) Glycosphingolipid biosynthesis—globo series Glycosphingolipid biosynthesis—lacto and neolacto series RNA polymerase
Carbohydrate digestion and absorption SNARE interactions in vesicular transport
Galactose metabolism Primary bile acid biosynthesis
Fc epsilon RI signaling pathway Basal transcription factors
Propanoate metabolism Glycosaminoglycan biosynthesis—chondroitin sulfate
Allograft rejection Glycosylphosphatidylinositol(GPI)-anchor biosynthesis
Apoptosis Nucleotide excision repair
Endometrial cancer Glycosaminoglycan biosynthesis—keratan sulfate
Peroxisome Biosynthesis of unsaturated fatty acids
VEGF signaling pathway Phenylalanine, tyrosine and tryptophan biosynthesis
Histidine metabolism Circadian rhythm—mammal
p53 signaling pathway Pantothenate and CoA biosynthesis
Non-small cell lung cancer Glycosaminoglycan degradation
Type I diabetes mellitus Glycine, serine and threonine metabolism
Fatty acid metabolism Fatty acid elongation in mitochondria
Glyoxylate and dicarboxylate metabolism DNA replication
Basal cell carcinoma Base excision repair
Graft-versus-host disease Folate biosynthesis
Tyrosine metabolism D-Glutamine and D-glutamate metabolism
Lysine degradation Ether lipid metabolism
Glycerolipid metabolism
Pathways in order of descending adjustedsignificance levels (details of pathways available inS8Table).
Thus, the current findings show that the use of AGE analysis enables the description of a
comprehensive, globally and consistently expressed PE placental genes. On the other hand, the
findings show that overt use of RGE analysis to the disadvantage of AGE could limit gene sets
and our understanding of the real time and complexities of changes that could occur in the PE
state. These findings appear to confirm earlier reports [
23
,
24
] that RGE not only identifies
lim-ited candidate genes but could also exclude large proportion of genes that may be of relevance
in characterising the molecular pathology of a disease including those with low level expression
and genes with similar levels of expression in both the case and control samples. The findings
also seem to suggest that RGE could inherently identify genes whose expression patterns may
be inconsistent but might have large differential expression between control and case samples.
Generally, the roles of genes with low level expressions in a disease state are unclear.
How-ever, reports from stem cell research suggest that low level gene expression may be involved in
lineage priming and cell differentiation [
35
–
38
]. While such conclusions cannot be inferred as
yet in the placenta from the current study, our findings showed that the PE placenta retains its
ability to express the genes significantly regulated in NP placenta. The findings also showed the
presence of additional subsets of unique genes including low level expressed genes that were
consistently expressed only in PE placentae.
It could thus, be inferred from the current findings, albeit limited to RNA messages that: (1)
there may be apparent expression of a set of genes, that could be critical for the survival or
development of the placenta, and the pattern of expression of these genes might be similar in
both NP and PE placentae; (2) in PE placentae, there may be consistent regulation of excess
pool of genes (PE unique genes), that may exacerbate the activation of pregnancy-favourable
biological pathways or precipitate pregnancy-unfavourable biological pathways; (3) PE may be
a polygenic condition decompensated by the cumulative effect of multiple genes, each with
small effects, and there may be no single gene with a large effect. These were most evident in
the extent to which the molecular interaction and reaction pathways were affected in the PE
placentae.
We identified two sets of pathways: common pathways in both NP and PE placentae, and
unique pathways affected only in PE. The observation that the common pathways were
enriched either more negatively or positively in PE than in NP appeared to suggest a plausible
decompensation or exaggeration of normal placental functions as key factors in PE. Perhaps, of
greatest significance for future research is the identification of previously unidentified
dysregu-lated pathways in PE placentae such as: Histidine metabolism, Fc epsilon RI signaling pathway,
allograft rejection, graft vs. host disease, primary immunodeficiency and renin-angiotensin,
Wnt signaling, RNA degradation, and RNA Polymerase.
Wnt signaling, RNA degradation, and RNA Polymerase pathways were significantly
affected only in PE. The canonical Wnt pathway leads to regulation of gene transcription [
39
],
suggesting that PE could be linked to excessive gene expression in response to an autacoids or a
paracrine hormones such as histamine with regulatory roles on Wnt pathway [
40
].
Fc epsilon RI-mediated signaling pathway was also affected only in PE. This pathway in
mast cells are initiated by interaction of multivalent allogens with the extracellular domain of
the alpha chain of Fc epsilon RI to release preformed histamines, proteoglycans (especially
hep-arin), phospholipase A2 and subsequently, leukotrienes (LTC4, LTD4 and LTE4),
prostaglan-dins (especially PDG2), and cytokines including TNF-alpha, IL-4 and IL-5 [
48
]. These
mediators and cytokines contribute to inflammatory responses.
In the case of inflammatory pathways in PE, it is suggested that the nuclear factor
kappa-light-chain-enhancer of activated B cells (NF-
κ
B) pathway mediates excessive maternal
intra-vascular inflammation that leads to endothelial dysfunction [
49
,
50
]. In this context, it has been
hypothesised that PE arises as a result of an excessive maternal intravascular inflammatory
response to pregnancy, and that it involves the activation of both innate and the adaptive
immune system, neutrophil, and the complement system pathways [
50
–
54
].
Similarly, we identified allograft rejection, graft vs. host disease, and primary
immunodefi-ciency pathways as affected in PE. This observation is consistent with previous opinions that
heightened immune responses in PE pregnancies could be a consequence of chronic
feto-allo-graft rejection reaction [
55
]. Accordingly, PE shares similarities with graft rejection linked to
over activation of immune pathways [
56
–
61
]. Integral to this is the argument that
disequilib-rium of Th1/Th2 cytokine balance in favour of Th1 (IL-2, IL-12, IL-15, IL-18, IFNgamma,
TNFalpha vs. IL-4, IL-10, TGFbeta); precipitation of subsets of immunocompetent cells (T
CD4, suppressor gammadeltaT, cytotoxic T CD8, Treg, Tr1, uterine NK cells); innate
immu-nity (NK cytotoxic cells, macrophages, neutrophils and complement); adhesion molecules; fgl2
prothrombinase activation [
56
–
61
] and under-expression of Heme oxygenase-1 (HO-1) [
62
]
underpin the development of PE.
This opinion is however not universally supported. A recent review by Ahmed and Ramma
[
63
] appears to down-play the roles of inflammatory, hypoxia and immunologic pathways in
favour of angiogenic response as the cause of PE. They argue that recent work supports the
hypothesis that PE arises because of the loss of vascular endothelial growth factor (VEGF)
activity, which in turn is caused by increase in the levels of endogenous soluble fms-like
tyro-sine kinase-1 (sFlt-1), an anti-angiogenic factor [
63
]. SFlt-1 binds and reduces free circulating
levels of the pro-angiogenic factor VEGF, and thus inhibits the beneficial effects mediated by
flt-1 (also known as vascular endothelial growth factor receptor 1 (VEGFR-1)) on maternal
endothelium, with consequent maternal hypertension and proteinuria [
64
,
65
]. It is further
argued that altered balance of circulating pro-angiogenic/anti-angiogenic factors such sFlt-1,
soluble endoglin, and placenta growth factor (PlGF) are unique to PE [
63
–
67
]. This view is not
lost as we also identified VEGF signaling pathway as affected only in PE.
However, due to the complexity of pathways affected in PE, our findings contrast the
con-clusions drawn by Ahmed and Ramma [
63
]. Instead, our findings support a more global view
that multiple and concurrent dysregulated pathways underpin the aetiology of PE [
47
], and no
single pathway could be associated with the origins of PE.
These findings therefore provide the opportunity to re-examine current studies in PE to
reflect the consistently expressed genes that are unique to PE placentae or biological pathways,
especially those that may be exclusively affected in PE placentae, to improve our understanding
of the molecular pathology or the genomic basis of PE.
Supporting Information
S1 Table. Profile of Microarray Series Excluded from PE Meta-analysis.
S2 Table. Profile of Samples Rejected after INMEX Quality Appraisal.
(XLSX)
S3 Table. Relative PE Genes (Expressions in PE Placenta relative to NP Placentae).
(XLSX)
S4 Table. Genes down-regulated in both NP and PE placentae.
(XLSX)
S5 Table. Genes exclusively down-regulated in PE.
(XLSX)
S6 Table. Genes Up-regulated in both PE and NP.
(XLSX)
S7 Table. Genes exclusively Up-regulated in PE (not in NP).
(XLSX)
S8 Table. Significantly Pathways Affected in PE Placentae.
(XLSX)
S9 Table. Significantly Affected Pathways in NP Placentae.
(XLSX)
S10 Table. PRISMA Checklist.
(DOC)
S11 Table. Full Electronic Search Strategy for Gene Expression Omnibus (GEO).
(DOCX)
Author Contributions
Conceived and designed the experiments:
OB AW MHFS.
Performed the experiments:
OB.
Analyzed the data:
OB MHFS.
Contributed reagents/materials/analysis tools:
OB AW.
Wrote the paper:
OB MHFS AW.
References
1. Khan KS, Wojdyla D, Say L, Gulmezoglu AM, Van Look PF. WHO analysis of causes of maternal death: a systematic review. Lancet. 2006; 367: 1066–1074. PMID:16581405
2. Duley L. The global impact of pre-eclampsia and eclampsia. Semin Perinatol. 2009; 33: 130–137. doi: 10.1053/j.semperi.2009.02.010PMID:19464502
3. WHO. World Health Statistics. Geneva: World Health Organisation; 2014.
4. Say L, Chou D, Gemmill A, Tuncalp O, Moller AB, Daniels J, et al. Global causes of maternal death: a WHO systematic analysis. Lancet Glob Health. 2014; 2: e323–33. doi:10.1016/S2214-109X(14) 70227-XPMID:25103301
5. NICE. Hypertension in pregnancy: diagnosis and management. NICE clinical guideline 107. 2011.
7. Chesley LC, Cooper DW. Genetics of hypertension in pregnancy: possible single gene control of pre-eclampsia and pre-eclampsia in the descendants of eclamptic women. Br J Obstet Gynaecol. 1986; 93: 898–908. PMID:3768285
8. Arngrimsson R, Bjornsson S, Geirsson RT, Bjornsson H, Walker JJ, Snaedal G. Genetic and familial predisposition to eclampsia and pre-eclampsia in a defined population. Br J Obstet Gynaecol. 1990; 97: 762–769. PMID:2242360
9. Cincotta RB, Brennecke SP. Family history of pre-eclampsia as a predictor for pre-eclampsia in primi-gravidas. Int J Gynaecol Obstet. 1998; 60: 23–27. PMID:9506410
10. Esplin MS, Fausett MB, Fraser A, Kerber R, Mineau G, Carrillo J, et al. Paternal and maternal compo-nents of the predisposition to preeclampsia. N Engl J Med. 2001; 344: 867–872. PMID:11259719
11. Nilsson E, Salonen RH, Cnattingius S, Lichtenstein P. The importance of genetic and environmental effects for pre-eclampsia and gestational hypertension: a family study. BJOG. 2004; 111: 200–206. PMID:14961879
12. Buurma AJ, Turner RJ, Driessen JH, Mooyaart AL, Schoones JW, Bruijn JA, et al. Genetic variants in pre-eclampsia: a meta-analysis. Hum Reprod Update. 2013; 19: 289–303. doi:10.1093/humupd/ dms060PMID:23300202
13. Sitras V, Fenton C, Acharya G. Gene expression profile in cardiovascular disease and preeclampsia: a meta-analysis of the transcriptome based on raw data from human studies deposited in Gene Expres-sion Omnibus. Placenta. 2015; 36: 170–178. doi:10.1016/j.placenta.2014.11.017PMID:25555499
14. Myatt L. Role of placenta in preeclampsia. Endocrine. 2002; 19: 103–111. PMID:12583607
15. Matsuo K, Kooshesh S, Dinc M, Sun CC, Kimura T, Baschat AA. Late postpartum eclampsia: report of two cases managed by uterine curettage and review of the literature. Am J Perinatol. 2007; 24: 257– 266. PMID:17447188
16. Graves JA. Review: Sex chromosome evolution and the expression of sex-specific genes in the pla-centa. Plapla-centa. 2010; 31 Suppl: S27–S32. doi:10.1016/j.placenta.2009.12.029PMID:20163856
17. Barbaux S, Gascoin-Lachambre G, Buffat C, Monnier P, Mondon F, Tonanny MB, et al. A genome-wide approach reveals novel imprinted genes expressed in the human placenta. Epigenetics. 2012; 7: 1079–1090. PMID:22894909
18. Vaiman D, Calicchio R, Miralles F. Landscape of transcriptional deregulations in the preeclamptic pla-centa. PLoS One. 2013; 8: e65498. doi:10.1371/journal.pone.0065498PMID:23785430
19. Kleinrouweler CE, van Uitert M, Moerland PD, Ris-Stalpers C, van der Post JA, Afink GB. Differentially expressed genes in the pre-eclamptic placenta: a systematic review and meta-analysis. PLoS One. 2013; 8: e68991. doi:10.1371/journal.pone.0068991PMID:23874842
20. Schena M, Shalon D, Davis RW, Brown PO. Quantitative monitoring of gene expression patterns with a complementary DNA microarray. Science. 1995; 270: 467–470. PMID:7569999
21. Dudley AM, Aach J, Steffen MA, Church GM. Measuring absolute expression with microarrays with a calibrated reference sample and an extended signal intensity range. Proc Natl Acad Sci U S A. 2002; 99: 7554–7559. PMID:12032321
22. Simon R, Radmacher MD, Dobbin K. Design of studies using DNA microarrays. Genet Epidemiol. 2002; 23: 21–36. PMID:12112246
23. Simon R, Radmacher MD, Dobbin K, McShane LM. Pitfalls in the use of DNA microarray data for diag-nostic and progdiag-nostic classification. J Natl Cancer Inst. 2003; 95: 14–18. PMID:12509396
24. Breitling R, Armengaud P, Amtmann A, Herzyk P. Rank products: a simple, yet powerful, new method to detect differentially regulated genes in replicated microarray experiments. FEBS Lett. 2004; 573: 83– 92. PMID:15327980
25. Jeffery IB, Higgins DG, Culhane AC. Comparison and evaluation of methods for generating differen-tially expressed gene lists from microarray data. BMC Bioinformatics. 2006; 7: 359. PMID:16872483
26. Hong F, Breitling R. A comparison of meta-analysis methods for detecting differentially expressed genes in microarray experiments. Bioinformatics. 2008; 24: 374–382. doi:10.1093/bioinformatics/ btm620PMID:18204063
27. Xia J, Fjell CD, Mayer ML, Pena OM, Wishart DS, Hancock RE. INMEX—a web-based tool for integra-tive meta-analysis of expression data. Nucleic Acids Res. 2013; 41: W63–W70. doi:10.1093/nar/ gkt338PMID:23766290
28. Saeed AI, Sharov V, White J, Li J, Liang W, Bhagabati N, et al. TM4: a free, open-source system for microarray data management and analysis. BioTechniques. 2003; 34: 374–378. PMID:12613259
30. Wang J, Duncan D, Shi Z, Zhang B. WEB-based GEne SeT AnaLysis Toolkit (WebGestalt): update 2013. Nucleic Acids Res. 2013; 41: W77–W83. doi:10.1093/nar/gkt439PMID:23703215
31. Kanehisa M, Goto S. KEGG: kyoto encyclopedia of genes and genomes. Nucleic Acids Res. 2000; 28: 27–30. PMID:10592173
32. Hochberg Y, Benjamini Y. More powerful procedures for multiple significance testing. Stat Med. 1990; 9: 811–818. PMID:2218183
33. Hulsen T, de Vlieg J, Alkema W. BioVenn—a web application for the comparison and visualization of biological lists using area-proportional Venn diagrams. BMC Genomics. 2008; 9: 488. doi:10.1186/ 1471-2164-9-488PMID:18925949
34. Jourquin J, Duncan D, Shi Z, Zhang B. GLAD4U: deriving and prioritizing gene lists from PubMed litera-ture. BMC Genomics. 2012; 13 Suppl 8: S20. doi:10.1186/1471-2164-13-S8-S20PMID:23282288
35. Crotta S, Nicolis S, Ronchi A, Ottolenghi S, Ruzzi L, Shimada Y, et al. Progressive inactivation of the expression of an erythroid transcriptional factor in GM- and G-CSF-dependent myeloid cell lines. Nucleic Acids Res. 1990; 18: 6863–6869. PMID:1702202
36. Jimenez G, Griffiths SD, Ford AM, Greaves MF, Enver T. Activation of the beta-globin locus control region precedes commitment to the erythroid lineage. Proc Natl Acad Sci U S A. 1992; 89: 10618– 10622. PMID:1438257
37. Hu M, Krause D, Greaves M, Sharkis S, Dexter M, Heyworth C, et al. Multilineage gene expression pre-cedes commitment in the hemopoietic system. Genes Dev. 1997; 11: 774–785. PMID:9087431
38. Hipp JA, Hipp JD, Atala A, Soker S. Functional genomics: new insights into the 'function' of low levels of gene expression in stem cells. Curr Genomics. 2010; 11: 354–358. doi:10.2174/
138920210791616680PMID:21286313
39. Hayward P, Kalmar T, Arias AM. Wnt/Notch signalling and information processing during development. Development. 2008; 135: 411–424. doi:10.1242/dev.000505PMID:18192283
40. Diks SH, Hardwick JC, Diab RM, van Santen MM, Versteeg HH, van Deventer SJ, et al. Activation of the canonical beta-catenin pathway by histamine. J Biol Chem. 2003; 278: 52491–52496. PMID: 14563838
41. Brew O, Sullivan M.H., L L, Roller S. Histidine Decarboxylase Activity in Normal and Pre-eclamptic Pla-centae. Placenta. 2005; 26: A56.
42. Brew O, Sullivan MH. The links between maternal histamine levels and complications of human preg-nancy. J Reprod Immunol. 2006.
43. Block WD, Westhoff MH, Steele BF. Histidine metabolism in the human adult: histidine blood tolerance, and the effect of continued free L-histidine ingestion on the concentration of imidazole compounds in blood and urine. J Nutr. 1967; 91: 189–194. PMID:6021220
44. Salway JG, editor. Metabolism at a glance. 3rd ed. Alden, Mass.: Blackwell Pub; 2004.
45. Chaddha V, Viero S, Huppertz B, Kingdom J. Developmental biology of the placenta and the origins of placental insufficiency. Semin Fetal Neonatal Med. 2004; 9: 357–369. PMID:15691771
46. Fisher SJ. The placental problem: linking abnormal cytotrophoblast differentiation to the maternal symptoms of preeclampsia. Reprod Biol Endocrinol. 2004; 2: 53. PMID:15236649
47. Ilekis JV, Tsilou E, Fisher S, Abrahams VM, Soares MJ, Cross JC, et al. Placental origins of adverse pregnancy outcomes: potential molecular targets: an Executive Workshop Summary of the Eunice Kennedy Shriver National Institute of Child Health and Human Development. Am J Obstet Gynecol. 2016.
48. Kambayashi T, Koretzky GA. Proximal signalling events in Fc epsilon RI-mediated mast cell activation. J Allergy Clin Immunol. 2007; 119: 544–52; quiz 553–4. PMID:17336609
49. Aban M, Cinel L, Arslan M, Dilek U, Kaplanoglu M, Arpaci R, et al. Expression of nuclear factor-kappa B and placental apoptosis in pregnancies complicated with intrauterine growth restriction and preeclamp-sia: an immunohistochemical study. Tohoku J Exp Med. 2004; 204: 195–202. PMID:15502418
50. Redman CW, Sacks GP, Sargent IL. Preeclampsia: an excessive maternal inflammatory response to pregnancy. Am J Obstet Gynecol. 1999; 180: 499–506. PMID:9988826
51. Greer IA, Dawes J, Johnston TA, Calder AA. Neutrophil activation is confined to the maternal circulation in pregnancy-induced hypertension. Obstet Gynecol. 1991; 78: 28–32. PMID:2047063
52. Prieto JA, Panyutich AV, Heine RP. Neutrophil activation in preeclampsia. Are defensins and lactoferrin elevated in preeclamptic patients? J Reprod Med. 1997; 42: 29–32. PMID:9018642
54. Lynch AM, Murphy JR, Byers T, Gibbs RS, Neville MC, Giclas PC, et al. Alternative complement path-way activation fragment Bb in early pregnancy as a predictor of preeclampsia. Am J Obstet Gynecol. 2008; 198: 385.e1–385.e9.
55. Martinez-Varea A, Pellicer B, Perales-Marin A, Pellicer A. Relationship between maternal immunologi-cal response during pregnancy and onset of preeclampsia. J Immunol Res. 2014; 2014: 210241. doi: 10.1155/2014/210241PMID:24987708
56. Wegmann TG, Lin H, Guilbert L, Mosmann TR. Bidirectional cytokine interactions in the maternal-fetal relationship: is successful pregnancy a TH2 phenomenon? Immunol Today. 1993; 14: 353–356. PMID: 8363725
57. Weetman AP. The immunology of pregnancy. Thyroid. 1999; 9: 643–646. PMID:10447007
58. Raghupathy R. Pregnancy: success and failure within the Th1/Th2/Th3 paradigm. Semin Immunol. 2001; 13: 219–227. PMID:11437629
59. Saito S, Sakai M. Th1/Th2 balance in preeclampsia. J Reprod Immunol. 2003; 59: 161–173. PMID: 12896820
60. Dong M, He J, Wang Z, Xie X, Wang H. Placental imbalance of Th1- and Th2-type cytokines in pre-eclampsia. Acta Obstet Gynecol Scand. 2005; 84: 788–793. PMID:16026406
61. Wilczynski JR. Immunological analogy between allograft rejection, recurrent abortion and pre-eclamp-sia—the same basic mechanism? Hum Immunol. 2006; 67: 492–511. PMID:16829304
62. Linzke N, Schumacher A, Woidacki K, Croy BA, Zenclussen AC. Carbon monoxide promotes prolifera-tion of uterine natural killer cells and remodeling of spiral arteries in pregnant hypertensive heme oxyge-nase-1 mutant mice. Hypertension. 2014; 63: 580–588. doi:10.1161/HYPERTENSIONAHA.113. 02403PMID:24366077
63. Ahmed A, Ramma W. Unravelling the theories of pre-eclampsia: are the protective pathways the new paradigm? Br J Pharmacol. 2015; 172: 1574–1586. doi:10.1111/bph.12977PMID:25303561
64. Andraweera PH, Dekker GA, Roberts CT. The vascular endothelial growth factor family in adverse pregnancy outcomes. Hum Reprod Update. 2012; 18: 436–457. doi:10.1093/humupd/dms011PMID: 22495259
65. Ahmed A, Dunk C, Kniss D, Wilkes M. Role of VEGF receptor-1 (Flt-1) in mediating calcium-dependent nitric oxide release and limiting DNA synthesis in human trophoblast cells. Lab Invest. 1997; 76: 779– 791. PMID:9194854
66. Ahmed A, Li XF, Dunk C, Whittle MJ, Rushton DI, Rollason T. Colocalisation of vascular endothelial growth factor and its Flt-1 receptor in human placenta. Growth Factors. 1995; 12: 235–243. PMID: 8619929