IJEDR1402097
International Journal of Engineering Development and Research (www.ijedr.org)1887
Optimal & Fast Placement of DG Unit CPF Method
Using MATLAB Toolbox PSAT
1
Mayur D. Rathod,
2Alpesh S.Adeshara
1P.G. Student (Electrical Power System), 2Senior Lecturer
Electrical Engineering Department, V. V. P. Engineering College, Rajkot, India
1[email protected], 2[email protected]
____________________________________________________________________________________________________
Abstract
-
The voltage stability problem is occurring while increasing the loading parameters on power system networkbuses. One of the reasons of increasing the loading parameter is consumption of reactive power. Distributed generator has capacity for absorbing and injecting both active and reactive power in the distribution network and so many other benefits from DG unit. By placing the DG in system at right bus, there would be improvement the voltage stability margin and improvement voltage profile for each load bus. Continuation power flow method is used as power flow and finds the most sensitive bus for voltage collapse by the help of PV curve. IEEE 14 bus system is used for study and analysis in MATLAB tool box PSAT.
Index Terms - Distributed Generator (DG), Voltage stability, PV curve, Voltage stability margin (VSM), Continuation
power flow (CPF) method, and Voltage profile.
________________________________________________________________________________________________________
I. INTRODUCTION
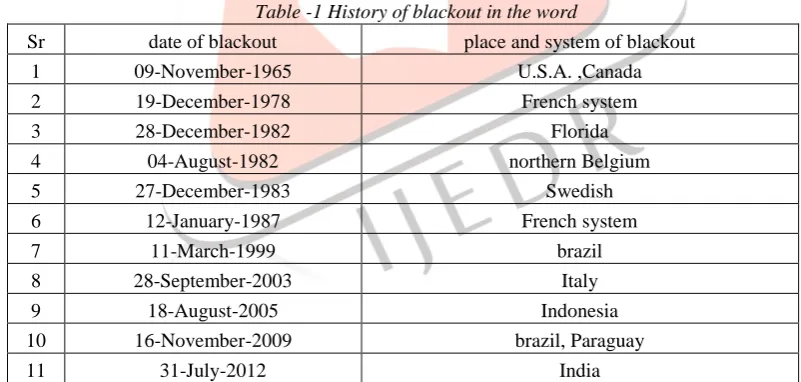
Voltage stability phenomena are most important part for any distribution network in power system. Major Black out cases is generating by voltage instability phenomena. There are so many times black out cases are occurring in the world. In the histories, the blackout was doing so many times due to voltage collapse. Show in table 1 the history of the black out in the all over the word.
Table -1 History of blackout in the word
Sr date of blackout place and system of blackout
1 09-November-1965 U.S.A. ,Canada
2 19-December-1978 French system
3 28-December-1982 Florida
4 04-August-1982 northern Belgium
5 27-December-1983 Swedish
6 12-January-1987 French system
7 11-March-1999 brazil
8 28-September-2003 Italy
9 18-August-2005 Indonesia
10 16-November-2009 brazil, Paraguay
11 31-July-2012 India
As shown in the table 1, all the blackout phenomena are occur due to large loading on the system. When the system was, being the over loaded then the voltage stability violated and system voltage has been collapse and black out the system.
The main purpose of DG is to maintain voltage profile and obtained maximum steady state voltage stability index [1][2][3][4]. DG improves voltage profile at different power factor [5]. For improving the voltage profile, Sometime capacitor bank is also used with DG [6]. For the placing the distributed generation, it is necessary to maintain the location and rating of DG on network. DG is capable for reducing losses and maintains transient stability also [7][8].
IJEDR1402097
International Journal of Engineering Development and Research (www.ijedr.org)1888
II. DISTRIBUTED GENERATIONDG include so many different definition from different point of views on small- scale technologies such as photovoltaic (PV), fuel cells, micro-turbines, or small wind turbines are installed and designed for primarily back- up and to serve a single end users site[9][10]. DG is encompassing any generation and it is built near consumers’ load as per its requirement of size or energy source shown in Figure 1 and 2.
generation switching substation customer
Fig. 1: Schematic Diagram of Conventional Electricity Generation And Distribution
Substation Customer
Customer Generator
Generator
Fig. 2: Schematic Diagram of the Distributed Generation Closer To the Customer
Distributed generation (DG) gives so many benefits as electrical loss reduction, technological innovations, environmental impact benefit, better power quality, economical operation, reliable service; the grid has to be available as backup supply new decentralized market construction etc. But the main interesting concepts are technological innovations, changing economic and environments. International Energy Agency IEA [11] enlists the five main factors that contribute to this evolution, such as constraints on the Construction of new transmission lines, developments in distributed generation technologies, the electricity market liberalization, and concerns about climate change, increased customer demand for highly reliable electricity shown in table 2. DG can reduce the line losses by either supplying or absorbing active or reactive power[12][13].
Table 2- Distributed Generator Benefits and Service [10] Benefit
DG
Ser
v
ices
Energy cost saving
Savings in T&D losses and congestion
costs
Deferred generation
capacity
Deferred T&D capacity
System reliability
benefits
Power quality Benefits
Land use Effects
Reduced vulnerability
to terrorism
Reduction in Peak Power Requirements
Yes Yes Yes Yes Yes Yes Yes Yes
Provision of Ancillary
Services
o Operating Reserves
o Regulation
o Black start
o Reactive Power
Yes Yes Yes Yes Yes Yes Yes Yes
Emergency Power Supply
Yes Yes No No Yes Yes No No
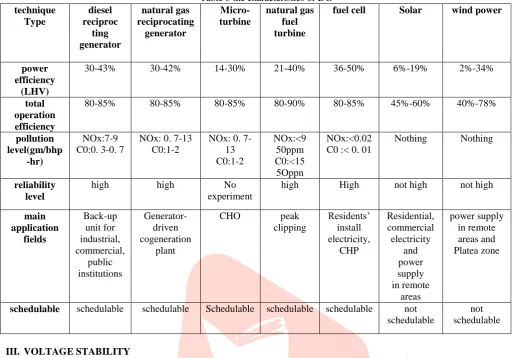
DG Technology
All types of DG technology and technical characteristics are described in table 3 DG unit is capable of reactive or active power control base on main three technologies: [1][14][15][16]
i. Synchronous Generator ii. Asynchronous Generators
iii. Line-Commutated and Self-Commutated Converters
IJEDR1402097
International Journal of Engineering Development and Research (www.ijedr.org)1889
Table 3 the characteristics of DGtechnique Type
diesel reciproc
ting generator
natural gas reciprocating
generator
Micro-turbine
natural gas fuel turbine
fuel cell Solar wind power
power efficiency
(LHV)
30-43% 30-42% 14-30% 21-40% 36-50% 6%-19% 2%-34%
total operation efficiency
80-85% 80-85% 80-85% 80-90% 80-85% 45%-60% 40%-78%
pollution level(gm/bhp
-hr)
NOx:7-9 C0:0. 3-0. 7
NOx: 0. 7-13 C0:1-2
NOx: 0. 7-13 C0:1-2
NOx:<9 50ppm C0:<15
5Oppn
NOx:<0.02 C0 :< 0. 01
Nothing Nothing
reliability level
high high No
experiment
high High not high not high
main application
fields
Back-up unit for industrial, commercial,
public institutions
Generator-driven cogeneration
plant
CHO peak
clipping
Residents’ install electricity,
CHP
Residential, commercial electricity
and power supply in remote
areas
power supply in remote areas and Platea zone
schedulable schedulable schedulable Schedulable schedulable schedulable not schedulable
not schedulable
III. VOLTAGE STABILITY
“Voltage stability is the ability of a power system to maintain steady acceptable voltages at all buses in the system under normal operating conditions and after being subjected to a disturbance.”[17]
A system enters a state of voltage instability when a disturbance due to increase in load, the system changes causes voltage quickly being drop, automatic system of controlling unit fail to halt the decay [17]. The voltage decay may take just a few seconds or ten to twenty minutes. If the decay continually, steady-state voltage stability will have violated and voltage collapse will occur Generation and transmission units have definite capacities that are peculiar to them. These limits should not be exceeding in a healthy power system. Voltage stability problem arises when the system is heavily loaded that causes to go beyond limitations of power system [18].The main factor causing instability is the inability of the power system to meet the demand for reactive power [17] [19].
IV. PV CURVES
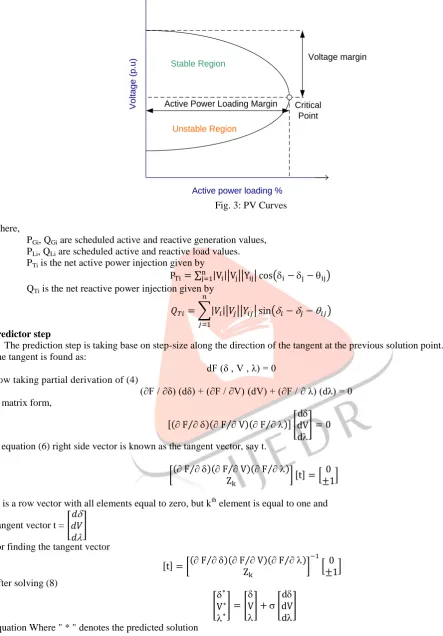
The PV curves represent the voltage variation with respect to the variation of load reactive power. This curve is produced by a series of load flow solutions for different load levels uniformly distributed, by keeping constant the power factor. With increasing the power network the time taken to generate PV curve is also increase because of processing time of load flow is increase [20]. PV curve give information about the voltage stability index and voltage collapse point. Shown in Figure 3 it indicate stability region of any network and voltage collapse point. The PV voltage stability analysis gives the transfer limits by a PV study. Another purpose of PV study is to analysis the voltage stability, screens the entire system, and identifies disturbances that may have the potential to cause a major system blackout or create contingency situation [21].
V. CONTINUATION POWER FLOW (CPF) METHOD
CPF method is represented as follow [22] Formulation power flow
The continuation power flow is tracing the solution path for nonlinear system by prediction and correction steps. Considering the non-linear equation
F (δ, V, λ) = 0 (1) The λ presents the load parameter witch limitation is presented by
0 ≤ λ≤ λ critical
Conventional equations for each bus i is as follows
PG i - PLi - PT i = 0 (2)
IJEDR1402097
International Journal of Engineering Development and Research (www.ijedr.org)1890
V
o
lt
a
g
e
(
p
.u
)
Active power loading % Stable Region
Unstable Region
Active Power Loading Margin
Voltage margin
Critical Point
Fig. 3: PV Curves
Where,
PGi, QGi are scheduled active and reactive generation values,
PLi, QLi are scheduled active and reactive load values.
PTi is the net active power injection given by
∑ | || || | ( ) QTi is the net reactive power injection given by
∑| || || | ( )
Predictor step
The prediction step is taking base on step-size along the direction of the tangent at the previous solution point. The tangent is found as:
dF (δ , V , λ) = 0 (4)
Now taking partial derivation of (4)
(∂F / ∂δ) (dδ) + (∂F / ∂V) (dV) + (∂F / ∂ λ) (dλ) = 0 (5) In matrix form,
[( ⁄ )( ⁄ )( ⁄ )] [ ] (6)
In equation (6) right side vector is known as the tangent vector, say t.
[( ⁄ )( ⁄ )( ⁄ )] [ ] [
] (7)
Zk is a row vector with all elements equal to zero, but k th
element is equal to one and Tangent vector t = [ ]
For finding the tangent vector
[ ] [( ⁄ )( ⁄ )( ⁄ )]
[
] (8)
After solving (8)
[ ] [ ] [ ] (9)
Equation Where " * " denotes the predicted solution
Corrector step
Corrector step is taking after predicting step size selection of tangent vector.
[ ] (10)
IJEDR1402097
International Journal of Engineering Development and Research (www.ijedr.org)1891
Where,n1 and n2 are the number of PQ and PV- buses respectively, n = Total no. of buses in the given system,
Ng = No. of generator (PV) buses and Ns = No. of slack bus in the given system
This equation, which is augmented, by one equation in original set of equations sets the value of one of the state variables:
(11)
Thus new set of equations is:
[ ( )] [ ] (12)
VI. CASE STUDIES
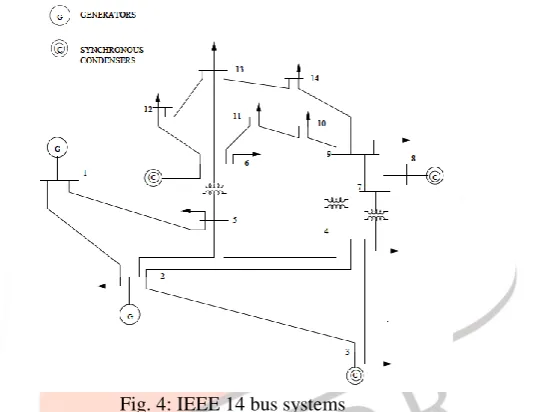
For analysis, MATLAB tool box PSAT is used. The one line diagram of 14-bus IEEE system shown in Figure 4 in this Figure, the main generator is connected to the bus 1 and bus 2. Bus 1 is treated as slack bus where bus 2 is treated as generation bus or PV bus. Other generators are connected to the bus 3, 6 and 8, which are synchronous compensator. These three buses are purely load buses.
Fig. 4: IEEE 14 bus systems
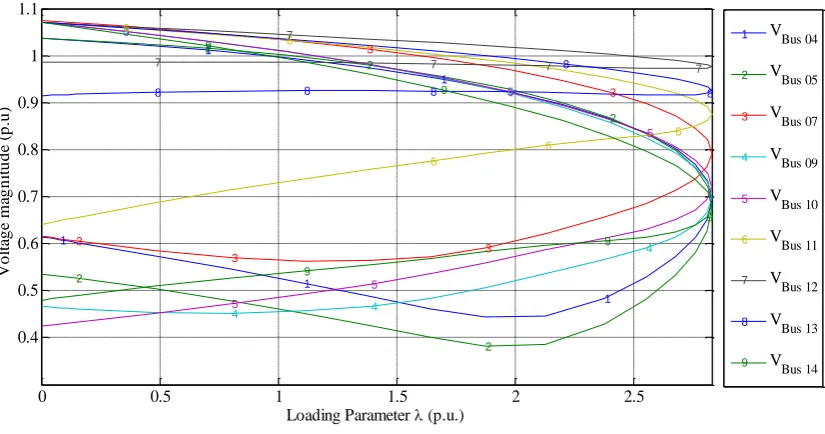
After the running CPF for 14 bus system, voltage magnitude of bus 4, 5, 9 10 and 14 is down than other buses as shown in Figure 5. PV curve is describing the steady state stability of each load bus as in Figure 6. PV curve of each individual bus is indicate bus no 5, 10 ,and 14 are the critical for voltage collapse that mean DG placement at these buses are most preferable.
Fig. 5: Voltage profiles of all buses
If we assume system is operated at 1 p.u loading parameter than maximum lambda is 2.5159 and voltage stability margin is 60.20% as per following equation.
(13)
Where, system actual operating loading value
1 2 3 4 5 6 7 8 9 10 11 12 13 14 0
0.2 0.4 0.6 0.8 1 1.2 1.4
V
[
p
.u
.]
Voltage Magnitude Profile
IJEDR1402097
International Journal of Engineering Development and Research (www.ijedr.org)1892
Fig. 6: PV Curve of each load buses without DGHere, Solar Photo-Voltaic generator with constant PQ model is used as DG which is capable for generating 25MW active power and 20MVar reactive power with 15sec Inverter time response.
Fig. 7: PV Curve of each load bus with DG at 5th, 10th and 14th bus
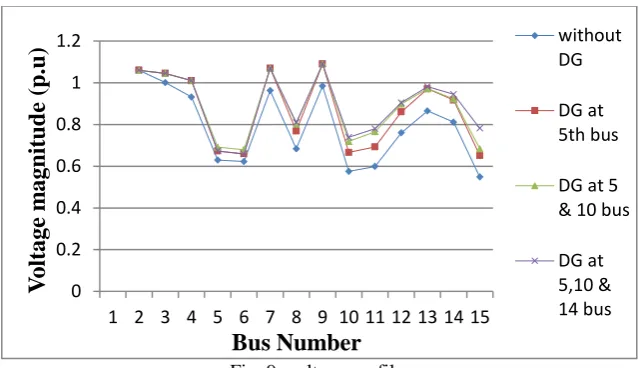
With penetration of DG, there will be improve the maximum load ability of system and voltage stability of each bus and improve voltage profile of system also as shown in Figure 7,8 and 9. Figure 8 indicate the voltage stability margin of system and Figure 9 indicates the improvement in voltage profile of each bus.
Fig. 8: voltage stability margin of system
0 0.5 1 1.5 2 2.5
0.4 0.5 0.6 0.7 0.8 0.9 1 1.1
Loading Parameter (p.u.)
V o lt ag e m ag n it u d e (p .u ) 1 1 1 1 1 2 2 2 2 2 3 3 3 3 3 4 4 4 4 4 5 5 5 5 5 6 6 6 6 6 7 7
7 7 7
8 8 8
8 8 9 9 9 9 9
VBus 04
VBus 05
VBus 07
VBus 09
VBus 10
VBus 11
VBus 12
VBus 13
VBus 14 9 8 7 6 5 4 3 2 1
0 0.5 1 1.5 2 2.5 3
0.4 0.5 0.6 0.7 0.8 0.9 1 1.1 1.2 1.3
Loading Parameter (p.u.)
V o lt ag e m ag n it u d e (p .u ) 1 1 1 1 1 2 2 2 2 2 3 3 3 3 3 4 4 4 4 4 5 5 5 5 5 6 6 6 6 6
7 7 7 7 7
8 8 8
8 8 9 9 9 9 9 V Bus 04
VBus 05
V
Bus 07
VBus 09
VBus 10
V Bus 11 V Bus 12 V Bus 13 V Bus 14 9 8 7 6 5 4 3 2 1 60.20%
65.40% 67%
68.50%
55.00% 60.00% 65.00% 70.00%
1 2 3 4
IJEDR1402097
International Journal of Engineering Development and Research (www.ijedr.org)1893
Fig. 9: voltage profilesVII. CONCLUSION
Distributed generation unit is capable for injecting and absorbing the reactive power then it would be improve the reactive power flow. Resultant of increasing the reactive power flow, voltage profile of each bus and loading capacity of system are increase due to increasing the system stability margin.
REFERENCES
[1] Hasan hedayati, s. a. nabaviniaki, and adel akbarimajd, “A method for placement of dg units in distribution networks”, IEEE transactions on power delivery, Vol. 23 , 0885-8977 ,pp. 1620 - 1628 ,2008.
[2] R. S. Al Abri,, Ehab F. El-Saadany,and Yasser M. Atwa,“Optimal Placement and Sizing Method to Improve the Voltage Stability Margin in a Distribution System Using Distributed Generation,” IEEE transactions on power systems, vol. 28, no. 1, pp. 326 – 334, February 2013.
[3] M. Ettehadi, S. Vaez-Zadeh, and H. Ghasemi ,”DG placement in distribution networks considering voltage stability” Environment and Electrical Engineering International Conference (EEEIC), 978-1-4577-1830-4, pp. 41 - 46 - IEEE - May 2012.
[4] M. Abdel-Akher, A. A. Ali, A. M. Eid H. El-Kishky “Optimal Size and Location of Distributed Generation,” Energy Conversion Congress and Exposition (ECCE) - 978-1-4577-0542-7, pp. 104 - 108, 2011- IEEE.
[5] V.V.S.N. Murthy, Ashwani Kumar, “Comparison of optimal DG allocation methods in radial distribution systems based on sensitivity approaches”, Electrical Power and Energy Systems, Vol. 53, pp. 450–467, December 2013.
[6] S. Gopiya Naik , D.K. Khatod, M.P. Sharma “Optimal allocation of combined DG and capacitor for real power loss minimization in distribution networks” Electrical Power and Energy Systems, vol. 53, pp 967–973, December 2013.
[7] Mahnaz Moradijoz, Azam Ghazanfarimeymand, Mohsen Parsa Moghaddam, Mahmud Reza Haghifam , “Optimum Placement of Distributed Generation and Parking Lots for Loss Reduction in Distribution Networks” Electrical Power Distribution Networks (EPDC)- 978-1-4673-1418-3, pp. 1 – 5, 2012.
[8] M. Rez, P. H. Schavemaker, J. G. Slootweg, W. L. Kling,and L. van der Sluis,“Impacts of Distributed Generation Penetration Levels on Power Systems Transient Stability” Power Engineering Society General Meeting- 0-7803-8465-2 ,vol. 2, pp. 2150 - 2155 2004.
[9] Thomas Ackermann, Goran Andersson , Lennart Soder ,“Distributed generation: a definition”, Electric Power Systems Research, Vol. 57, Issue 3, pp. 195–204 , April 2001.
[10]Peter A. Daly and Jay Morrison, “Understanding the Potential Benefits of Distributed Generation on Power Delivery Systems” Rural Electric Power Conference- 0-7803-7012-0, pp. A2/1 - A213, 2001-IEEE.
[11]International Energy Agency, “Distributed Generation in Liberalised Electricity Markets”, 2002. Available at: http://www.iea.org.
[12]P. Chiradeja, “Benefit of Distributed Generation: A Line Loss Reduction Analysis,” IEEE, Transmission and Distribution Conference and Exhibition: Asia and Pacific- 0-7803-9114-4, pp. 1 – 5, 2005 IEEE/PES.
[13]M.M. Aman,G.B. Jasmon , H. Mokhlis , A.H.A. Bakar ,“Optimal placement and sizing of a DG based on a new power stability index and line losses,” Electrical Power and Energy Systems,vol- 43, pp. 1296–1304. Vol. 43, Issue 1, pp. 1296– 1304, December 2012.
[14]B. Awad, J. Wu, N. Jenkins, “Control of distributed generation” Elektrotechnik & Informationstechnik, Vol. 125, Issue 12, pp. 409-414, December 2008.
[15]“Assessment of Distributed Generation Technology Applications,” Resource Dynamics Corporation, www.distributed-generation.com.
[16]F.H. Guan, D.M. Zhao, X. Zhang, B.T Shan, Z. Liu, “Research on Distributed Generation Technologies and its impacts on Power System”, Sustainable Power Generation and Supply- 978-1-4244-4934-7 ,pp. 1 – 6, April 2009
[17]P. Kundur, “Power System Stability and Control”, McGraw-Hill, 1994
[18]Scott Greene Ian Dobson Fernando L. Alvarado,” Sensitivity of the loading margin to voltage collapse with respect to arbitrary parameters”, IEEE Transactions on Power Systems- 0885-8950, Vol. 12, No. 1, pp. 262 - 272 ,February 1997.
0 0.2 0.4 0.6 0.8 1 1.2
1 2 3 4 5 6 7 8 9 10 11 12 13 14 15
V
oltage
m
agn
itud
e
(p.u
)
Bus Number
without DG
DG at 5th bus
DG at 5 & 10 bus
IJEDR1402097
International Journal of Engineering Development and Research (www.ijedr.org)1894
[19]T. Van Cutsem, “A Method to compute Reactive Power Margins with respect to Voltage Collapse”, IEEE Transaction onPower Systems- 0885-8950, Vol. 6, No. 1, pp. 145 - 156 February 1991.
[20]Chandrabhan Sharma, and Marcus G. Ganness, “Determination of the Applicability of using Modal Analysis for the Prediction of Voltage Stability”, Transmission and Distribution Conference and Exposition- 978-1-4244-1903-6, pp. 1 - 7, IEEE/PES 2008.
[21]Yang Zhang , Sidharth Rajagopalan and José Conto, “Practical Voltage Stability Analysis” , Power and Energy Society General Meeting- 978-1-4244-6549-1, pp. 1 - 7 ,2010- IEEE.
![table 2. DG can reduce the line losses by either supplying or absorbing active or reactive power Table 2- Distributed Generator Benefits and Service [10]](https://thumb-us.123doks.com/thumbv2/123dok_us/8574031.1393385/2.595.33.555.388.651/reduce-supplying-absorbing-reactive-distributed-generator-benefits-service.webp)